


ABSTRACT
We use the first systematic samples of CO millimeter emission in z ⩾ 1 ''main-sequence'' star-forming galaxies to study the metallicity dependence of the conversion factor αCO, from CO line luminosity to molecular gas mass. The molecular gas depletion rate inferred from the ratio of the star formation rate (SFR) to CO luminosity, is ∼1 Gyr−1 for near-solar metallicity galaxies with stellar masses above MS ∼ 1011 M☉. In this regime, the depletion rate does not vary more than a factor of two to three as a function of molecular gas surface density or redshift between z ∼ 0 and 2. Below MS the depletion rate increases rapidly with decreasing metallicity. We argue that this trend is not caused by starburst events, by changes in the physical parameters of the molecular clouds, or by the impact of the fundamental-metallicity–SFR–stellar mass relation. A more probable explanation is that the conversion factor is metallicity dependent and that star formation can occur in ''CO-dark'' gas. The trend is also expected theoretically from the effect of enhanced photodissociation of CO by ultraviolet radiation at low metallicity. From the available z ∼ 0 and z ∼ 1–3 samples we constrain the slope of the log(αCO)–log (metallicity) relation to range between −1 and −2, fairly insensitive to the assumed slope of the gas–SFR relation. Because of the lower metallicities near the peak of the galaxy formation activity at z ∼ 1–2 compared to z ∼ 0, we suggest that molecular gas masses estimated from CO luminosities have to be substantially corrected upward for galaxies below MS.
Export citation and abstract BibTeX RIS
1. INTRODUCTION
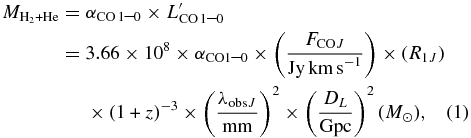
The evolution of galactic star formation as a function of cosmic time is driven by the complex interplay of interstellar gas components and their chemical evolution, stars and their radiation and feedback, star formation processes, and galactic/intergalactic environments. In the Milky Way and nearby galaxies, most or all star formation occurs in dense, cool giant molecular clouds (GMCs; Solomon et al. 1987; Young & Scoville 1991; Blitz 1993; McKee & Ostriker 2007; Bigiel et al. 2008; Leroy et al. 2008; Bolatto et al. 2008; Schruba et al. 2011). The most commonly used tracer of the H2 molecule, the elusive building block of GMCs, is line emission from low-lying rotational transitions of 12CO. This is perhaps surprising since these transitions are optically thick (τCO 1–0 ⩾ 10) in typical GMCs. The information on gas mass is mainly contained in the width of the line if the gas motions in GMCs are virialized and if the line emission in a given object is the superposition of a number of such virialized clouds (Dickman et al. 1986; Solomon et al. 1987). As a result, the relationship between velocity-integrated line flux FCO J (Jy km s−1) in the J → J − 1 transition and the total molecular gas mass (including 36% helium) on large scales is traditionally given by the empirical relation (Dickman et al. 1986; Appendix A in Tacconi et al. 2008; Obreschkow & Rawlings 2009)
where
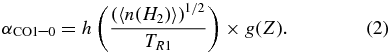
Here L'CO 1–0 (K km s−1 pc2) is the integrated line luminosity of the 1–0 CO line, R1J is the ratio of the product of the Rayleigh–Jeans brightness temperature TR and the beam filling factor in the 1 → 0 transition to the same product in the J → J − 1 transition (at the same angular resolution), λobs J is the observed wavelength of the J → J − 1 transition and DL is the luminosity distance of the source.20 The functions h and g encapsulate the dependence of the function αCO 1–0 (M☉/(K km s−1 pc2), commonly called ''conversion factor,'' on the physical conditions of the interstellar medium (ISM) and on the metallicity Z. The conversion factor depends on the ratio of the square-root of the mean hydrogen density 〈n(H2)〉 and the Rayleigh–Jeans brightness temperature (see footnote 20). It also depends on the spatial distribution and mass fraction of the molecular gas (relative to stars) in the cloud, and potentially on other parameters, such as the magnitude of turbulence in the GMCs, etc. (Downes et al. 1993; Downes & Solomon 1998; Obreschkow & Rawlings 2009; Tacconi et al. 2008; Pelupessy & Papadopoulos 2009; Shetty et al. 2011a, 2011b; Narayanan et al. 2011b; Glover & Mac Low 2011; Feldmann et al. 2011). Since the penetration depth of external ultraviolet (UV) radiation destroying molecules depends on the extinction through the cloud, and thus on its metallicity, the optical depth and the effective conversion factor in CO transitions are predicted to depend on metallicity, especially in low-metallicity, diffuse gas (van Dishoeck & Black 1986, 1988; Maloney & Black 1988; Sternberg & Dalgarno 1995; Hollenbach & Tielens 1999; Wolfire et al. 1990, 2010; Pelupessy & Papadopoulos 2009; Shetty et al. 2011a; Glover & Mac Low 2011).
In the galaxy-integrated ISMs of the Milky Way and nearby star-forming galaxies (SFGs) with near-solar metallicity, as well as in dense star-forming clumps of lower-mass, lower-metallicity galaxies, the empirical CO 1–0 conversion factors determined with dynamical, dust, and γ-ray calibrations are consistent with a single value of αCO 1–0 = αG = 4.36 ± 0.9 M☉/(K km s−1 pc2) (Strong & Mattox 1996; Dame et al. 2001; Grenier et al. 2005; Bolatto et al. 2008; Leroy et al. 2011; Abdo et al. 2010). In these environments, GMCs appear to have similar physical properties and the functions h and g do not vary much (Bigiel et al. 2008, 2011; Leroy et al. 2008). In star-forming regions or starburst galaxies the higher average densities drive αCO 1–0 upward. However, when combined with the simultaneous decrease in αCO 1–0 due to the higher gas temperatures caused by stellar heating in the same regions, the overall conversion factor αCO 1–0 fortuitously does not change more than a factor of two even in these cases. More significant deviations of αCO 1–0 from the Galactic value occur in extreme merger-driven starbursts, where the Galactic conversion factor appears to overestimate the true gas masses (αCO 1–0 ⩽ 1; Solomon et al. 1997; Scoville et al. 1997; Downes & Solomon 1998; Tacconi et al. 2008). In the outer part of the Milky Way and other z ∼ 0 disk galaxies, as well as in low-metallicity dwarf galaxies the Galactic conversion factor appears to underestimate the true molecular hydrogen content (e.g., Strong et al. 2004; Abdo et al. 2010; Schruba et al. 2011). This suggests that in z ∼ 0 SFGs αCO 1–0 scales with gas-phase oxygen abundance ZO ≡ 12 + log{O/H} as ZO−0.7...−2 (Rubio et al. 1993; Wilson 1995; Arimoto et al. 1996; Israel 1997, 2000; Boselli et al. 2002; Leroy et al. 2011; Bolatto et al. 2011). However, a much shallower dependence of αCO on ZO is inferred for dense extragalactic star-forming clouds, presumably because their higher column densities are sufficient to maintain a large optical depth in the UV continuum and the CO 1–0 line, despite the lower oxygen abundances (e.g., Bolatto et al. 2008).
In this paper, we present a pilot study of the dependence of αCO 1–0 on metallicity at high redshift, based on the first systematic measurements of CO emission in several samples of massive z > 1 SFGs. We find that the application of a Galactic conversion factor underestimates molecular masses in some of these systems by factors between 2 and 10. The outliers are low-metallicity galaxies. We propose a first-order empirical relation to correct the CO → H2 conversion factor at z ⩾ 1 for this metallicity effect.
Throughout the paper, we use a standard Wilkinson Microwave Anisotropy Probe ΛCDM cosmology (Komatsu et al. 2011) and a Chabrier (2003) initial stellar mass function. To convert the 3–2 and 2–1 line fluxes to 1–0 fluxes we take R13 = 2 and R12 = 1.16 from recent empirical calibrations (Weiss et al. 2007; Dannerbauer et al. 2009; Ivison et al. 2011; Riechers et al. 2010), with the exception of the more compact Eyelash, where Danielson et al. (2011) find R13 = 1.5 (see Genzel et al. 2010 for more details). The total molecular gas masses in this paper computed with αG = 4.36 (which includes a 1.36 upward correction for helium) are the same as those in Genzel et al. (2010), who use αG = 3.2 (but do not include the helium correction in the conversion factor).
2. PROPERTIES OF THE OBSERVED GALAXIES
2.1. Galaxy Sample
In this paper, we discuss recent galaxy-integrated measurements of the 12CO 3–2 and 2–1 lines in z ∼ 1–3 ''normal'' massive SFGs. Most were drawn from the CO 3–2 observations of z ∼ 1–2 SFGs of the Tacconi et al. (2010) and Tacconi & Combes IRAM Large Programs (henceforth ''LP''). The LP data and the smaller CO 2–1 z ∼ 1.5 sample of Daddi et al. (2010a) were taken with the IRAM Plateau de Bure millimeter Interferometer (Guilloteau et al. 1992; Tacconi et al. 2010 and L. J. Tacconi et al., in preparation). The LP SFGs are drawn from two samples with median redshifts of 〈z〉 = 1.2 and 〈z〉 = 2.2. They are matched to cover the same ranges of stellar mass (M* = 3–30 × 1010 M☉) and star formation (20–300 M☉ yr−1). The LP sample used in this paper has 21 detections between z = 1 and 1.5, and 11 detections and 5 upper limits between z = 2 and 2.4. We also include four detections from Daddi et al. (2010a) at 〈z〉 = 1.5, with comparable selection criteria as in the LP sample. To these sets we add the detections of three somewhat lower-mass (M* = 5–30 × 109 M☉), strongly lensed SFGs (cB58: z = 2.7, Baker et al. 2004; ''Cosmic Eye": z = 3.1, Coppin et al. 2007; ''Eyelash'': z = 2.3, Swinbank et al. 2010; Danielson et al. 2011). For a description of the observations and the data analysis, refer to the papers above.
The galaxies we are analyzing exhibit a correlation between stellar mass (M*) and star formation rate (SFR), or stellar mass and specific star formation rate (sSFR = SFR/M*), the so-called star formation "main sequence" (Schiminovich et al. 2007; Noeske et al. 2007). Galaxies near the ''main-sequence'' make up 90% of the cosmic star formation density at z ∼ 1.5–2.5 (Rodighiero et al. 2011). The relation has a substantial scatter of rms ± 0.3 dex at z ∼ 0.5–2 (Figure 1; Elbaz et al. 2007; Noeske et al. 2007; Daddi et al. 2007; Rodighiero et al. 2010; Mancini et al. 2011). ''Main-sequence'' SFGs have disk-like morphologies with low Sérsic indices (nS ∼ 1) and, compared to off-main-sequence systems, have relatively large effective radii (Wuyts et al. 2011). Most of the galaxies in our sample are extended rotating disks in Hα integral field spectroscopy data sets, Hubble Space Telescope (HST) rest-frame UV/optical images, or CO high-resolution interferometry maps (Förster Schreiber et al. 2009; Law et al. 2009; Tacconi et al. 2010; Daddi et al. 2010a; Mancini et al. 2011; F. Combes et al., in preparation). A few are compact, dispersion-dominated systems (Law et al. 2009; Förster Schreiber et al. 2009; Tacconi et al. 2010). Their SFRs thus are 5–30 times smaller than bright submillimeter-selected galaxies in the same redshift range that are starbursts and often appear to be major mergers (Greve et al. 2005; Engel et al. 2010). Based on their CO or Hα kinematics, and/or their HST high-resolution morphology, only one galaxy in our current sample (BX528) is a merger (Tacconi et al. 2010; L. J. Tacconi et al., in preparation; Shapiro et al. 2008; Förster Schreiber et al. 2009).

Figure 1. Specific star formation rate (sSFR = SFR/M*) as a function of stellar mass for the z = 1–1.4 SFGs (open crossed red squares) and z = 1.5–3 SFGs (open crossed blue circles) of our sample. The orange and blue shaded regions (and orange and blue lines) denote the location of the ''main-sequence'' at these redshifts, as determined from Noeske et al. (2007), Rodighiero et al. (2010), Förster Schreiber et al. (2009), and Mancini et al. (2011). The dotted line denotes the LP survey limit in SFR (SFR ∼ 20–40 M☉ yr−1).
Download figure:
Standard image High-resolution image2.2. Metallicities
For 14 z ⩾ 1 SFGs we have individual determinations of gas-phase metallicities based on the [N ii]/Hα estimator of Pettini & Pagel (2004: ZO = 8.9 + 0.57 log (F([N ii])/F(Hα))). Of these 14, 6 galaxies were observed with the SINFONI integral field spectrometer as part of the SINS program (Förster Schreiber et al. 2009), and 8 galaxies with long slit spectroscopy (Teplitz et al. 2000; Erb et al. 2006b; D. K. Erb et al. 2009, private communication; Richard et al. 2011; P. Buschkamp et al., in preparation). The rms dispersion of the Pettini & Pagel relation is ±0.18 dex for 7.5 < ZO < 8.6. For the rest we determined metallicities from the stellar-mass–metallicity relation at the respective redshifts (Erb et al. 2006b; P. Buschkamp et al., in preparation; Shapley et al. 2005; Liu et al. 2008; ZO = a + 2.18 log(M*) − 0.0896 log(M*)2, with a = −4.51 for z = 1.5–3, and a = −4.45 for z ∼ 1–1.5). This includes two active galactic nuclei with measured [N ii]/Hα (Erb et al. 2006b), for which we also adopt the metallicities estimated from the mass–metallicity relation. The rms dispersion of the z ∼ 2 mass–metallicity relation is ±0.09 dex, which is a measure of the statistical error. Metallicities derived from the mass–metallicity relation should thus not be much more uncertain than those inferred from [N ii]/Hα. Systematic uncertainties between different metallicity indicators and calibrations are larger and can exceed 0.3 dex (e.g., Kewley & Ellison 2008). The [N ii]/Hα estimator is known (e.g., Pettini & Pagel 2004) to saturate above solar metallicity (Z☉ ∼ 8.69 (±0.05); Asplund et al. 2009). To minimize this systematic effect, we converted all metallicities to the Denicoló et al. (2002) calibration system (also based on [N ii]/Hα), with the conversion function given in Table 3 of Kewley & Ellison (2008). The transformation onto the Denicoló et al. scale delivers the best agreement (i.e., smallest scatter) between different metallicity calibrators. It optimizes the comparison to the z ∼ 0 metallicity estimates, especially at the high M* end (Kewley & Ellison 2008), which is particularly important for our study. The systematic uncertainties within the Denicoló et al. (2002) system and over the observed range should be within ±0.2 dex (Kewley & Ellison 2008). Relative uncertainties from the measurement errors in [N ii]/Hα and the mass–metallicity relation are much smaller (see typical red error bar at the bottom of Figure 3). For the 14 SFGs with metallicity estimates from both methods the rms scatter between the two methods is ±0.1 dex.
Our final sample of 44 z ⩾ 1 SFGs covers inferred oxygen abundances from ZO ∼ 8.4 to 8.9 on the Denicoló et al. (2002) scale. For comparison to z ∼ 0 SFGs of different metallicities we used the recent compilations of Leroy et al. (2011) and Krumholz et al. (2011). Wherever possible, we replaced their quoted metallicities with [N ii]/Hα-based metallicities from the published literature, with the same calibrations as for the high-z data. Most of the [N ii]/Hα-derived metallicities are very similar to the ones given by Leroy et al. and Krumholz et al.
3. RESULTS
The following analysis was initially triggered by our finding (discussed in Tacconi et al. 2008) an increasing number of galaxies in the IRAM LP z ∼ 2 sample that are very faint or not detected in CO 3–2, despite their large SFRs. Given the PdBI sensitivity and the long (up to 20–30 hr) integration times, we had expected to detect these targets easily. Yet, other galaxies with similar masses and SFRs were detected as expected. As an example, Figure 2 shows the images and normalized Hα and CO 3–2 spectra for two such cases, ZC406690 and Q2343 BX610. These two z ∼ 2 SFGs are at opposite extremes of the metallicity distribution of our sample, but otherwise have very similar SFRs (210–290 M☉ yr−1), dynamical masses (⩾1011 M☉), sizes (R1/2 ∼ 4–6 kpc), and matter surface densities (102.5 to 103 M☉ pc−2; Genzel et al. 2008, 2011). Both are clumpy rotating disks (vc, max ∼ 300 km s−1). Their stellar masses and metallicities differ by factors of 4 and 2.3, respectively. Their CO 3–2 to extinction-corrected Hα flux ratios differ by 5.4. While the CO 3–2 line is well detected in BX610 (ZO = 8.8) it is at best marginally detected in ZC406690 (ZO = 8.4). Likewise, in the clumpy, rotating disk BX482 (ZO = 8.5, SFR ∼ 120 M☉ yr−1, R1/2 = 4.2 kpc, vc max = 240 km s−1, Genzel et al. 2008, 2011; Förster Schreiber et al. 2009, 2011) the ratio of the 3σ upper limit in CO 3–2 to the extinction-corrected Hα flux is three times lower than in BX610.

Figure 2. Variation in CO flux to Hα flux for two massive z ∼ 2 SFGs with different metallicities (and stellar masses), at the extremes of the observed distribution, but otherwise similar SFRs, sizes, and dynamical masses. The top and bottom insets show the rest-frame UV/optical stellar images (Genzel et al. 2011; Förster Schreiber et al. 2011), Hα/[N ii] (dotted red; Genzel et al. 2011; Förster Schreiber et al. 2009) and CO 3–2 spectra (continuous blue, this paper) for ZC406690 (Mancini et al. 2011) and Q2343 BX610 (Erb et al. 2006b; Genzel et al. 2008). The CO 3–2 and Hα/[N ii] spectra are normalized such that they both have a peak normalized value of unity for BX610. The low-metallicity SFG ZC406690 has 5.4 times smaller CO to Hα flux ratio than the high-metallicity SFG BX610.
Download figure:
Standard image High-resolution imageWe will present evidence in the next sections that these puzzling findings are not random but are caused by the dependence of the galaxy-integrated CO luminosity per molecular gas mass on gas phase oxygen abundance. To prove convincingly that such an effect is present requires an estimate of the intrinsic molecular (H2) gas mass. Unfortunately this cannot be obtained directly. We argue in the next subsection that the high-z Kennicutt–Schmidt relation between molecular gas mass and SFR is now understood well enough that it can be used to derive a good enough measure, albeit indirect, of the intrinsic molecular gas mass of a distant galaxy.
3.1. The Kennicutt–Schmidt (KS) Relation
In his seminal 1998 paper, Kennicutt (1998, henceforth K98) established that the star formation surface density Σstar form and the total (atomic + molecular) gas surface density Σgas in z ∼ 0 SFGs (including ultra-luminous infrared galaxy mergers, ULIRGs) are related through

with a best-fit slope of n ∼ 1.4. More recent studies of galaxy-integrated and spatially resolved KS-relations (on kpc scales) in nonmerger SFGs near the star formation main sequence and near solar metallicity have found that the SFR surface density correlates mainly with the molecular gas surface density, Σmol gas (Kennicutt et al. 2007; Bigiel et al. 2008; Schruba et al. 2011). The ''molecular'' KS-relation is flatter, with n ∼ 1.0–1.3 for Σmol gas ∼ 10 to 103.5 M☉ pc−2 for near-solar metallicity disk galaxies and a constant Galactic conversion factor (Kennicutt 2008; Bigiel et al. 2008; Leroy et al. 2008; Daddi et al. 2010b; Genzel et al. 2010; Schruba et al. 2011).
We show in Figure 3 an update of the galaxy-integrated KS-relations shown in Figures 2 and 3 of Genzel et al. (2010), amended with the additional new z ⩾ 1 data discussed in this paper. We used αCO 1–0 = αG for all data. To our knowledge, Figure 3 is the largest compilation of both low- and high-z galaxy-integrated KS-measurements so far in the literature. The z ∼ 0 SFG sample (all observed in CO 1–0) includes many more SFGs, moderate starburst galaxies (e.g., M82, NGC 253, NGC 3256), and luminous infrared galaxies (LIRGs) than K98, but no ultraluminous LIRG (ULIRG) mergers (see Genzel et al. 2010 for details). These additional z ∼ 0 SFGs span more than three orders of magnitude in molecular gas surface density, from the lower limit of the mostly molecular gas-dominated regime at 5–10 M☉ pc−2 (Blitz & Rosolowsky 2006) to dense circumnuclear starbursts with >104 M☉ pc−2. The z ∼ 0 SFGs also overlap with the entire range of the z ⩾ 1 SFGs (observed in 3–2 for the z ∼ 1–1.5 and z ∼ 2–2.4 IRAM galaxies, and the lenses, and in CO 2–1 for the z ∼ 1.5 Daddi et al. 2010a SFGs). The spatially resolved KS-studies of Kennicutt et al. (2007), Bigiel et al. (2008), Leroy et al. (2008), and Schruba et al. (2011) cover the range of 10–100 M☉ pc−2 and are in excellent agreement with the galaxy-integrated data shown here. For computing surface densities, half light radii were taken from molecular observations themselves at z ∼ 0, and from a mixture of CO, Hα-, and rest-frame UV-continuum sizes for z > 1 (Genzel et al. 2010).

Figure 3. CO-based molecular gas depletion rate ((tdepletion)−1 = SFR/(αGL'CO1–0)) as a function of molecular gas (H2 + He) surface density. The molecular gas mass is inferred from the observed CO 3–2/2–1 flux/luminosity from Equations (1) and (2) with R13 = 2 (1.5 for the eyelash) or R12 = 1.16, and αCO 1–0 = αG = 4.36. The open gray circles are nonmerger, near-main-sequence, and moderately high-mass z ∼ 0 SFGs from the compilation in Genzel et al. (2010). The z ∼ 0 sample does include many more LIRGs and moderate starbursts than the K98 sample, but no ULIRG mergers. Blue circles, black triangles, and red squares denote z > 1 SFGs from the IRAM LP program (Tacconi et al. 2010, and unpublished), plus the z ∼ 1.5 SFGs from Daddi et al. (2010a), in the metallicity ranges ZO = 12+log(O/H) > 8.76, 8.62–8.76, and <8.62, respectively. Oxygen abundances ZO for the z > 1 SFGs were derived either from the [N ii]/Hα ratio, or from the stellar-mass–metallicity relation, as described in Section 2.2. The metallicities are on the Denicoló et al. (2002) calibration. In this form of the KS-relation, constant molecular depletion times or rates are horizontal lines. Depletion timescales of 1 and 2 Gyr are marked by dashed gray and magenta lines. The dotted blue line is the best overall linear fit (KS-slope n = 1.1) to all z ∼ 0 SFGs, plus the super-solar (ZO > 8.7) tail of the z > 1 SFGs. The long–short-dashed green line is the best fit of slope 0.3 (KS-slope n = 1.3). The different colored arrows on the right side denote the mean depletion rates for the galaxy samples of the same color. These are −0.16 (±0.04) for 62 z ∼ 0 SFGs, 0.018 (±0.047) for 23 z > 1 SFGs with ZO > 8.76, 0.2 (±0.047) for 14 z > 1 SFGs with 8.76 > ZO > 8.62, and 0.34 (±0.045) for 7 z > 1 SFGs with ZO < 8.62. The numbers in parentheses are the 1σ uncertainties of the mean. The black diagonal arrows in the upper right show in which direction the data points would move if the true conversion factor is half of or twice the Galactic value.
Download figure:
Standard image High-resolution imageFor the best examination of the slope of the KS-relation, we plot in Figure 3 on the vertical axis the ratio of SFR (or its surface density) to molecular gas mass (or its surface density), inferred from the CO line observations with α = αG. This is the molecular gas depletion rate (tdepletion(CO))−1. An n = 1 KS-relation (a constant depletion rate independent of gas surface density) corresponds to a horizontal line. The best fit to all z ∼ 0 SFGs and the z ⩾ 1 SFGs above solar metallicity (ZO > 8.7) yields a slope of n = 1.1 (±0.06), in the middle of the range of slopes found in the literature from both spatially resolved and galaxy-integrated z ∼ 0 studies. The slope of the z ⩾ 1 SFGs with ZO > 8.7 is marginally flatter (n = 0.9 ± 0.12). Given the fairly large (±0.3 dex; K98; Kennicutt et al. 2007, Figure 3) scatter of the relation, as well as the systematic uncertainties in the slope determinations of ±0.2 to ±0.25 (see discussion in Genzel et al. 2010), Occam's razor suggests that all data sets are consistent with a universal, near-unity slope, assuming that αCO does not vary systematically with Σmol gas (see the discussion at the end of this section).
There does appear to be a small but statistically significant offset in the average depletion rates at z ∼ 0 and z > 1 (Figure 3, Genzel et al. 2010). The average depletion rate is 0.4–0.5 Gyr−1 at z ∼ 0 and ∼1 Gyr−1 at z = 1–2.5 (Leroy et al. 2008; Bigiel et al. 2011; Tacconi et al. 2010; Daddi et al. 2010a, 2010b; Genzel et al. 2010; Bauermeister et al. 2010; Saintonge et al. 2011). Saintonge et al. (2011) find a positive correlation of the depletion rate with sSFR, with an ∼0.5 dex difference in depletion rate between the highest and smallest sSFR SFGs in Figure 3. This variation is consistent with the scatter in Figure 3 (rms ± 0.3 dex for z ∼ 0 SFGs, and ±0.2 dex for ZO > 8.7, z > 1 SFGs).
To explore the dependence of the KS-slope on CO excitation and the rotational quantum number J of the observed line, Narayanan et al. (2011a) have carried out numerical hydro-simulations of star formation in the molecular ISM with an input volumetric star formation relation,  . Here tff is the local free-fall time in the molecular clouds. Narayanan et al. find that the resulting gas–star-formation–surface-density relation depends on the rotational quantum number J of the CO line used for tracing the molecular gas. For m = 1.5 (tff∝ρ−1/2) and conditions similar to z ⩾ 1 SFGs or z ∼ 0 starbursts the simulations yield n(J = 1) ∼ 1.47 and n(J = 3) ∼ 1.08. The data in Figure 3 are clearly not consistent with this result, since the z ∼ 0 data (observed in CO 1–0) and the z > 1 data (observed in CO 2–1 and 3–2) both have n ∼ 1 and the difference in slope is less than 0.3, even if the fit uncertainties are included. A better match to the simulations occurs for m = 1 (tff = const.), for which Narayanan et al. predict n(J = 1) = 0.96 and n(J = 3) = 0.76. This case would apply if the molecular interstellar media in the different SFGs consist of collections of clouds with similar properties (Bigiel et al. 2008), or if the SFGs are in a state of marginal gravitational stability. For the latter case the Toomre Q-parameter is near unity, and the local free-fall timescale above becomes similar to the global dynamical timescale (cf., Genzel et al. 2010). The former explanation may be relevant for the z ∼ 0 disks, while the latter is applicable to the z ⩾ 1 SFGs.
Could there be a dependence of αCO on Σmol gas? There are plausible reasons discussed in Section 3.3 and Tacconi et al. (2008) (due to the n(H2)1/2/T dependence of αCO) that such a dependence should be present to some extent (see Appendix A and Figure 10 in Tacconi et al. 2008). Based on the available empirical data the possible change of αCO in the range sampled in Figure 3 may be about a factor of two (0.3 dex). To explore the impact of such a change we have applied an artificial shift of −0.3 dex to all galaxies with surface densities >103 M☉ pc−2 (M82 is at 103.4), and then refitted the KS-relation. This results in an overall KS-slope of 1.22 instead of 1.1, again within the systematic slope uncertainties.
A final point relates to the issue of atomic hydrogen in the KS-relation. We have mentioned that all galaxies in Figure 3 are above ∼5–10 M☉ pc—2, where the z ∼ 0 pressure–H2 relation of Blitz & Rosolowsky (2006) indicates that almost all hydrogen is in molecular form. However, the combined effects of strong stellar feedback, shocks, and turbulence in starbursts and high-z SFGs may lower the fraction of H2 to total (star-forming) gas at a given gas surface density, relative to that in normal z ∼ 0 disks. In this case, the gas surface densities are lower limits to the total (star-forming) gas in each galaxy. It is plausible that this correction decreases from low to high gas surface densities, suggesting that the intrinsic KS-relation (with these corrections added) is still flatter than indicated by the data in Figure 3.
3.2. The Ratio SFR/(αG LCO 1–0) Increases with Decreasing Metallicity
Given this fairly universal KS-relation for massive SFGs at both low- and high-redshifts, we can now ask whether there is a systematic dependence of the depletion rate on metallicity. In Figure 3, we plot the depletion rate of the z > 1 SFGs as a function of Σmol gas for three different metallicity bins, assuming αG = 4.36 for all bins. Super-solar, high-metallicity galaxies (ZO > 8.76) are marked by blue filled circles, SFGs with 8.76 > ZO > 8.62 are denoted by black triangles, and the lowest metallicity galaxies in our sample (ZO < 8.62) are marked by filled red squares. There is a significant difference in the inferred depletion rates for these three metallicity bins. At least for the highest and middle bins the number of galaxies is large enough to see that the galaxies in each bin follow a fairly flat KS-relation but are offset from one another. The offset in the lowest metallicity bin is even larger but the number of galaxies is too small to estimate the KS-slope. This appearance of flat KS-relations ''peeling off'' vertically as a function of ZO is exactly what is expected if the variations were due to differences in αCO(ZO) between the metallicity bins.
Another representation of the same data is given in Figure 4, where we plot the depletion rate as a function of gas phase oxygen abundance in the z ∼ 1–2.5 SFGs of our sample. At or above solar metallicity all z ⩾ 1 SFGs approach SFR/(αGL'CO 1–0) ∼ 1 Gyr−1, in agreement with the discussion above, and with a scatter that is consistent with the measurement uncertainties. Below solar metallicity, the data exhibit a trend of rapidly increasing SFR/(αGL'CO 1–0) with decreasing oxygen abundance. The trend at z ⩾ 1 is similar to that found at z ∼ 0. Data points with metallicities derived from [N ii]/Hα and from the mass–metallicity relation agree within the uncertainties discussed in Section 2.2.

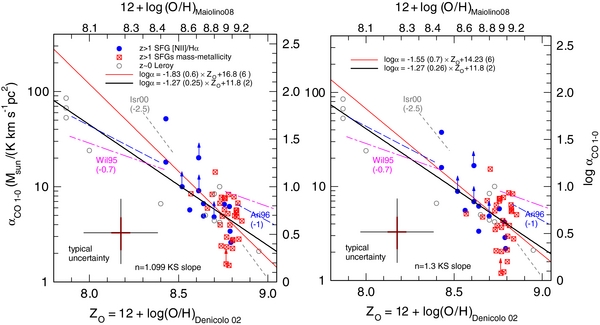
Figure 4. Dependence of the molecular gas depletion rate for a Galactic conversion factor (including helium), (tdepletion(CO, αG))−1 = SFR/(αG L'CO 1–0), on gas-phase oxygen abundance on the Denicoló et al. (2002) scale (bottom) and the Maiolino et al. (2008) scale (top). The molecular gas mass is inferred from the observed CO 3–2/2–1 flux/luminosity from Equations (1) and (2) with R13 = 2 (1.5 for the eyelash) or R12 = 1.16, and αCO 1–0 = αG = 4.36. The blue filled circles denote CO detections or 3σ upper limits of z = 1–2.5 SFGs with individual determinations of the oxygen abundance based on the [N ii]/Hα ratio, the Pettini & Pagel (2004) relation (ZO = 12 + log(O/H) = 8.9 + 0.57 log(F([N ii]/F(Hα))), and then converted to the Denicoló et al. (2002) calibration scale by using the conversion functions given in Kewley & Ellison (2008). The crossed red squares mark CO detections/upper limits with metallicities inferred from the stellar-mass–metallicity relation of Erb et al. (2006a), Liu et al. (2008), and P. Buschkamp et al. (in preparation), again converted to the Denicoló et al. scale. Open gray circles denote the compilation of z ∼ 0 SFGs from Krumholz et al. (2011), for which metallicities were derived from [N ii]/Hα ratios in the literature, and then again converted to the Denicoló et al. (2002) calibration. The best-fit depletion timescales for near-solar metallicity SFGs are tdepletion ∼ 2 Gyr at z ∼ 0 (Bigiel et al. 2008, 2011; Leroy et al. 2008) and ∼1 Gyr at z ∼ 1–2.5 (Tacconi et al. 2010; this paper), which are shown as dashed horizontal lines. The large cross at the bottom denotes the typical statistical (red) and systematic (black) rms errors. The blue dashed line is a theoretical prediction of the dependence of (tdepletion)−1 on ZO for a molecular cloud of constant column density similar to that in Milky Way GMCs (∼80 M☉ pc−2, N(H) = 7.5 × 1021 cm−2) and a ratio of UV radiation field to density similar to that in the solar neighborhood, for a star formation cloud filling factor fV = 0.2 (Krumholz et al. 2011).
Download figure:
Standard image High-resolution image3.3. The Variation in SFR/LCO 1–0 is not due to Changes in Physical Gas Depletion Time or ISM Conditions
Can the trends in Figures 3 and 4 be driven by a physical change in depletion rate or in the ISM properties, and is metallicity the primary underlying variable? At z ∼ 0 the lowest metallicity star-forming systems are dwarf/irregular galaxies, such as the SMC and NGC 6822. Given the evidence for time variable star formation histories in such systems (Tolstoy et al. 2009), their much greater depletion rates compared to normal disk galaxies might well be the result of recent short-duration starbursts. However, combined spatially resolved studies of H i, infrared dust, and CO emission in the SMC and a number of the other z ∼ 0 SFGs plotted in Figure 4—which yield the CO conversion factor and the molecular gas mass without relying on the KS-relation—strongly suggest that it is the absence of CO emission, and not the presence of starburst events that dominate the apparently high depletion rates (Leroy et al. 2011; Bolatto et al. 2011).
With the exception of cB58, the starburst explanation is even more unlikely for the high-z SFGs in our sample. Almost all are massive systems on or near the star formation main sequence (Figure 1). Galaxies near the main-sequence exhibit exponential light profiles with fairly large (R1/2 ∼ 3–6 kpc) disk radii (Wuyts et al. 2011). They exhibit high star formation duty cycles (30%–100%; Adelberger et al. 2005; Noeske et al. 2007; Daddi et al. 2007). High-z main-sequence SFGs are forming stars at high rates (20–300 M☉ yr−1) primarily because of their high gas fractions (Daddi et al. 2010a; Tacconi et al. 2010) and not because they are undergoing short-duration ''starburst'' events. The high gas fractions are plausibly driven by the semi-continuous large gas accretion rates predicted by all cold dark matter models (e.g., Kereš et al. 2005; Dekel & Birnboim 2006; Ocvirk et al. 2008; Genel et al. 2008; Bouché et al. 2010). At fixed redshift the star formation surface densities are almost constant as a function of stellar mass (and thus metallicity) along the main sequence (∼0.6 and ∼3 M☉ yr—1 kpc−2 for z ∼ 1 and 2; Wuyts et al. 2011).
With the possible exception of the lensed ''Eyelash'' galaxy (Swinbank et al. 2010) all galaxies in our sample are within the ±0.3 dex dispersion of the M*–sSFR main-sequence relations at z ∼ 1.2 and 2.2, including the individual uncertainties in stellar masses and SFRs (Figure 1). Merger-induced starbursts (e.g., z ∼ 0 ULIRGs) with internally enhanced depletion rates typically lie an order of magnitude or more above the main-sequence line (Daddi et al. 2010b; Genzel et al. 2010; Combes et al. 2011; Saintonge et al. 2011).
Recent Herschel PACS observations have revealed a remarkable uniformity of the infrared spectral energy distributions of massive main-sequence SFGs at all redshifts (Hwang et al. 2010; Elbaz et al. 2011; Nordon et al. 2012). Main-sequence galaxies with SFRs from a few to a few hundred solar masses per year (with the exception of z ∼ 0 ULIRGs) have similar dust temperatures, Tdust ∼ 27–38 K, between z ∼ 0 and 2 (Hwang et al. 2010). High-z SFGs are merely 2–5 K colder than z ∼ 0 SFGs of the same luminosity.
Observations of multiple CO rotational lines in a number of z ⩾ 1 SFGs and submillimeter galaxies show that the CO ladder distributions are similar to those of local starburst galaxies, such as M82 and NGC 253, with inferred local molecular hydrogen volume densities (for the CO 3–2 emission) of nH2 = 102.5 to 104.5 cm−3 (Weiss et al. 2007; Dannerbauer et al. 2009; Danielson et al. 2011; Riechers et al. 2011; F. Combes et al., in preparation). Average molecular hydrogen densities in the giant star-forming clumps in z ⩾ 1 SFGs may be ∼102 to 103 cm−3 (Genzel et al. 2011). However, the fortuitous cancellation of the density and temperature dependencies may break down very close to massive star formation sites and may drive the conversion factor downward, as in the case of the central starburst region in M82 (αCO 1–0 ∼ 2; Wild et al. 1992; Weiss et al. 2001). This means that the average ratio (〈n(H2)〉)1/2/TR1 in Equation (2) probably is comparable in z ⩾ 1 SFGs to that in moderate z ∼ 0 starbursts, or the Milky Way GMC population (TR 1 ∼ 7–30 K, 〈nH2〉 ∼ 101.5 to 102 cm−3).
Could the large turbulence in high-z SFGs affect the observed metallicity trend in αCO 1–0? As a rule z ⩾ 1 SFGs near the ''main sequence'' exhibit 4–10 times larger velocity dispersions than z ∼ 0 SFGs (Förster Schreiber et al. 2009; Law et al. 2009; Epinat et al. 2009). Recent theoretical work suggests that increased turbulence may profoundly affect the local density and temperature structure, and in turn also the conversion factor (Narayanan et al. 2011b; Shetty et al. 2011a, 2011b). However, the observed velocity dispersions in z ⩾ 1 main-sequence SFGs appear to depend little on galaxy mass, SFR, or surface density (Genzel et al. 2011, and references therein). In addition, for most of the z ⩾ 1 SFGs in Figures 1 and 4, rotation dominates over random motions, in contrast to many z ∼ 0 ULIRGs and z ⩾ 1 submillimeter galaxies (Tacconi et al. 2008; Engel et al. 2010). Star formation in z ⩾ 1 main-sequence SFGs is plausibly driven by gravitational instabilities in giant star-forming clouds, similar to GMCs but scaled-up to the large gas fractions at z ⩾ 1 (Genzel et al. 2011). In any case, the effect of turbulent compression and the presence of nonvirialized gas components with chaotic motions drive the conversion factor downward, not upward, both in the empirical data (Solomon et al. 1997; Scoville et al. 1997; Downes & Solomon 1998; Tacconi et al. 1999, 2008), as well as in the simulations of Narayanan et al. (2011b) and Shetty et al. (2011b).
Another issue is whether the CO rotational ladder excitation might vary between galaxies in a systematic way such that a constant brightness temperature scaling factor R1J from J to 1, as used in this study, is not appropriate. The first studies of the CO rotational ladder distributions indeed show variations in CO rotational excitations, but for J ⩽ 3 these are by far too small to account for the magnitude of the variations in Figure 4 (Weiss et al. 2007; Dannerbauer et al. 2009; Danielson et al. 2011; Riechers et al. 2011; Ivison et al. 2011; F. Combes et al., in preparation).
3.4. The Variation in SFR/LCO 1–0 may be Affected but Cannot be Explained by the Fundamental Metallicity Relation
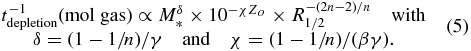
Mannucci et al. (2010) have shown that the gas phase oxygen abundance in z ∼ 0 SFGs depends on not only stellar mass (i.e., the mass–metallicity relation discussed in section 2.2) but also SFR. At fixed stellar mass a galaxy with a higher SFR has a lower oxygen abundance,

where b = 4.2, β = 0.47, and γ = 0.32 for metallicities on the Maiolino et al. (2008) scale (Mannucci et al. 2010). As we discuss in this section, this ''fundamental metallicity relation'' (FMR) in combination with a nonlinear (n > 1) KS-relation qualitatively yields a depletion rate—metallicity relation similar to that shown in Figure 4.
For z ∼ 0 galaxies in the Sloan Digital Sky Survey the FMR has an rms scatter of ±0.05 to ±0.06 dex, which is smaller than the ±0.08 dex scatter in the mass–metallicity relation (Mannucci et al. 2010), suggesting it may be the more fundamental relation. Mannucci et al. (2010) interpret the FMR as being driven by the interplay of star formation increasing metallicity and accretion delivering fresh, low-metallicity gas. Mannucci et al. (2010) also show that the 10 z ∼ 1–2.5 SFGs with reliable metallicity estimates available to their study fall on the same relation, indicating that Equation (4) may also apply at z ∼ 1–2.5. If the (molecular) KS-relation is nonlinear (n > 1 in Equation (3)), the combination of Equations (3) and (4) yields
For n = 1.1 and the FMR parameters found by Mannucci et al. (2010: β = 0.47, γ = 0.32) δ = 0.28 and χ = 0.6. For a fixed stellar mass Equation (5) then predicts that the depletion rate increases by a factor of two between solar metallicity and 0.5 times solar metallicity. This is in qualitative agreement with the observations shown in Figure 4. The FMR predicts that at fixed stellar mass a lower metallicity galaxy has a higher SFR. If the KS-relation is nonlinear, a higher SFR automatically implies a greater depletion rate. But, can Equation (5) also quantitatively account for the observations shown in Figure 4?
The average amplitude of the FMR is already captured in our analysis by using a redshift-dependent mass–metallicity relation, as described in Section 2.2. Additional changes in metallicity estimates from the scatter of the stellar-mass–SFR relation per se (±0.3 dex in SFR at fixed stellar mass) are smaller (<0.1 dex) than other uncertainties. To estimate the best FMR parameters at z ∼ 2 we used a recent, yet unpublished compilation of z ∼ 1.4–2.5 SFGs observed in [N ii] and Hα with integral field and long-slit spectroscopy as part of the SINS, OSIRIS, and LUCIFER surveys (Förster Schreiber et al. 2009; Law et al. 2009; P. Buschkamp et al., in preparation). The best-fit z ∼ 2 FMR on the Denicoló et al. (2002) scale has β = 0.31 (±0.06 1σ) for data stacked in stellar mass bins (all for γ fixed at 0.32). The rms scatter of the z ∼ 2 data is ±0.11 dex.
We list in Table 1 the molecular depletion rates and SFRs computed from Equation (5) for the four most extreme SFGs in Figure 4, and compare these values to the corresponding values computed from Equations (3) and (4), for n = 1.1 and 1.3, and for β = 0.31, 0.25, and 0.37 (reflecting the 1σ uncertainty in the z ∼ 2 FMR relation). The value of β = 0.37 on the Denicoló et al. (2002) scale is equivalent to β = 0.47 on the Maiolino et al. (2008) scale deduced by Mannucci et al. (2010) to be the best fit for the z ∼ 0 SFGs. With this range of values Table 1 shows that the effect of the FMR cannot simultaneously quantitatively account for the observed SFRs and depletion rates (for constant αG = 4.36) in ZC406690, cB58, and BX389, for any combination of the parameters n and β. Either the predicted depletion rate is too small, the SFR is too large, or both. Obviously no effect is predicted for a KS-slope of n = 1, favored by the work of Bigiel, Leroy, Schruba, and collaborators. The largest impact of the FMR naturally is for steeper KS-slopes (n = 1.3), as favored by Kennicutt et al. (2007) and Daddi et al. (2010b). In the case of BX482 a match is possible for small β ∼ 0.2–0.3 and n > 1.1.
Table 1. Star Formation Rates and Depletion Timescales: Comparison of Observed Values Compared to Predictions of FMR and KS-relations (for Given Metallicity and Stellar Mass)
| ZC406690 | cB58 | BX482 | BX389 | |
|---|---|---|---|---|
| z | 2.2 | 2.73 | 2.26 | 2.17 |
| 12+log(O/H)D02 | 8.43 | 8.43 | 8.52 | 8.61 |
| M* (1010 M☉) | 4.3 | 0.5 | 1.8 | 6.9 |
| R1/2 (kpc) | 6.3 | 1.5 | 4.2 | 4.2 |
| SFR (M☉ yr−1) | 290 | 63 | 120 | 197 |
| (from Hα + Calzetti) | ||||
| (tdepletion)−1 (α = 4.36) (Gyr−1) | 4.9 (±1.8) | 15.7 (±5) | >2.7 (3σ) | >5.7 (3σ) |
| From FMR/KS: β = 0.31, n = 1.1 | ||||
| SFR | 1.6e4 | 19 | 100 | 1.1e3 |
| (tdepletion)−1 (Gyr)−1 | 1.7 | 1.2 | 1.2 | 1.5 |
| From FMR/KS: β = 0.37, n = 1.1 | ||||
| SFR | 6.9e3 | 64 | 65 | 910 |
| (tdepletion)−1 (Gyr)−1 | 2.6 | 1.4 | 1.2 | 1.5 |
| From FMR/KS: β = 0.25, n = 1.1 | ||||
| SFR | 5.4e4 | 8.3 | 200 | 1.3e3 |
| (tdepletion)−1 (Gyr)−1 | 1.9 | 1.2 | 1.3 | 1.5 |
| From FMR/KS: β = 0.31, n = 1.3 | ||||
| SFR | 1.6e4 | 19 | 100 | 1.1e3 |
| (tdepletion)−1 (Gyr)−1 | 4.1 | 1.7 | 1.5 | 2.6 |
Download table as: ASCIITypeset image
The unrealistically large SFRs found for many of the cases in Table 1 immediately show that the strict application of an ''inverse'' FMR (as in Equation (5)) is not a good tool for individual galaxies. This is because the dependence on star formation in Equation (4) is very shallow (β × γ ∼ 0.1) and the scatter of the FMR is large. This means that the inverse solution for SFR depends very strongly on the location of a source in the ZO–M*-plane and the assumption of a scatter-free relation.
We conclude that including the effect of the FMR may indeed somewhat decrease the amplitude of the effect seen in Figure 4. However, the FMR cannot account for the observed increase of the depletion rate with decreasing metallicity.
3.5. The Variation in SFR/LCO 1–0 may be Caused by Photodissociation of CO in Low-metallicity Environments
Theoretical work on UV-illuminated molecular clouds reaching back 25 years has consistently predicted a strong dependence of (tdepletion(CO))−1 on metallicity, especially in somewhat diffuse molecular gas (van Dishoeck & Black 1986, 1988; Maloney & Black 1988; Sternberg & Dalgarno 1995; Hollenbach & Tielens 1999; Wolfire et al. 1990, 2010; Bolatto et al. 1999; Papadopoulos & Pelupessy 2010; Shetty et al. 2011a; Glover & Mac Low 2011; Glover & Clark 2011). The short-dashed blue curve in Figure 4 (from Krumholz et al. 2011) is the result of calculating (tdepletion(CO, ZO))−1 for a spherical molecular cloud with constant column density (Σgas ∼ 80 M☉ pc−2 ∼ 〈Σgas(GMC, MW)〉), and exposed to a diffuse UV radiation field with a characteristic ratio of UV energy density GUV to gas density nH similar to that in the solar neighborhood (Gsn = 2.7 × 10⁻³ erg cm−2 s−1, nsn = 23 cm−3; Wolfire et al. 2010; Krumholz et al. 2011). For this curve the volume filling factor fV (the inverse of the clumping factor c as defined by Krumholz et al. 2011) of molecular gas is assumed to be 0.2. This curve represents the ratio of the total H2 column through the cloud to the H2 column in which CO remains molecular, given the adopted UV radiation field and its density, clumpiness, and total column (Wolfire et al. 2010). The depth of the CO-photodissociation zone is controlled by dust (AUV ∼ 1) and thus scales directly with metallicity (e.g., van Dishoeck & Black 1986, 1988; Maloney & Black 1988; Sternberg & Dalgarno 1995; Wolfire et al. 2010; Glover & Mac Low 2011; Feldmann et al. 2011). The work of Krumholz et al. (2011) and Glover & Clark (2011) implies that star formation does not require the formation/presence of CO but can also occur in ''CO-dark'' gas. Krumholz et al. (2011) find that this star-forming ''CO-dark'' gas is molecular (in terms of hydrogen), while Glover & Clark (2011) conclude that star formation can even occur in atomic hydrogen gas as long as dust shielding is efficient (AV > 3).
Simple estimates based on SFRs and galaxy sizes suggest that z ⩾ 1 SFGs in Figure 1 have UV radiation field densities ∼102 to 103 times that in the solar neighborhood. Average ISM densities may also be greater, such that the ratio is probably similar to that in the solar neighborhood, or in nearby starburst galaxies. The onset of the up-turn in the blue-dashed curve in Figure 4 depends strongly on fV. Model curves with larger fV values than chosen by Krumholz et al. (2011) have up-turns at higher metallicity. For a homogeneous cloud (fV = 1) the up-turn occurs at solar metallicity.
The agreement of the theoretical predictions with the observations suggests that the trends seen in Figure 4, at both low and high redshifts, may mainly be the consequence of the ratio of the volume and mass of molecular gas traced by CO (relative to that in H2) decreasing rapidly at low metallicity due to photodissociation by the ambient UV field (see Pelupessy & Papadopoulos 2009; Krumholz et al. 2011; Glover & Mac Low 2011; Shetty et al. 2011b).
3.6. An Empirical Scaling Relation for αCO(ZO)
We now turn the results in Figure 4 around and derive an empirical dependence of αCO 1–0 on metallicity, based on the assumption of a universal KS-scaling relation. Using the KS-relation in reverse, the molecular gas mass can be obtained from the SFR (e.g., Erb et al. 2006b),

R1/2 is the half-light radius of the gas/star-forming disk. For the z > 1 data with ZO > 8.7 in Figure 3 and the best-fit slope of n = 1.1 we find ξ = 1.02 × 10⁹. For a slope fixed to n = 1.3 (Daddi et al. 2010b), the data in Figure 3 yield ξ = 1.2 × 10⁹. In comparison to Equation (6) the simpler assumption of a constant depletion rate of 1 Gyr−1 (n = 1) at z > 1 yields typically 5% larger gas masses for all but the most compact galaxies. The relation given in Equation (8) of Genzel et al. (2010), which depends on the ratio of R1/2 to the circular velocity (i.e., the global dynamical time), instead of R1/2 alone, on average yields half the gas masses. The relation in Kennicutt et al. (2007; n = 1.37) yields 20% smaller gas masses. These differences are all within the scatter of the empirical KS-relation.
We apply Equation (6) to each galaxy and divide the inferred gas mass by L'CO. The result is a direct measure of the conversion factor, and Figure 5 shows the derived CO 1–0 conversion factor as a function of metallicity for our z ⩾ 1 sample. Figure 5 has two insets. The left inset applies for our favored KS-slope of n = 1.1 (Figure 3). The right inset is for n = 1.3 favored by Daddi et al. (2010b) and Kennicutt et al. (2007). For comparison, we show estimates of αCO 1–0 of z ∼ 0 SFGs by Leroy et al. (2011). The Leroy et al. (2011) estimates of αCO 1–0 come from simultaneous parametric fitting of spatially resolved H i, CO, and dust emission. They do not rely on the KS-relation. The three sets of dashed lines denote previous CO conversion factor scaling relations for z ∼ 0 SFGs (Wilson 1995; Arimoto et al. 1996; Israel 1997, 2000; Boselli et al. 2002). This earlier work was partially based on similar galaxies as in the Leroy et al. (2011) sample but employed different methods.
Figure 5. Inferred dependence of the CO 1–0 luminosity to molecular gas mass, conversion factor (αCO 1–0) on gas-phase oxygen abundance. The molecular gas mass (including helium) for the high-z galaxies is computed from the best-fit z ⩾ 1 KS-relation. The left inset is for our favored KS-slope of n = 1.1 in Figure 3 and Equation (2). The right inset is for n = 1.3. The symbols for the high-z data points are the same as in Figure 4. Gray circles denote the determinations of αCO 1–0 from joint fits to spatially resolved H i, CO, and dust data in z ∼ 0 SFGs by Leroy et al. (2011). The large black (red) cross in the lower left denotes the typical systematic rms (statistical) errors. The trends of the Leroy et al. sample are in broad agreement with earlier work of Wilson (1995, magenta long-short dashes), Arimoto et al. (1996, long blue dashes), and Israel (2000, gray dots). The best linear fit in the log(αCO 1–0)–log(metallicity) plane to the all z ∼ 0 and z > 1 SFGs is given by the continuous black line: log αCO 1–0 = 12 (±2) −1.3 (±0.26) ZO (for both choices of n), where the quoted errors are 2σ statistical fit uncertainties. The best fit to only z ⩾ 1 SFGs is given by the continuous red line: log αCO 1–0 = 17 (± 6) − 1.8 (±0.6) ZO for n = 1.099 and log αCO 1–0 = 14 (± 6) − 1.6 (±0.6) ZO for n = 1.3.
Download figure:
Standard image High-resolution image
In agreement with the theoretical expectations, the CO → H2 conversion factor increases with decreasing metallicity for all these samples, with similar trends at both low- and high-z, albeit with a large scatter. If the z ∼ 0 points of Leroy et al. (2011) and the z ⩾ 1 SFGs are combined (treating 3σ upper limits as detections), the best linear fit yields the relation

where the quoted uncertainties are 2σ fit uncertainties for equal weights to all data points (because of the dominance of the systematic errors discussed above). The result in Equation (7) is the same for n = 1.1 and n = 1.3. For n = 1.1 a fit to only the z ⩾ 1 data yields a slope of −1.8 (±0.6) and zero point of 17 (±6), which is somewhat steeper than, but not significantly different from the combined fit. This slope may get somewhat flatter, however, depending on the FMR effects and the slope of the KS-relation, as discussed in Section 3.4. Our method constrains the relative conversion-factor–metallicity relation to no better than ±50%, since the rms scatter of the data points around any of the two relations given above is ±0.23 dex. Future observations are needed to clarify whether the outliers in Figure 4 are due to observational uncertainties, or whether they might point to intrinsic variations in the conversion factor, perhaps as a result of variations in the clumping factor. Absolute uncertainties are larger because of the inherent uncertainties in the metallicity calibrations (and their applicability at high-z), stellar masses, and SFRs, and the excitation of the CO rotational ladder. These uncertainties reflect a combination of the systematic uncertainties and plausible physical variations.
4. CONCLUSIONS
We have analyzed the empirical evidence for a metallicity dependence of the CO luminosity to molecular gas mass conversion factor αCO 1–0, based for the first time on both low- and high-redshift SFGs. We find that the CO-based molecular gas mass depletion rate in massive z ⩾ 1 SFGs increases with decreasing gas phase metallicity estimated from strong rest-frame optical emission line ratios or the mass–metallicity relation. We interpret this trend as being mainly driven by the dependence on metallicity of the ratio of galaxy averaged, gas column traced by CO emission to the total H2 column, consistent with the expectations from photodissociation theory. Very similar trends are seen in z ∼ 0 SFGs. If correct, our findings imply that stars are able to form efficiently in ''CO-dark'' gas, as proposed in the recent theoretical work of Krumholz et al. (2011) and Glover & Clark (2011).
We then employed the KS-relation for high-metallicity, near-main-sequence SFGs at z ⩾ 1 to derive empirical CO conversion factors. Combining our sample of 44 z ⩾ 1 SFGs with KS-independent conversion factors derived for 11 z ∼ 0 SFGs from the compilation by Leroy et al. (2011) we find that the log(αCO 1–0) − (12 + log{O/H}) relation has a slope between −1 and −2. At 0.5 (respectively 0.25) times solar metallicity αCO 1–0 is ∼2.5–4 times (respectively 6–14 times) larger than at solar metallicity. The uncertainties of the inferred αCO 1–0 values are ±0.23 dex statistically and larger systematically, and are driven by the large measurement and calibration uncertainties, our small galaxy samples and potentially additional ''hidden'' parameters and dependencies. Because of the obvious importance of the functional dependence of the CO conversion factor on metallicity and ISM parameters for future large molecular gas surveys it is highly desirable to improve the statistical robustness and uncertainties of the present result by enlarging the samples and their parameter ranges, in order to be able to marginalize over these other parameters.
The implications of our findings may be particularly relevant for redshifts near and above the peak of cosmic star formation activity (z ∼ 1–2.5). Because of the cosmic evolution of the mass–metallicity relation a galaxy at the knee of the stellar mass function (MS ∼ 1011 M☉) has ∼0.74, 0.69, and 0.55 solar metallicity at z ∼ 1, 2.2, and 3.5 (Maiolino et al. 2008). A 0.1 MS galaxy has typically half of the metallicity of an MS galaxy. These numbers immediately show that CO-based gas mass measurements may need to be significantly revised upward at z > 1 even for 0.7 MS galaxies, and ⩽0.1 MS galaxies at z > 2 may become hard to detect even with the superior sensitivity of ALMA.
We thank the anonymous referee for valuable comments that have improved the paper. A.S. thanks the DFG for support via German-Israeli Cooperation grant STE1869/1-1.GE625/15-1.
Footnotes
- *
Based on observations with the Plateau de Bure millimetre interferometer, operated by the Institute for Radio Astronomy in the Millimetre Range (IRAM), which is funded by a partnership of INSU/CNRS (France), MPG (Germany), and IGN (Spain).
- 20
For a transition J → J − 1 at frequency νJ, excitation temperature Tex, and optical depth τJ the Rayleigh–Jeans brightness temperature is given by TR J = hνJ/k (exp(hνJ/(kTex) − 1)−1(1 − exp(−τJ)).