


ABSTRACT
Photochemical models of Titan's atmosphere predict that three-body association reactions are the main production route for several major hydrocarbons. The kinetic rate constants of these reactions strongly depend on density and are therefore only important in Titan's lower atmosphere. However, radiative association reactions do not depend on pressure. The possible existence of large rates at low density suggests that association reactions could significantly affect the chemistry of Titan's upper atmosphere and better constraints for them are required. The kinetic parameters of these reactions are extremely difficult to constrain by experimental measurements as the low pressure of Titan's upper atmosphere cannot be reproduced in the laboratory. However, in the recent years, theoretical calculations of kinetics parameters have become more and more reliable. We therefore calculated several radical–radical and radical–molecule association reaction rates using transition state theory. The calculations indicate that association reactions are fast even at low pressure for adducts having as few as four C atoms. These drastic changes have however only moderate consequences for Titan's composition. Locally, mole fractions can vary by as much as one order of magnitude but the column-integrated production and condensation rates of hydrocarbons change only by a factor of a few. We discuss the impact of these results for the organic chemistry. It would be very interesting to check the impact of these new rate constants on other environments, such as giant and extrasolar planets as well as the interstellar medium.
Export citation and abstract BibTeX RIS
1. INTRODUCTION
In the 1980s, Voyager revealed that complex organic molecules were present in Titan's atmosphere but the actual mechanisms leading to this rich chemistry were largely unknown (Yung et al. 1984). The recent Cassini results indicate that the upper atmosphere is far more complex chemically than anticipated (Cravens et al. 2006; Coates et al. 2007; Vuitton et al. 2007; Crary et al. 2009). Solar photons are the dominant energy source in the thermosphere where they dissociate and ionize nitrogen and methane (Ågren et al. 2009; Galand et al. 2010). Photochemical models show that although the formation of several species, such as benzene and ammonia, requires a complex interplay between ion and neutral chemistry, neutral chemistry alone still accounts for the production of many important species (Vuitton et al. 2008; Yelle et al. 2010).
Reaction rates and branching ratios characterize the efficiency and products of chemical reactions and are necessary inputs in photochemical models. These parameters are measured in laboratory experiments. Unfortunately, the low temperature and pressure of Titan's upper atmosphere are difficultly (if at all) achievable in the laboratory and kinetic parameters have to be extrapolated outside the range of measurements, leading to high uncertainties. Three-body associations (A + B + M → AB + M) are amongst the reactions that are the least constrained by experimental measurements as they strongly depend on pressure. Moreover, radiative associations (A + B → AB + hν) are largely uncharacterized and have consequently been neglected in photochemical models so far.
Association reactions are the main production route for several hydrocarbons, especially alkanes (Wilson & Atreya 2004; Lavvas et al. 2008; Krasnopolsky 2009). Due to their dependence on density, three-body associations are limited to the lower atmosphere, while radiative associations are not. Therefore, radiative associations may potentially impact the molecular growth, which we recently found occurs at significant rates in the upper atmosphere (Lavvas et al. 2009; Wahlund et al. 2009). Association reactions can therefore have an important new contribution to our understanding of the complex chemistry in Titan's upper atmosphere and better constraints for them are required.
2. THEORETICAL METHODS
Ab initio transition state theory (TST) based master equation calculations were performed for several radical–radical and radical–molecule reactions. For the radical–radical reactions the high-pressure limits were predicted with variable reaction coordinate TST (Klippenstein 1992; Georgievskii & Klippenstein 2003) employing direct CASPT2 electronic structure evaluations (Harding et al. 2005). For the radical–molecule reactions, conventional TST based on QCISD(T) or CCSD(T) calculated barrier heights was used to predict the high-pressure limits. In each case, the calculations employed corrections based on extrapolations to the complete basis set limit, generally based on explicit calculations for the cc-pVTZ and cc-pVQZ basis sets. For some of the radical–molecule reactions, minor adjustments were made to the barrier heights in order to improve agreement with experimental data.
The master equation analysis yielded predictions for the pressure dependence of the kinetics and was performed as described in Miller & Klippenstein (2006). The energy transfer probabilities were modeled with the exponential down model with a temperature-dependent average downward energy transfer given by AT0.85. Lennard–Jones collision rates were employed and the A parameter was taken by analogy with studies for related reactions (e.g., for CH3 + C2H5 it was taken to be 100 cm−1). As necessary and appropriate, the torsional modes were treated as hindered rotors.
We employed a double harmonic approximation for the radiative emission rates, as described in our treatment of radiative association in ion–molecule associations (Klippenstein et al. 1996). This approximation has been found to yield accurate predictions for the radiative association kinetics for a number of ion–molecule reactions (Ryzhov et al. 1996; Gapeev et al. 2000).
Further details of these calculations will be provided in subsequent publications. For most reactions, these analyses were straightforward extensions of our prior estimates at higher temperatures (see, e.g., Miller & Klippenstein 2004; Harding et al. 2005; Klippenstein et al. 2006; Miller et al. 2008).
Although it is difficult to accurately estimate the uncertainties in these predictions, it is still worthwhile to make some estimate. Thus, we suggest that there is an uncertainty of ∼20%–30% in the high-pressure rate coefficients for the radical–radical recombinations (reactions (1) and (6)–(10)). The radiative emission rate coefficients typically have an uncertainty of about a factor of two to three as do the low-pressure limit rate coefficients. The greatest uncertainty is for the radical–molecule (reactions (2)–(5)) high-pressure addition rate coefficients, where tunneling is involved. These rate coefficients have an uncertainty that increases with decreasing temperature and at the lowest temperatures have an uncertainty of about an order of magnitude. The process of estimating rate coefficients according to the number of C atoms, as discussed below, probably adds an additional uncertainty of about a factor of five. These various estimates of the uncertainties are based on our knowledge of the uncertainties in the various factors underlying the theoretical analysis and from past experience directly comparing theoretical predictions with experimental observations.
3. PHOTOCHEMICAL MODEL
3.1. Description
The one-dimensional photochemical model of Titan used in this investigation is adapted from several elements described previously. The background atmosphere and eddy diffusion coefficient are based on Cassini observations (Yelle et al. 2008). We scale the neutral densities of N2 and CH4 measured by the Ion Neutral Mass Spectrometer (INMS) upward by a constant factor of 2.6 which is found necessary in order to have the INMS measured densities in agreement with the atmospheric density derived by the Huygens Atmospheric Structure Instrument (HASI) and the Cassini Attitude and Articulation Control Subsystem (AACS) observations (Müller-Wodarg et al. 2008). Detailed calculations for the energy deposition of photons and photoelectrons have been performed (Lavvas et al. 2011) and the aerosol opacity in the stratosphere has been constrained by the Huygens probe (Lavvas et al. 2010). The chemical network includes hydrocarbons (Vuitton et al. 2008), nitrogen (Yelle et al. 2010), and oxygen (Hörst et al. 2008) bearing species and takes into account both neutral and ion chemistry (Vuitton et al. 2007, 2009).
The hydrocarbon chemistry has been updated with new chemical parameters for association reactions. The net rate coefficients are calculated from the modified Troe formula, further adjusted to include radiative association:

where

and

with Pr = k0[M]/k∞, N = 0.75 − 1.27 log (FC), and C = − 0.4 − 0.67log (FC). The individual terms in the rate coefficient, k∞, k0, and kR, are assumed to vary with temperature according to

Thus, the recombination reaction rate coefficients are described by ten parameters, three describing the temperature dependence of each of the three contributions to the total rate along with FC.
The ab initio TST calculations described in the previous section were performed for 10 reactions selected for their importance in Titan's chemistry. These reactions as well as the 10 parameters computed for each reaction are listed in Table 1. In choosing these 10 reactions we focused on (1) reactions of importance to the hydrocarbon growth chemistry, (2) reactions for which we expected there to be significant effects arising from our improved treatment of the pressure dependence of their kinetics, and (3) reactions that could be used to develop an understanding of the molecular size dependence of the rate coefficients.
Table 1. Modified Arrhenius Fits between 50 and 300 K to Theoretically Predicted Rate Coefficients (k = ATn exp(− Ea/T))
| R# | Reaction | k∞a | k0b | kRa | FC | ||||||
|---|---|---|---|---|---|---|---|---|---|---|---|
| A | n | Ea | A | n | Ea | A | n | Ea | |||
| R1 | H + CH3 → CH4 | 1.5 × 10⁻¹⁰ | 0.133 | 2.54 | 2.56 × 10⁻²⁴ | −1.80 | 31.8 | 2.05 × 10⁻¹³ | −1.290 | 19.6 | 0.420 |
| R2 | H + C2H2 → C2H3 | 1.72 × 10⁻³⁴ | 8.41 | −359 | 2.18 × 10⁻²⁷ | −1.07 | 83.8 | 1.05 × 10⁻¹⁷ | −0.269 | 34.5 | 0.182 |
| R3 | H + C2H4 → C2H5 | 4.26 × 10⁻²⁶ | 5.31 | −174 | 5.08 × 10⁻²⁵ | −1.51 | 72.9 | 9.02 × 10⁻¹⁶ | −0.527 | 18.6 | 0.204 |
| R4 | H + C3H4 → C3H5 | 7.37 × 10⁻³⁵ | 8.54 | −304 | 1.71 × 10⁻¹⁹ | −2.48 | 191 | 1.19 × 10⁻²¹ | 2.63 | 63.0 | 0.141 |
| R5 | H + C4H2 → C4H3 | 2.85 × 10⁻²⁶ | 5.55 | −153 | 6.39 × 10⁻¹⁸ | −2.93 | 176 | 8.70 × 10⁻²⁰ | 2.75 | 50.3 | 0.186 |
| R6 | H + C4H3 → C4H4 | 1.33 × 10⁻¹⁰ | 0.00971 | −14.2 | 3.69 × 10⁻¹³ | −3.97 | 177 | 1.78 × 10⁻⁴ | −3.01 | 162 | 0.450 |
| R7 | H + C6H5 → C6H6 | 1.41 × 10⁻¹⁰ | 0.00971 | −14.2 | 9.86 × 10⁻¹² | −2.54 | 122 | 1.41 × 10⁻¹⁰ | 0.00971 | −14.2 | 0.510 |
| R8 | CH3 + CH3 → C2H6 | 5.26 × 10⁻¹⁰ | −0.359 | 30.2 | 6.66 × 10⁻¹⁷ | −3.77 | 61.6 | 2.97 × 10⁻⁶ | −3.23 | 74.5 | 0.332 |
| R9 | CH3 + C2H5 → C3H8 | 2.87 × 10⁻⁹ | −0.610 | 44.8 | 5.63 × 10⁻¹³ | −4.47 | 95.0 | 3.24 × 10⁻⁴ | −3.20 | 148 | 0.301 |
| R10 | CH3 + C6H5 → C7H8 | 3.62 × 10⁻⁹ | −0.615 | 29.5 | ∞ | 0 | 0 | 3.62 × 10⁻⁹ | −0.615 | 29.5 | 0.400 |
Notes. aRate coefficient in cm3 s−1. bRate coefficient in cm6 s−1.
Download table as: ASCIITypeset image
Specifically, reaction (1) involves the two main radicals in the upper atmosphere (Wilson & Atreya 2004) and could quench any further chemistry if efficiently forming back CH4. Reactions (2)–(4) represent a major loss mechanism for C2H2, C2H4, and C3H4, respectively (Yung et al. 1984; Lavvas et al. 2008). Reactions (5) and (6) are involved in a cycle that efficiently recombines H into H2 in the stratosphere and therefore controls their abundance (Yung et al. 1984; Krasnopolsky 2009). Reactions (7) and (10) have been identified as important production processes for C6H6 (Vuitton et al. 2008; Krasnopolsky 2009), while reactions (8) and (9) are the major production pathways to C2H6 and C3H8, respectively (Lavvas et al. 2008; Krasnopolsky 2009).
Radical–radical reactions are expected to be particularly strongly affected by the improved treatments. Thus, we have also obtained better estimates for the remaining 56 radical–radical reactions in the model via an empirical estimation scheme. In particular, for these reactions, we estimate k∞ from the following rules: for H + radical, k∞ = 2 × 10⁻¹⁰ cm3 s−1; for cross reactions (different radicals), k∞ = 8 × 10⁻¹¹ cm3 s−1; for self-reactions (same radical), k∞ = 5 × 10⁻¹¹ cm3 s−1. These estimates are based on our prior theoretical studies of H + alkyl radical reactions (Harding et al. 2005) and alkyl + alkyl reactions (Klippenstein et al. 2006), and from our knowledge of the low-temperature behavior of rate coefficients (Georgievskii & Klippenstein 2005). For k0 and kR we assume that the rate depends primarily on the number of C atoms involved. Specific values and the fitting formula used for the extrapolations are shown in Figure 1.

Figure 1. Variation of kR (blue) and k0 (red) at 150 K with the number of C atoms involved in the reaction. The points represent specific calculations for the radical–radical association reactions presented in Table 1. The curves represent the fits to the data. The fit formulae are kR = 6 × 10⁻¹⁶N7.5 and k0 = 8 × 10⁻³⁰e4.7N. kR is defined as the actual rate constant in the zero-pressure limit. With this definition it is bounded above by k∞. As one increases the number of C atoms, kR starts to approach this bound and so the rise must level off. In contrast, k0 is defined as the rate constant in the limit of zero pressure. This rate constant is not bounded by k∞ and so can increase without limit as the number of C atoms increases.
Download figure:
Standard image High-resolution imageIn order to test the impact of the new rate constants on the formation of hydrocarbons on Titan, we perform three runs with different reaction sets. Run A corresponds to our old reaction set, where k∞ and k0 were taken from laboratory experiments when available or estimated by analogy with similar reactions (Vuitton et al. 2008; Yelle et al. 2010). For species with more than three C atoms, k0 was multiplied by 10 according to the scaling arguments advanced by Laufer et al. (1983). kR was assumed to be negligible and was set to zero. Run A is then representative of the approach followed in the previous Titan models (Yung et al. 1984; Wilson & Atreya 2004; Lavvas et al. 2008; Krasnopolsky 2009). In run B, k∞ and k0 come from the theoretical calculations or the estimates described above (cf. Figure 1) but kR is still kept equal to zero. Finally, run C includes the new k∞, k0, and kR. The other reactions and all the physical parameters are identical in all three runs.
3.2. Results
The data points in Figure 1 indicate that k0 increases by 10 orders of magnitude when the number of C atoms changes from 1 to 6. This is drastically faster than the factor of 10 increase assumed in previous models. Also, our calculations show that kR becomes comparable to k∞ when the number of C atoms involved is higher than 4. This indicates that kR is fast and cannot be neglected.
The existence of large k0 and kR is potentially important for Titan, because much of the chemistry occurs in the upper atmosphere where ambient densities are low. Figure 2 shows the rate coefficients calculated for the Titan atmospheric conditions (temperature and density) for the 10 reactions listed in Table 1. Instead of decreasing monotonically with ambient number density in the low density limit, as is the case for three-body recombination (the so-called falloff region), the newly calculated recombination coefficients reach an asymptote equal to the radiative recombination rate. For the specific reactions presented here, the onset of the "falloff" region for the three-body association shifts from 400 to 700 km, while the radiative association maintains a fast reaction rate even in the thermosphere.
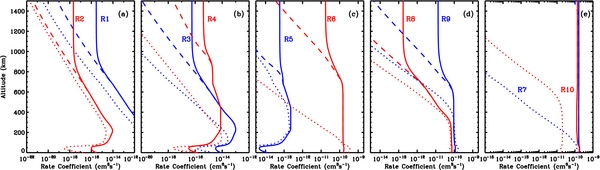
Figure 2. Rate coefficients in Titan's atmosphere for the association reactions given in Table 1. The dotted and dashed curves show the coefficients including only three-body recombination, with the old (run A) and new (run B) values of k0 and k∞, respectively. The solid curves show the coefficient including radiative association (run C).
Download figure:
Standard image High-resolution imageFigure 3 shows calculated mole fractions for the species in Titan's atmosphere most strongly affected by the association reactions. The model results show that inclusion of the new reaction rates has two primary consequences. The first, and simplest, is an increase in the density of alkanes in the upper atmosphere. This is obviously a result of the increased rate coefficients for production of these species through reactions (8) and (9). The second consequence is a significant change in the mole fraction of C4H2 in the stratosphere as well as smaller changes for C6H6 in the mesosphere and C2H2 and C2H4 in the stratosphere.

Figure 3. Modeled vertical profiles and comparison with observations. The dotted, dashed, and solid curves correspond to runs A, B, and C, respectively. (a) H2: the thermospheric measurements were obtained by INMS-CSN (Cui et al. 2008) and stratospheric measurements by GCMS (Niemann et al. 2010). C2H6: the thermospheric measurements were obtained by INMS (Cui et al. 2009b) and stratospheric measurements by CIRS at 30°N (Vinatier et al. 2010). C3H8: the stratospheric measurements were obtained by CIRS at 30°N (Vinatier et al. 2010). (b) C2H2: the thermospheric measurements were obtained by INMS-CSN (Cui et al. 2009b) assuming a C2H2 to C2H4 ratio of 1/3 and stratospheric measurements by CIRS at 30°N (Vinatier et al. 2010). C2H4: the thermospheric measurements obtained by INMS-CSN (Cui et al. 2009b) assuming a C2H2 to C2H4 ratio of 1/3 and by INMS-OSI (Vuitton et al. 2007) are represented by a circle and a triangle, respectively. The stratospheric measurements were obtained by CIRS at 30°N (Vinatier et al. 2010). C3H4: the thermospheric measurements were obtained by INMS (Cui et al. 2009b) and stratospheric measurements by CIRS at 30°N (Vinatier et al. 2010). C4H2: the thermospheric measurements obtained by INMS-CSN (Cui et al. 2009b) and by INMS-OSI (Vuitton et al. 2007) are represented by a circle and a triangle, respectively. The stratospheric measurements were obtained by CIRS at 30°N (Vinatier et al. 2010). C6H6: the thermospheric measurements were obtained by INMS-CSN (Vuitton et al. 2008) and the stratospheric measurements were obtained by CIRS at 15°S (Coustenis et al. 2007).
Download figure:
Standard image High-resolution imageReactions rates shown in Figure 4 can be used to follow the chemical cycles in which C4H2 is involved. In the thermosphere, C4H2 is produced primarily by ion chemistry through C4H+5 + e− → C4H2 + H2 + H. C4H2 reacts with HCNH+ to produce C4H+3 but this does not lead to a net loss of C4H2 as it is formed back through electron recombination of C4H+3. The main fate of C4H2 in the upper atmosphere is then to flow down to lower altitude or to a smaller extent, to react with CN to produce heavier nitriles. Below 1000 km, C4H2 is mostly produced by reaction of C2H with C2H2 and C2H4 and its main loss is photolysis. C4H2 can also react with H to form C4H3 (reaction (5)), which itself adds to another H to produce C4H4 (reaction (6)). However, this again does not lead to a net loss of C4H2 as C4H4 cycles back to C4H2 through photolysis.

Figure 4. Modeled reaction rates (run C) for some key reactions for C4H2. (a) Production. Light green: C4H+5 + e− → C4H2 + H2 + H; pink: C4H+3 + e− → C4H2 + H; red: C2H + C2H2 → C4H2 + H; blue: C2H + C2H4 → C4H4 + H; dark green: C4H4 + hν → C4H2 + H2; orange: local production due to diffusion (−∇ · F). (b) Loss. Dark green: HCNH+ + C4H2 → C4H+3 + HCN; blue: CN + C4H2 → HC5N + H; pink: C4H2 + hν → C4H + H, C2H2 + C2; red: H + C4H2 → C4H3 (R5); gray: H + C4H3 → C4H4 (R6); orange: local loss due to diffusion (∇ · F).
Download figure:
Standard image High-resolution image
The change in vertical profile for C4H2 between runs A and B/C can be explained by the steeper pressure dependence of the rate constant for reaction (6) in run A. This reaction being fairly inefficient above 400 km, the cycle described above to form back C4H2 does not proceed and the mole fraction of C4H2 decreases with altitude. Below 400 km, the pressure becomes high enough and the reaction can form back C4H2, explaining the kick in the C4H2 profile. This same phenomenon is responsible for the kick in the C6H6 profile at 700 km, the pressure-dependent reaction involved here being reaction (7) with C6H5 formed by photolysis of C6H6.
Hydrogen in atomic and molecular form results from the photochemical conversion of CH4 into more complex, less saturated hydrocarbons with a net yield of hydrogen. In Figure 3, the H2 profile is compared to the INMS (Cui et al. 2008) and the Gas Chromatograph Mass Spectrometer (GCMS) (Niemann et al. 2010) results in the upper and lower atmosphere, respectively. The model and measured H2 mole fraction match closely in the troposphere but differ by a factor of ∼3 in the thermosphere. From detailed model calculations based on known photochemistry with eddy, molecular, and thermal diffusion, Strobel (2010) shows that the tropospheric and thermospheric H2 mole fractions are incompatible by a factor of ∼2. Our calculations agree with the later study in the sense that we cannot match both sets of observations.
In Figure 3, the hydrocarbon profiles are compared to the available INMS and Cassini InfraRed Spectrometer (CIRS; Coustenis et al. 2007; Vinatier et al. 2010) results in the upper and lower atmosphere, respectively. Two different INMS data sets are being used, the Closed Source Neutral (CSN) and the Open Source Ion (OSI). INMS-CSN corresponds to the direct sampling of the neutral atmospheric species. The retrieved mixing ratios correspond to a global average but can present some substantial latitudinal as well as diurnal variations (Cui et al. 2009b). INMS-OSI corresponds to the direct sampling of the ionic atmospheric species (Vuitton et al. 2006) and the neutral mole fractions are fitted using an ion chemistry model in order to reproduce the ion densities for a specific flyby. The mole fractions retrieved by CIRS can present some significant latitudinal variations as well. Since our model represents a global average, we compare our results to CIRS equatorial values.
Considering that our model does not address possible variations of the mole fractions with latitude or local time and considering all the uncertainties in the chemical network, the profiles of most hydrocarbons are generally in good agreement with the observations. It is however difficult to say whether or not the new rate constants (run C) provide a better fit to the observations. The only exception is C4H2, which presents a significant improvement in the stratosphere. The C2H4 profile has the right order of magnitude in the lower stratosphere but cannot match the negative vertical gradient observed. Crespin et al. (2008) argue that this unusual behavior can be explained by dynamical advection from the winter pole toward the equator and by the fact that C2H4 does not condense. This profile cannot then be modeled with one-dimensional models. An alternate explanation is that cosmic rays, which deposit their energy near 65 km (Gronoff et al. 2009), are a significant source of C2H4. Vuitton et al. (2008) performed a thorough study of the formation and distribution of C6H6 and showed that it is efficiently formed by ion chemistry in the upper atmosphere. The observed mole fraction of C4H+2, an intermediate in the formation of C6H6, cannot be reproduced with our current knowledge of ion chemistry, which could explain the underestimation of the observed C6H6. Moreover, ion chemistry presents some strong diurnal variations (Cui et al. 2009a) implying that horizontal variations of the C6H6 mole fraction could be large. Again, this cannot be reproduced with our one-dimensional model.
4. DISCUSSION AND CONCLUSION
The calculated column-integrated mass fluxes for some selected species (runs A and C) are summarized in Table 2. Because the mass of material synthesized in the stratosphere is much higher than in the thermosphere and because vertical profiles in the stratosphere are not impacted much by the new rate coefficients, the mass fluxes do not change by more than a factor of a few between runs A and C. Cassini RADAR observations now permit an initial assessment of the amount of material present in the form of lake liquids and sand dunes (Lorenz et al. 2008). Lakes are believed to contain C2H6 (Brown et al. 2008) and probably CH4, as well as other minor organics (Cordier et al. 2009), while the dunes are consistent with an organic component, such as the photochemical "tholin" material produced in laboratory experiments (Lorenz et al. 2008). These relevant observational constraints are given in Table 2.
Table 2. Column Integrated Flux (g cm−2 s−1) of Material Produced in the Model (Runs A and C) and Associated Quantity of Material Inferred from the Observations Assuming a Constant Production Rate over the Age of the Solar System
| Species | Calculated Flux | Flux from Observations | |
|---|---|---|---|
| Run A | Run C | ||
| C2H6 | 8.3 × 10⁻¹⁴ | 7.3 × 10⁻¹⁴ | 1.4–14 × 10−16a |
| C2H2 | 3.7 × 10⁻¹⁵ | 1.7 × 10⁻¹⁵ | |
| C6H6 | 1.7 × 10⁻¹⁸ | 2.8 × 10⁻¹⁸ | C2H2/C6H6 < ∼10b |
| Aerosols (> 500 km) | <2.9 × 10⁻¹⁴ | <2.5 × 10⁻¹⁴ | 2.7–4.6 × 10⁻¹⁴c |
| Aerosols (total) | <1.1 × 10⁻¹³ | <6.3 × 10⁻¹⁴ | 0.5–2.0 × 10⁻¹⁴d /1.4–5.4 × 10−15e |
Notes. aEthane/methane lakes (Lorenz et al. 2008). bClark et al. (2010). cDetached haze layer (Lavvas et al. 2009). dMain haze layer (McKay et al. 2001). eSand dunes (Lorenz et al. 2008).
Download table as: ASCIITypeset image
The mass of liquid present in the lakes (16–160 Teratons) can only account for less than 2% of our C2H6 condensation rate integrated over the age of the solar system. Possible explanations are that (1) CH3 is converted to something else before forming C2H6. Yung et al. (1984) first noted the importance of CH3 photolysis but both cross sections and branching ratios are poorly known (Lavvas et al. 2008). Sensitivity studies should be performed in order to test the potential impact of these parameters on the production rate of C2H6. (2) CH4 is a recent addition to the atmosphere. This suggestion is consistent with a recent model of the evolution of Titan's interior and the associated outgassing of CH4 (Tobie et al. 2006) but is inconsistent with the quantity of dune material as discussed below. (3) C2H6 is lost to the crust or deeper interior in the form of clathrate (Lunine 2010). The Visible Infrared Mapping Spectrometer (VIMS) data seem to indicate that the surface C2H2/C6H6 abundance probably cannot be greater than ∼10 (Clark et al. 2010). Our calculated ratio is close to three orders of magnitude higher. It is possible that C2H2 is converted to C6H6 through the impact of cosmic rays (Zhou et al. 2010).
By analyzing the optical properties of the detached haze layer observed at 520 km, Lavvas et al. (2009) retrieved a mass flux of haze particle of 2.7–4.6 × 10⁻¹⁴ g cm−2 s−1, in reasonable agreement with the mass flux required to explain the main haze layer (McKay et al. 2001). The aerosol flux in our model is computed assuming that all the species (neutrals and ions) having more than six C atoms end up forming aerosols. This is obviously an upper limit as some of this material will undoubtedly get photodissociated to reform lighter species. Our results imply a total conversion rate to aerosols of ∼10% with 40% being formed above 500 km. The amount of material making up the dunes is estimated to be between 160 and 640 Teratons (i.e., a mass flux of 1.4–5.4 × 10⁻¹⁵ g cm−2 s−1), in general good agreement with the mass flux inferred from the haze layers. If the dunes are indeed made of organics falling down on the surface, this rules out the hypothesis that CH4 is a recent addition to the atmosphere.
Our ab initio TST calculations indicate that association reactions are fast even at low pressure for adducts having as few as three C atoms. k0 is up to 10 orders of magnitude faster than previously assumed and radiative association is extremely efficient and cannot be neglected. These drastic changes have however only moderate consequences for Titan's composition. Locally, mole fractions can vary by as much as one order of magnitude but the total production and condensation rates of hydrocarbons change only by a factor of a few. It would be very interesting to check the impact of these new rate constants on other environments, such as giant and extrasolar planets as well as the interstellar medium.
This work was performed in the framework of the Marie Curie International Research Staff Exchange Scheme PIRSES-GA-2009-247509. V.V. is grateful to the European Commission for the Marie Curie International Reintegration Grant No. 231013. R.V.Y. and P.L. have been supported through NASA Grant NNX09AB58G and NASA's Astrobiology Initiative through JPL Subcontract 1372177 to the University of Arizona. S.J.K. gratefully acknowledges support through NASA Planetary Atmospheres Program grant number NNH09AK24I and for computational support through the US Department of Energy, Office of Basic Energy Sciences, Division of Chemical Sciences, Geosciences and Biosciences under Contract No. DE-AC02-06CH11357.