


ABSTRACT
The white-light corona (WLC) during the total solar eclipse of 2009 July 22 was observed by several teams in the Moon's shadow stretching from India and China across the Pacific Ocean with its many isolated islands. We present a comparison of the WLC as observed by eclipse teams located in China (Shanghai region) and on the Enewetak Atoll in the Marshall Islands, with observations taken 112 minutes apart, combined with near-simultaneous space observations. The eclipse was observed at the beginning of solar cycle 24, during a deep solar minimum (officially estimated as 2008 December according to the smoothed sunspot number, but very extended). The solar corona shows several different types of features (coronal holes, polar rays, helmet streamers, faint loops, voids, etc.), though it was extremely sparse in streamers as shown from Large-Angle Spectroscopic Coronagraph data. No large-scale dynamical phenomena were seen when comparing the observations from the two sites, confirming that the corona was quiescent. We measure a Ludendorff flattening coefficient of 0.238, typical of solar minimum.
Export citation and abstract BibTeX RIS
1. INTRODUCTION
The Sun's inner white-light corona (WLC; up to 2.5 solar radii) is visible at high resolution mainly during a total eclipse; its remaining part can be observed by means of coronagraphic techniques. On average, its K-coronal component, formed by Thomson scattering of photospheric radiation by free electrons as mentioned in van de Hulst (1950), Billings (1966), Hundhausen (1993), and Golub & Pasachoff (2010, pp. 125–1294), dominates up to 5 solar radii above the limb, at which radius the F-component (due to scattering on dust) begins to dominate. The E-component (emission lines, mainly of highly ionized iron) dominates at low altitudes, up to 200,000 km (about 0.15 solar radii) above active regions, and is increasingly visible from spacecraft both on and just above the solar limb.
The shape and physical structure of the WLC are governed by the large-scale magnetic fields of the Sun, which still cannot be directly measured. It is well known that the shape of the WLC is also sensitive to the phase of a solar cycle (Golub & Pasachoff 2010, pp. 96–104, 118; Pasachoff 2009a, 2009b). The onset of the present cycle (24) was quite peculiar in the sense that although the activity in the photosphere was very low, the WLC exhibited a remarkably rich and variegated structure. Several lines of evidence indicate that the current onset of a new solar-activity cycle may be the last for decades (summarized by Pasachoff & MacRobert 2011a, 2011b, from work on helioseismology by F. Hill, high-solar-latitude coronal observations by R. Altrock, and magnetic-field solar-disk observations by M. Penn and W. Livingston), based on the absence of precursors as of 2011 June for solar cycle 25.
We hoped to collect high-quality observations of the WLC during the 2009 July 22 total solar eclipse from many different sites within the Moon's shadow, which would enable us to study temporal changes in the shape and large-scale structure of the corona, a goal also not completely accomplished at the 1991 eclipse (Zirker et al. 1992). Unfortunately, this plan again could not be realized due to unfavorable weather conditions at many observing sites. From the limited number of sites with adequately clear weather, we present here the results of the observations that were carried out at three distinct locations in China and the Pacific Ocean: one in the city of Hangzhou (China), about three hours southwest of Beijing, another at the Tianhuangping reservoir in the mountains northwest of Hangzhou, and the third far to the east on the small Pacific atoll of Enewetak, some 900 km northeast of Majuro, the capital of the Marshall Islands (the time difference between Hangzhou and Enewetak being about 1 hr and 52 minutes). Some of these results are also compared with the corresponding space-borne observations for this eclipse from NASA's Transition Region and Coronal Explorer, NASA's X-Ray Telescope (XRT) on board the Japanese Hinode spacecraft, NASA's Extreme-ultraviolet Imaging Telescope (EIT), and Naval Research Laboratory's (NRL's) Large-Angle Spectroscopic Coronagraph (LASCO) on board ESA's Solar and Heliospheric Observatory (SOHO), and NASA's Solar TErrestrial RElations Observatory (STEREO) pair of telescopes looking at the Sun from different angles from that of the other spacecraft or from Earth. We also compare with ground-based observations from Stanford's Wilcox Solar Observatory and the National Center for Atmospheric Research's Mauna Loa Solar Observatory.
The current paper continues a series that, for each eclipse, includes high-resolution ground-based compound images and images from a variety of solar spacecraft. The series started before the most recent solar-activity maximum based on high-resolution, high-contrast compound images of the 2005 total solar eclipse, which was observed from the mid-Pacific (Pasachoff et al. 2006). Our comparisons are similar in method to those we reported from pairs of observing sites at the 2006 eclipse in Africa, Greece, and Turkey (Pasachoff et al. 2007, 2008), the 2008 eclipse in Siberia and northern China (Pasachoff et al. 2009) and at the 2010 eclipse in Easter Island and French Polynesia (Pasachoff et al. 2011), but at a different phase of the solar-activity cycle, with a different configuration of the corona; the 2010 eclipse boasted of an erupting coronal mass ejection (CME), while also taking advantage of new solar spacecraft and new configurations. Difficulties in dealing with the strongly varying cloud cover from the Tianhuangping site led this paper to be deferred until after the paper about the 2010 eclipse.
The 2009 eclipse was particularly anticipated because it is the longest in currently available saroses, following the 7 minutes 4 s of totality available at the 1973 eclipse and the 6 minutes 42 s available at the 1991 eclipse. Further, though its peak totality of 6 minutes 39 s occurred only over the ocean, nearly 5 minutes 55 s of totality were to be available near one of the world's largest cities, Shanghai, with 5 minutes in Shanghai itself, before the lunar shadow went out to sea.
2. BASIC INFORMATION ABOUT THE 2009 JULY 22 ECLIPSE OBSERVATIONS
The path of totality stretched over thousands of kilometers from India and China across the Pacific Ocean. The weather conditions at the Chinese sites were not good; the sky was covered by heavy smog at Hangzhou presumably under changing clouds, and through rolling clouds from Tianhuangping, though all eclipse phenomena (Baily's beads, diamond ring, corona) were seen. There were rolling clouds during totality at the Enewetak Atoll, so only a part of totality could be observed, though with clearer breaks than on the mainland.
Eclipse paths and calculations of times and durations are available at Xavier Jubier's Web site at http://xjubier.free.fr/en/site_pages/Solar_Eclipses.html, linked for convenience through the IAU Working Group on Eclipses' Web site (J.M.P., Chair) at http://eclipses.info. The NASA eclipse Web pages remain available at http://eclipse.gsfc.nasa.gov/eclipse.html, but with F. Espenak's retirement, long-term availability and updating is not expected.
2.1. Enewetak (Marshall Islands) Observations
Our observation site at the atoll of Enewetak in the Marshall Islands was located at 162°20 827 E and 11°21546 N, where 5 minutes 40 s of totality were predicted from 03:27:57.3 to 03:33:36.9 at an altitude of 57° (http://xjubier.free.fr/en/site_pages/SolarEclipseCalc_Diagram.html and linked from http://www.eclipses.info). The observations were carried out with four telescopes whose focal length ranged from 500 mm to 1000 mm. Figure 1(a) illustrates the fine structure of the WLC processed from dozens of widely bracketed images taken during clear intervals by Druckmüller's method (Druckmüller et al. 2006; Druckmüller 2009) from the data taken from this observing site. The method is based on applying a high-pass filter with an adaptive kernel.
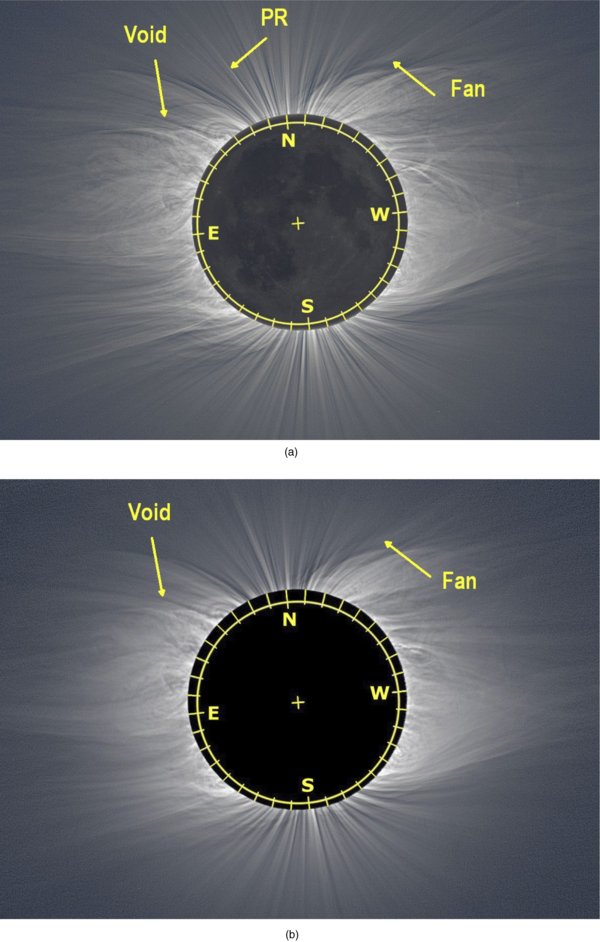
Figure 1. Images of the WLC (a) taken at Enewetak at 03:31:09 UT and (b) Hangzhou at 01:37:00 UT, and processed by Druckmüller's method. Position angles are shown on the solar limb (the white circle). The marks are explained in Section 3. Note also features on the lunar disk visible in the compound image from Enewetak. (Images: (a) Miloslav Druckmüller, Peter Aniol, Vojtech Rušin, Łubomír Klocok, Karel Martišek, and Martin Dietzel, and (b) Ronald E. Royer and Hana Druckmüllerová (right)).
Download figure:
Standard image High-resolution image2.2. China Observations
Although a great majority of eclipse teams were located in China, most of them observed the eclipse with insufficient quality for our purpose, with rain on the centerline at the coast south of Shanghai (sea level), fog in Moganshan (altitude 300 m), and moving clouds in Tianhuangping, Zhejiang (119 6175 longitude, 30527 latitude, altitude 900 m, with the Sun at an altitude of 54°; about as far east of the center point of the eclipse as our Enewetak site was to the west of that point). Unlike the situation at the Enewetak site, there were no clear intervals among the cloudiness.
The clearest set of observations was acquired by R. E. Royer in Hangzhou (120°03808 E, 30°18868 N, altitude ∼20 m, 01:37:00 UT) using a Newtonian f/6, 150 mm telescope with a Canon EOS 5D digital camera. Altogether, 83 pictures were taken with exposure times ranging from 1/4000 to 3 s, out of which only 34 images with exposure times 1/45 to 3 s were used for further processing (see Figure 1(b)). Both the Enewetak and Hangzhou images were processed using the Druckmüller method.
In spite of the moving cloud cover, careful computer work by Wendy Carlos using Photoshop, singling out appropriately exposed regions by hand, has brought out the overall magnetic field as revealed in the coronal streamers and polar plumes recorded in the images from Tianhuangping (Figure 2), where 5 minutes 38 s were predicted by F. Espenak (2009, private communication) and accessible at X. Jubier's Web site (accessible through www.eclipses.info), from 1:33:01.6 through 01:38:39.5 UTC.
Figure 2. Composite image of the WLC, from two dozen unfiltered CCD images taken through moving clouds at Tianhuangping and processed in New York with Photoshop by Wendy Carlos. We have a similar-looking compound image from four radial-filter images taken on film from the same site at Tianhuangping by Jonathan Kern of the Carnegie Observatories (http://users.obs.carnegiescience.edu/jkern/Eclipse2009) and also processed in New York by Wendy Carlos. See the set of radial-filter images from a series of past eclipses at http://mlso.hao.ucar.edu/mlso_eclipses.html and in Golub & Pasachoff (2010, pp. 96–104).
Download figure:
Standard image High-resolution imageA multi-camera HD video showing the eclipse phenomena simultaneously with a view of the observers and equipment is available at http://www.youtube.com/watch?v=bhb_d2kb6_E. A wide-field HD time-lapse animation showing the sky over the eclipse interval with the corona visible through dramatically moving clouds is available in the online journal (courtesy of Aram Friedman, Ansible Technologies, and the Williams College Expedition).5
3. PROMINENT FEATURES OF THE STRUCTURE OF THE WLC
The 2009 July 22 WLC indeed appears to be the minimum type (Figure 3), as expected from the then-current extended-minimum phase of the solar-activity cycle, with pronounced coronal holes filled with a number of polar rays/plumes. The most remarkable of the coronal holes is the one above the north pole (extending over position angles (P.A.) from 345° to 20°, clockwise) and the one above the south pole (P.A.145°–P.A.211°); the latter is much larger than the former.
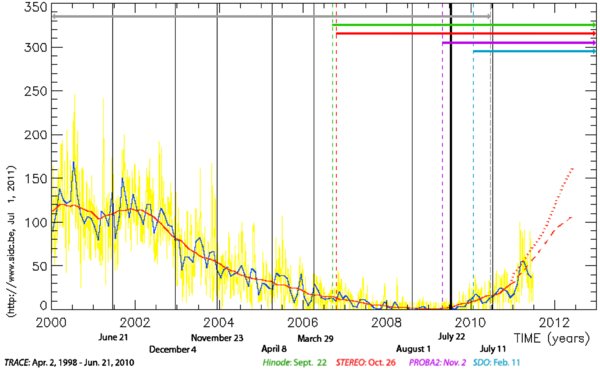
Figure 3. The 2009 July 22 total solar eclipse took place during an extended and extreme solar minimum, with three-fourths of the days of the year prior to the eclipse having a sunspot number of exactly 0. Daily numbers are in yellow, monthly numbers are in black, and a smoothed trend line is in red; two alternative projections into 2012 are shown as dotted and dashed (as described at http://sidc.oma.be/html/wolfjmms.html). The dates of total solar eclipses are shown as vertical lines, with the eclipse that is the subject of this paper as a bold vertical line. The solar spacecraft aloft to observe the Sun at the times of the eclipses are shown as color-coded horizontal lines with dashed date markers; as shown, the Solar Dynamics Observatory (SDO) had not yet been launched at the time of this eclipse. (Modified from a graph by Solar Influences Data Analysis Center, Royal Observatory of Belgium.)
Download figure:
Standard image High-resolution imageNo helmet streamers are seen above the eastern limb, although at higher altitudes there are discernible tens of narrow rays, pointing toward the equator. The ray system that most closely resembles a helmet streamer is that located at P.A.102°–P.A.142°; it stretches up to 5 solar radii. A similar system is seen above the equator at heliographic latitudes 40°–60°. However, neither features any coronal cavity, a feature that is typical for a helmet streamer. The only exception is, perhaps, an aggregate of bright and dark loops at P.A.20°–P.A.48°, whose dominating part is situated around P.A.32°, the site of a compact prominence. The feet of the loops located at P.A.48° and P.A.60° are most likely anchored well behind the limb of the Sun. Moreover, the whole aggregate is overlaid by a large number of narrow, curved rays/plumes, which do not seem to be directly connected with the loops in question. Another notable feature connected with this aggregate is a bright, low-lying compact object at P.A.36°–P.A.40° that is accompanied by a bright, slim, needle-like plume reaching the height of two solar radii. In addition, at P.A.70°, a half-loop is well visible; one can see that it has brightened parts at the places of apparent intersection with radially oriented rays. Another atypical object seen above the eastern limb is a dark void, whose traces can be seen from P.A.35° up to 1.5 solar radii (marked as "void" in Figure 1).
A "mature" system of helmet streamers can be seen above the western limb, at P.A.210°–P.A.290°; here, an associated tiny prominence (P.A.239°) with the "seed" of a coronal cavity is worth noticing. Another "helmet-like" structure is located at P.A.330°–P.A.350°, close to the boundary of the northern coronal hole, comprising a number of thin rays and a feeble one at P.A.260°–P.A.305° (see Figure 1). A trace of a huge loop at P.A.265° extending to a height of 1.84 solar radii is also discernible, although the positions of its feet are very difficult to determine. We also draw the reader's attention to a fan-like structure located up to a height of about 1.91 solar radii at P.A.325°, which seems to be an extension of a thin ray seen at P.A.348°. This feature could well be an example of a small-scale pseudo-streamer as discussed by Wang et al. (2007), seen from a side and whose feet can be anchored in the photosphere in the regions associated with bright EUV points. Finally, we mention a remarkable, extended narrow curved ray (see Figure 4, the ray marked by an arrow) whose base could be located at P.A.290°. This ray differs from all rays seen in its vicinity (most likely an effect of projection) and in the literature is known under the name "narrow ray" (see, e.g., Billings 1966; Rušin 1979).

Figure 4. Outer WLC as observed from Enewetak with a 500 mm lens on a Canon EOS 5D camera with its 24 × 36 mm chip. (Image by Miloslav Druckmüller, Peter Aniol, Vojtech Rušin, Łubomír Klocok, Karel Martišek, and Martin Dietzel.)
Download figure:
Standard image High-resolution imageNo significant changes in the form and large-scale structure of the WLC, such as those observed during the 1991 total eclipse (Zirker et al. 1992), were found. Although the observations from China are not of the same quality as those from Enewetak (which is, for example, illustrated on how differently pronounced in Figures 1(a) and 1(b) is a narrow plume at P.A.11° (marked as PR)), this difference cannot account for the above-mentioned fact.
The above-described prominent features of the WLC are, as already stressed, only the first approximation; much more can be seen and revealed on processed images taken with our telescopes that provided greater spatial resolution. Habbal et al. (2010a, 2010b, 2011) have also used similarly processed images of the E-corona (chiefly Fe emission lines), from the 2006 and 2008 eclipses, as part of their investigation of emission-line ratios and the transition from collisional to collisionless plasma.
We measure a Ludendorff flattening coefficient (Golub & Pasachoff 2010, pp. 96–98) of 0.238, matching the 0.24 of Pishkalo (2011) and showing the enlarged ellipticity, resulting from the relative absence of high-latitude streamers, that is typical of solar minimum (compared with <0.05 typical of solar maximum and close to the top of the recorded range, 0.29 for the eclipses of 1900, 1954, and 1963).
4. THE PHOTOSPHERE, CHROMOSPHERE, AND CORONA FROM SPACE
As this eclipse fell soon after the onset of cycle 24 at solar minimum, the level of activity on the Sun was relatively low. Figure 5 depicts a Wilcox Solar Observatory (Stanford) Photospheric Magnetic Field Chart to illustrate the relatively quiet solar conditions during the eclipse and around this date. No neutral magnetic line is found to be located above the equator, so there is no obvious neutral line to which helmet streamers could be connected. On the other hand, there are many magnetic regions located around the equator, and outlines of coronal holes are visible above both the poles. It can be discerned that the locations of neutral lines are accompanied by brightening of the WLC and that observed coronal holes also fit into areas of the same magnetic polarity. Figure 6 shows a comparison of the structure of the WLC with the modeled distribution of large-scale magnetic fields of the Sun, which enables us to infer some more information about the origin/behavior of the individual structures of the WLC discussed in the preceding section.

Figure 5. Wilcox Solar Observatory Photospheric Magnetic Field Chart (http://wso.stanford.edu/). Synoptic charts of the solar magnetic field are assembled from individual magnetograms observed over the course of a solar rotation. The contour maps show the distribution of magnetic flux over the photosphere. The field above 70° is not resolved. Blue, light shading shows the positive regions and red shows the negative regions. The neutral line is black. Contours are indicated. Inverted carets show times of contributing magnetograms.
Download figure:
Standard image High-resolution image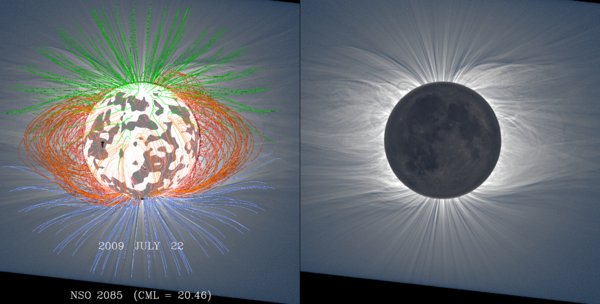
Figure 6. Comparison of the 2009 WLC and computed magnetic field lines for eclipse day according to Wang (left) and the processed image of the 2009 WLC obtained with a 1000 mm telephoto lens at Enewetak (right). For a fuller set of Druckmüller-processed images, see http://www.zam.fme.vutbr.cz/~druck/eclipse/.
Download figure:
Standard image High-resolution imageFigure 7 shows SOHO observations in different wavelengths (30.4 nm, magnetogram, 19.5 nm and 28.4 nm) and Hinode/XRT for the time close to that of the Enewetak observations. It can be seen that the solar surface does not exhibit substantial activity, with only one 30.4 nm bright area, easily noticeable in the figure. Also, the northern coronal hole in the EUV and XRT corona is very well pronounced with the southern coronal hole. Traces of both coronal holes are discernible in He ii as well. A comparison of SOHO/LASCO C2 and C3 images with our WLC image is illustrated in Figure 8.
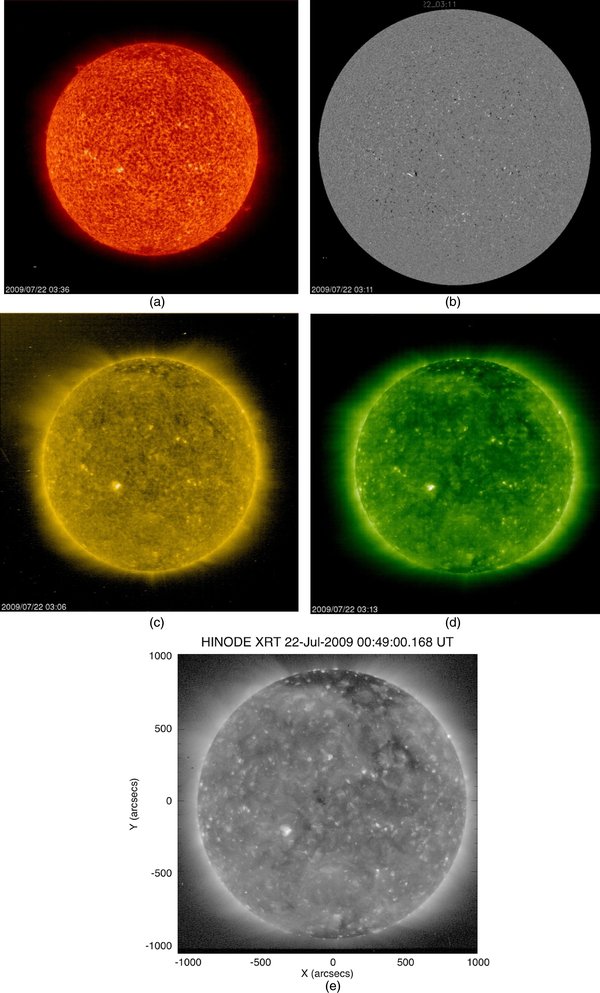
Figure 7. SOHO and Hinode coronal images corresponding roughly to the Enewetak eclipse time, with the EIT images taken of a half-hour period and the XRT image about 3 hr earlier. (a) SOHO EIT He ii 30.4 nm (60,000–80,000 K). (b) SOHO Michelson Doppler Imager (MDI) magnetogram. (c) SOHO EIT Fe xv 28.4 nm (2 × 10⁶ K). (d) SOHO EIT Fe xii 190.5 nm (1.5 × 10⁶ K). (e) Hinode XRT, X-rays, broad temperature range >106 K (Golub et al. 2007). (NASA/ESA/EIT team/GSFC and MDI team/Stanford, and NASA/JAXA/LMSAL, SAO.)
Download figure:
Standard image High-resolution image
Figure 8. (a) SOHO/LASCO C2 WLC with an inset of our Enewetak WLC and (b) LASCO C3 corona, with the white circle marking the size and location of the solar photosphere. A cosmic ray has not been removed, nor has the silhouette of the bar holding in the occulting disk. Note the paucity of outer-coronal streamers, resulting from solar-minimum conditions. (Courtesy of LASCO Consortium/NRL/NASA/ESA.)
Download figure:
Standard image High-resolution image5. COMPARISON OF THE WLC WITH THE GREEN CORONA (530.3 nm)
While the WLC is essentially the light of the photosphere scattered on free electrons and dust particles in the vicinity of the Sun, and is quite easy to observe, the radiation of the emission corona is associated with specific spectral lines (e.g., Billings 1966; Golub & Pasachoff 2010). It is the inherent radiation of the corona by highly ionized elements of iron, calcium, nickel, etc. A great majority of the corresponding lines lie in the extreme UV or X-ray part of the spectrum; in the visible region there are only about 28 coronal emission lines, the brightest of them being Fe xiv at 530.3 nm, whose half-width is about 0.1 nm, with Fe xiii at 1074.7/1079.8 in the near-infrared being stronger and being increasing accessible with the improvements in infrared detection (Pasachoff et al. 1978; Habbal et al. 2010a, 2010b). Accordingly, while making an image of the WLC of sufficient quality for showing coronal structure is not too demanding a task in the sense of equipment, that of the emission corona—for example, in the Fe xiv line, characteristic for the parts of the corona having a temperature of about 1.8 million K—requires the use of a narrow-passband filter, such as the Lyot filters that have long been used at solar observatories. Such filters have been less used at eclipses because their narrow passbands require prolonged exposure times; furthermore, emission-line imaging of the corona requires separating the line emission from the continuum. Most eclipse observations of the 530.3 nm emission corona (also known as the green-light corona) have previously been based on the use of a single filter centered at the line in question (e.g., Badalyan & Sýkora 1997). Moreover, it was often assumed that the contribution from the WLC, which had to be subtracted, is everywhere the same. This is a poor assumption because the radial gradient in the intensity of the WLC is not only very steep near the solar limb (Koutchmy et al. 1978; Koutchmy 1997), but also varies between equatorial, polar, and active regions, so the resulting images of the green-light corona were always considerably distorted by the radiation of the WLC. In order to overcome this difficulty, we employed two telephoto lenses with two narrow-passband interference filters, each with a half-width of 0.03 nm; one filter was centered at the Fe xiv line itself, the other at the continuum around 529.1 nm. The pictures of both "coronae" were taken simultaneously. In this way, we succeeded in obtaining high-resolution images of the virtually "pure" green-light corona; one such image is shown in Figure 9(a). (A similar procedure has been carried out by R. Lucas of University of Sydney as part of our Williams College Eclipse Expedition at recent eclipses, though using a somewhat wider passband for the continuum comparison.)
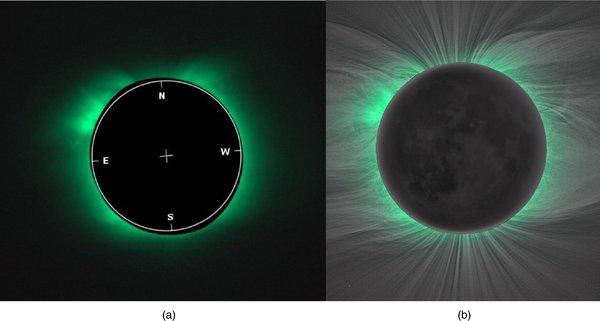
Figure 9. (a) The green (530.3 nm) corona and (b) the composite of our WLC image from Enewetak and the green corona from the same site. Note how the clarity of the image and compositing allows lunar surface features to show. (Green-line image from Miloslav Druckmüller, Vojtech Rušin, Łubomir Klocok, Karel Martišek, and Martin Dietzel.)
Download figure:
Standard image High-resolution imageA comparison of the green corona and the WLC is depicted in Figure 9(b). One sees that the regions where the green corona is most pronounced/conspicuous (P.A.20°–P.A.70°, P.A.135°–P.A.145° and P.A.330°–P.A.350°) correspond to the areas of the alleged anchoring of detected pseudo-streamers. The shape of the green corona is also found to be almost identical with that of the SOHO/Hinode 28.4 nm (Fe xv) corona. The extent of our green corona (Figure 9) is much larger in the radial direction than that from the SOHO and Hinode observations for two reasons. First, SOHO and Hinode at 28.4 nm show the corona in the Fe xv line, which has a higher ionization energy than Fe xiv by about 392.2 eV, in the Habbal group's multi-emission-line observations from French Polynesia during the 2010 total eclipse (Habbal et al. 2010a, 2010b, 2011). That is why this line is more prominent in active regions at low altitudes. Second, extreme-ultraviolet lines are only collisionally excited. However, the Fe xiv 530.3 nm line has a significant component excited by the intense photospheric light (Habbal et al. 2010a, 2010b, 2011).
6. STEREO OBSERVATIONS
At the 2009 eclipse times, NASA's pair of STEREO spacecraft were at separation angles with Earth of –49° for STEREO A and 55° for STEREO B. Figure 10 shows two views from STEREO A of an erupting prominence over a 10 m interval that included the nearly six-minute eclipse viewed from Enewetak. Figure 11 shows a subtraction of these two images.
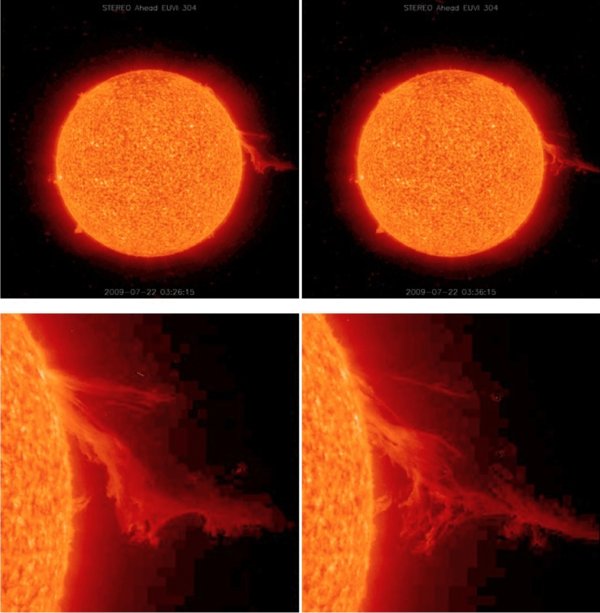
Figure 10. Erupting prominence, imaged at 03:26:15 and 03:36:15 (the eclipse at Enewetak was total from 03:27:57 to 03:33:37) from NASA's STEREO A/EUVI at 30.4 nm.
Download figure:
Standard image High-resolution image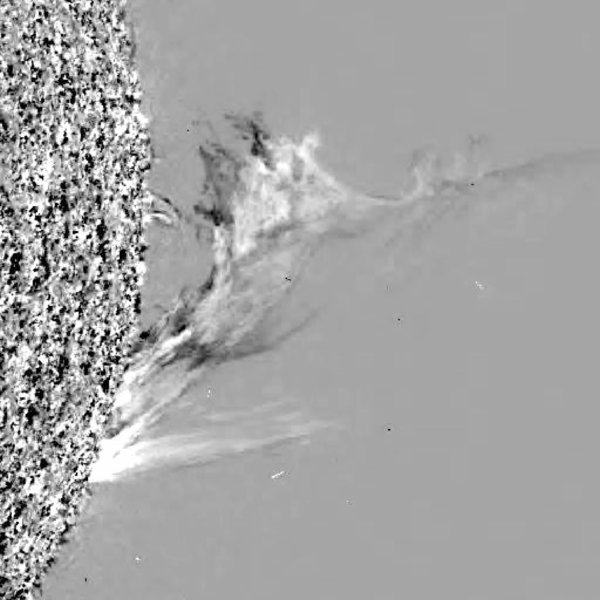
Figure 11. Subtraction of the two STEREO A He 30.4 nm images in the previous figure to show the prominence's motion over the 10 m interval.
Download figure:
Standard image High-resolution imageSTEREO's coronagraph views (Figure 12), from angles 104° apart, showed other aspects of the few coronal streamers on the Sun at this point in the extreme solar minimum and verified that the lack of coronal streamers was not merely an effect of Earth's angle of view at the time of the eclipse. The importance of viewing the Sun from a wide variety of angles is demonstrated by the observations of the eruption of a prominence during the eclipse time but without being detectable from Earth. Habbal et al. (2010a) discussed, based on their observations of various ionization levels for the total solar eclipses of 2006 and 2008, the effect of cool prominence gas in the hot corona, termed prominence shrouds, and their potential relation to CMEs.

Figure 12. Top: images from STEREO A's COR2 coronagraph at 03:37:30 (left) vs. STEREO B's COR2 coronagraph at 03:38:19 (right). Bottom: images from STEREO A's COR1 coronagraph at 03:35:18 (left) vs. STEREO B's COR1 coronagraph at 03:36:07 (right).
Download figure:
Standard image High-resolution imageMotions can be seen when blinking the STEREO A's COR1 coronagraph images over the 5 m interval that includes the eclipse time (Figure 13). STEREO A and B also carry EUV coronal imagers (Figure 14) to provide disk views of the corona from their respective angles.
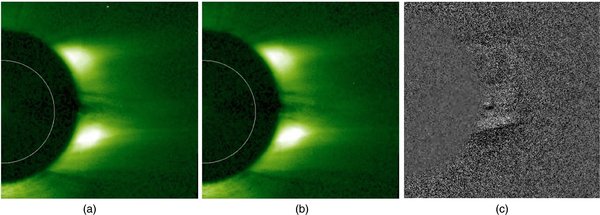
Figure 13. (a) STEREO A's COR1 image from 03:30:18. (b) STEREO A's COR1 image from 03:35:18, 5:00 minutes later. (c) A subtraction of the two images reveals the motion.
Download figure:
Standard image High-resolution image7. GROUND-BASED CORONAGRAPH IMAGE
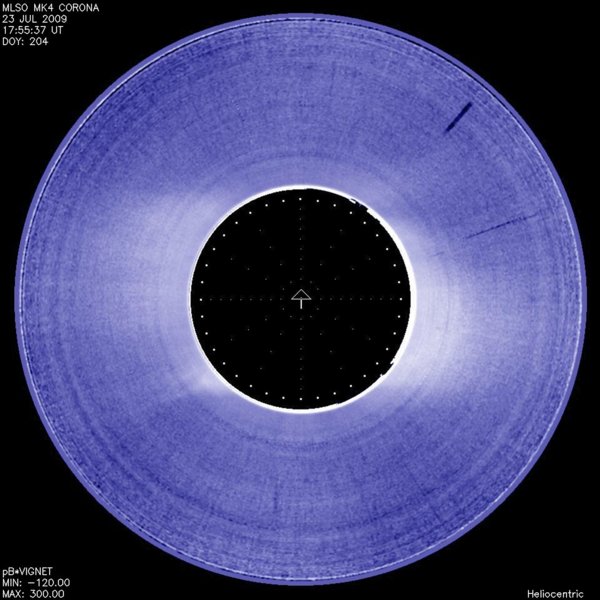
Though bad weather prevented observations on eclipse day with the Mauna Loa Mark IV coronagraph, an image from the following day (Figure 15) confirms the conclusion from our various sources, including the STEREO coronagraph's images, that coronal streamers were weak and sparse.

Figure 14. STEREO B's time lapse pair (03:26:19 and 03:36:19) of 195 Å (Fe xii) radiation over a 10 m interval including eclipse time does not show motion, but clearly illustrates the spacecraft's angle of view when compared with the images in Figure 7.
Download figure:
Standard image High-resolution image8. DISCUSSION AND CONCLUSIONS
Our series of highly processed white-light eclipse images from 2005, 2006, 2008, 2009, and 2010 reveals the diminution of the solar-activity cycle through 2009 and its modest resumption by the time of the 2010 total solar eclipse. The diminution of coronal temperature can also be seen through the comparison of the strength of the coronal green line (XIV) and the coronal red line (Fe x), as shown for 2006 and 2008 eclipses by Voulgaris et al. (2010), with analysis of observations from the 2009 and 2010 eclipses (A. Voulgaris et al. 2012). The use of our images for dynamical changes means that our results are not sensitive to the criticism of Woo (2010) that such processed images show large-scale variations related to differencing rather than actual absolute brightness. Morgan & Habbal (2010) discuss the variations of the outer, LASCO, corona over the solar cycle.
The distribution of streamers, or perhaps better "pseudo-streamers," at the 2009 eclipse again takes the solar-minimum configuration of short elongation, and probably with a few streamers available equatorially and only polar plumes visible at the poles.
The white-light eclipse images of Figures 1, 2, and 6 and the SOHO/LASCO images show photospheric light as scattered by coronal electrons held in place by unmeasurable coronal magnetic fields. The on-disk ultraviolet structures, on the other hand, show the highly ionized ions directly revealing the high temperatures typical of the corona. Our high-resolution composited eclipse observations show many fine-resolution rays similar to those discussed by Wang et al. (2007) from the 2006 eclipse.
Comparing the best high-resolution images taken with the time lag of about 114 minutes between Hangzhou and Enewetak did not show any remarkable changes in large-scale coronal structures, though some motion could be seen in the streamers from STEREO A's point of view. On the other hand, the present corona differed from the typical minimum-type corona, which has long helmet streamers located above the equator or its vicinity as observed in the eclipses of 1936 at solar minimum (http://sidc.oma.be/html/wolfaml.html) or 2005 at a low and descending phase of the cycle (Pasachoff et al. 2006), or in SOHO/LASCO images as well from near solar minimum. The SOHO corona on the disk as observed with EIT in the EUV showed many small-scale bright points, which could represent a base for small-scale helmet streamers as indicated in the WLC. It seems that the WLC corona from both ground-based observational sites, similarly to the SOHO/LASCO corona, was very weak in brightness (indicating less electron density) compared with the typical brightness at solar minimum.
If compared with WLC observations during other eclipses in the period from 2005 to 2010, the 2009 WLC shows a substantially different form and finer structure, which must reflect differences in the corresponding topology of large-scale magnetic fields of the Sun. A close inspection of Figure 6 indicates that for the time around the eclipse, the surface magnetic fields did not exhibit pronounced large areas of a given polarity, but rather many tiny regions with varying polarity. This structure would account for the absence of well-developed helmet streamers (in this respect, see also Wang et al. 2007). This "peculiarity" in the topology of magnetic fields was noticed by Z. Mikić (2011, private communication), who informed us that the forecast for the 2009 eclipse corona provided by his group (http://www.predsci.com/corona/) was less successful than those for the 2008 and 2010 eclipses (Rušin et al. 2010).
Figure 15. An average image from 45 minutes of observations on the Mauna Loa Solar Observatory's coronagraph from the day after the eclipse, when the Sun had rotated less than 15°, meaning that the large-scale coronal configuration on view was not very different from that on eclipse day. (Courtesy of Joan Burkepile, NCAR.)
Download figure:
Standard image High-resolution image
Finally, we briefly mention "voids," or "evacuated threads" (November & Koutchmy 1996), which are also seen in our images. These have been observed, both from the ground and from space, for quite a long time (see, e.g., Rušin & Rybanský 1985; MacQueen 1985), yet their nature is still mysterious. They can represent regions of reduced density and temperature, not only emptied-out areas of coronal mass due to restructuralization of magnetic fields' topology but also sites of great concentration of particles able to considerably absorb and thus shield radiation from bright loops located behind. According to November & Koutchmy (1996), such voids/evacuated threads may represent non-force-free magnetic fields and introduce special constraints on the coronal thermodynamics.
The work of V.R. and M.S. was partially supported by the VEGA grant agency project 2/0098/10 and the Science and Technology Assistance Agency APVT under contract APVT 51-012-704, and that of H.D. by grant 205/09/1469 of the Czech Science Foundation. V.R. also cordially thanks Shadia Habbal of the Institute for Astronomy, University of Hawaii, for the organization of the Marshall Islands/Enewetak eclipse site, the ASTELCO for providing partial financial support and scientific equipment, Canon Slovakia for cameras and a laptop, and the Mayor of the Marshall Islands for hospitality during his stay at the atoll of Enewetak (formerly Eniwetok), where U.S. nuclear bombs were tested from 1948 to 1958. Williams College student participants included Katherine DuPré, Sara Dwyer, Yung-Hsien Ng Tam (now of the Chinese University of Hong Kong), Rachel Wagner-Kaiser (now of the University of Michigan), and Huajie (Charles) Cao (now of Princeton University). We also thank Jonathan Kern (Carnegie Observatories), Roger Ressmeyer, and Robert Lucas (University of Sydney) for their collaboration on site at Tianhuangping. We thank Yuhua Yan (National Astronomical Observatory of China), Jin Zhu (Beijing Planetarium), and Lin Lan (Hangzhou High School) for their assistance in selecting the Tianhuanping site, and several of Lin Lan's students, especially Chenying Lai ("Michelle"), now of the University of Washington, for their assistance on site. We thank Y.-M. Wang (Naval Research Laboratory) for the hairy-ball diagram. The Williams College Eclipse Expedition and J.M.P. were supported at this eclipse mainly by grant 8436-08 from the Committee for Research and Exploration of the National Geographic Society. J.M.P.'s current eclipse research is supported in part by the Solar Terrestrial Research program of the Atmospheric and Geospace Sciences Division of the National Science Foundation through grant AGS-1047726; the 2009 expedition received additional support from the Brandi Fund and Science Center funds from Williams College. R.W.-K. was a Keck Northeast Astronomy Consortium Summer Fellow from Vassar College, supported at Williams College by the Research Experiences for Undergraduates (REU) Program of the NSF under grant AST 1005024. Partial support for this work was provided by the U.S. Department of Defense's Awards to Stimulate and Support Undergraduate Research Education (ASSURE) program in collaboration with the NSF's REU program. We are pleased to be able to use the observations from Hangzhou from Ronald Royer. We thank Jonathan Kern (Carnegie Observatories), Michael Kentrianakis, Paul Rosenthal, Aram Friedman (Ansible Technologies), Robert Lucas, Roger Ressmeyer, Jan Kern, and Naomi Pasachoff for their collaboration on site. We are grateful for Wendy Carlos's expert computer work with Jonathan Kern's radial-filter image and with the Williams College group's set of images, providing two composite images, one by each method of data-taking, in spite of the strong variations from passing clouds. We thank Steele W. Hill of NASA's Goddard Space Flight Center for his help in obtaining the appropriate SOHO and STEREO images. We thank summer students David Amrhein and Shubhanga Pandey for their assistance in the final preparation of figures for submission. The spectral results of the Williams College collaboration at Tianhuangping with the team of John Seiradakis and Aristotle Voulgaris from the Aristotle University of Thessaloniki, Greece, were the subject of a separate study. The meteorological conditions under the changing eclipse circumstances at Tianhuangping will be the result of a further study together with Marcos Peñaloza-Murillo (Universidad de los Andes, Merida, Venezuela, and Williams College, with support from the U.S. Fulbright Visiting Scholar program) and Michael Roman (Cornell), and we thank them for their participation. We thank Nikon Professional Services, Williams College's Equipment Loan Office/James Lillie, and the Photographic Department of the National Geographic Society for providing equipment.
Footnotes
- 4
- 5
It is also available at http://www.ansibletech.com/solareclipse2009.html and http://www.youtube.com/watch?v=XLdb1b72GVM. The progress of clouds across the field of view is readily visible in each. The expedition as a whole is shown in Storm Worlds: Cosmic Fire, a movie made for the National Geographic Channel; it is available for viewing online at http://www.youtube.com/watch?v=zQbRf0fnIHI (http://channel.nationalgeographic.com/series/storm-worlds/4065/Overview).