


ABSTRACT
We adopt a scenario in which the Galactic thick disk was formed by minor merging between the first generation of the Galactic thin disk (FGTD) and a dwarf galaxy about ∼9 Gyr ago and thereby investigate chemical and dynamical properties of the Galactic thick disk. In this scenario, the dynamical properties of the thick disk have long been influenced both by the mass growth of the second generation of the Galactic thin disk (i.e., the present thin disk) and by its non-axisymmetric structures. On the other hand, the early star formation history and chemical evolution of the thin disk was influenced by the remaining gas of the thick disk. Based on N-body simulations and chemical evolution models, we investigate the radial metallicity gradient, structural and kinematical properties, and detailed chemical abundance patterns of the thick disk. Our numerical simulations show that the ancient minor merger event can significantly flatten the original radial metallicity gradient of the FGTD, in particular, in the outer part, and also can be responsible for migration of inner metal-rich stars into the outer part (R > 10 kpc). The simulations show that the central region of the thick disk can develop a bar due to dynamical effects of a separate bar in the thin disk. Whether or not rotational velocities (Vϕ) can correlate with metallicities ([Fe/H]) for the simulated thick disks depends on the initial metallicity gradients of the FGTDs. The simulated orbital eccentricity distributions in the thick disk for models with higher mass ratios (∼0.2) and lower orbital eccentricities (∼0.5) of minor mergers are in good agreement with the corresponding observations. The simulated Vϕ–|z| relation of the thick disk in models with low orbital inclination angles of mergers are also in good agreement with the latest observational results. The vertical metallicity gradient of the simulated thick disk is rather flat or very weakly negative in the solar neighborhood. Our Galactic chemical evolution models show that if we choose two distinctive timescales for star formation in the thin and thick disks, then the models can explain both the observed metallicity distribution functions and correlations between [Mg/Fe] and [Fe/H] for the two disks in a self-consistent manner. We discuss how the early star formation history and chemical evolution of the Galactic thin disk can be influenced by the pre-existing thick disk.
Export citation and abstract BibTeX RIS
1. INTRODUCTION
The thick disk of the Galaxy is a fundamental Galactic component containing fossil records of the early chemical and dynamical evolution of the Galaxy (e.g., Freeman 1987; Majewski 1993; Freeman & Bland-Hawthorn 2002). Since Yoshii (1982) and Gilmore & Reid (1983) first revealed the presence of the thick disk with scale height ∼1350 pc, the characteristic structural, kinematical, and chemical properties have been discussed extensively in both observational and theoretical studies (e.g., Yamagata & Yoshii 1992; Robin et al. 1996; Gilmore et al. 2002; Reddy 2010). The older age (e.g., Gilmore et al. 1995; Bensby et al. 2003), higher [α/Fe] (e.g., Fuhrmann 1998), larger scale height (e.g., Ojha 2001; Larsen & Humphreys 2003; Jurić et al. 2008), and larger radial, azimuthal, and vertical velocity dispersions (e.g., Soubiran et al. 2003; Dinescu et al. 2011) of the thick disk in comparison with the thin disk have long been considered to provide constraints on the formation models of the thick disk. Theoretical models for the formation of the Galaxy based on a cold dark matter cosmology have started to explore the origin of the observed complicated nature of the thick disk (e.g., Abadi et al. 2003; Brook et al. 2004).
Previous numerical simulations showed that accretion of a small satellite galaxy on the pre-existing thin stellar disk of a disk galaxy can dynamically heat up the disk to form the thick disk (e.g., Quinn et al. 1993; Walker et al. 1996; Huang & Carlberg 1997; Velazquez & White 1999; Villalobos & Helmi 2008): this formation process is referred to as the "minor merger" scenario. Using cosmological simulations with self-consistent chemical evolution models, Brook et al. (2004) demonstrated that thick disks of galaxies can be formed by accretion/merging of gas-rich dwarfs at high redshifts (this is referred to as the "gas-rich merger" scenario). Radial migration of stars due to internal stellar dynamics of disk galaxies (Sellwood & Binney 2002) has been demonstrated to be important for the formation of the Galactic thick disk (e.g., Schönrich & Binney 2009; Loebman et al. 2010). Noguchi (1998) first showed that massive clumps developed in the early dynamical evolution of galactic disks can heat up the original disks to form thick disks.
The predicted properties of the Galactic thick disk from these formation scenarios have recently been compared with the present-day properties of the thick disk: the orbital eccentricity distribution (e.g., Sales et al. 2009; Dierickx et al. 2010; Dinescu et al. 2011), radial and vertical metallicity gradients (e.g., Allende Prieto et al. 2006; Ivezić et al. 2008), [α/Fe]–[Fe/H] relation different from that of the thin disk (e.g., Reddy & Lambert 2009; Reddy 2010), and rotational velocities of thick disk stars dependent on vertical distances (e.g., Allende Prieto et al. 2006) and on metallicities (Spagna et al. 2010). These comparisons between theoretical and observational results have pointed out strengths and weaknesses of the above-mentioned scenarios in explaining chemical and dynamical properties of the Galactic thick disk. For example, the observed orbital eccentricity distribution of the thick disk stars is consistent either with the gas-rich merger scenario or the minor merger scenario (e.g., Dierickx et al. 2010; Di Matteo et al. 2011; Dinescu et al. 2011; Wilson et al. 2011). These comparisons, however, are not yet extensive enough to decide which of the proposed scenarios is the most self-consistent and convincing.
Although previous numerical studies based on the minor merger scenario provided some key predictions on structural and kinematical properties of the Galactic thick disk (Quinn et al. 1993; Walker et al. 1996; Huang & Carlberg 1997; Villalobos & Helmi 2008), they did not discuss chemical properties or their correlation with the dynamical properties observed in the Galactic thick disk. Given that the thick disk is composed largely of rather old stars with ages larger than ∼9 Gyr (e.g., Allende Prieto et al. 2006; Bensby et al. 2007), the formation epoch of the thick disk should be well before the formation of the thin disk, and thus dynamical properties of the thick disk should have been strongly influenced by the growing thin disk for the last ∼9 Gyr. Therefore, previous simulations which did not consider the formation of the thin disk subsequent to the formation of the thick disk are not ideally suited to a comparison with the observed ones. Although the Galactic bar (or the "barred bulge") could have significantly influenced the dynamical evolution of the thick disk, such dynamical influences have not been investigated in previous simulations. Furthermore, chemical properties of the thick disk formed by ancient minor merger events are yet to be discussed in the literature.
The purpose of this paper is thus to investigate chemical and dynamical properties of the Galactic thick disk formed from ancient minor merger events based on new chemical and dynamical models for the formation of the thick disk. In the present minor merger scenario, the thick disk was formed from an accretion of a dwarf galaxy on the first generation of the Galactic thin disk (FGTD) about ∼9 Gyr ago and therefore has long been dynamically influenced by the growing thin disk since its formation. Although previous numerical simulations investigated the dynamical evolution of the Large Magellanic Cloud composed of thin and thick disks (Bekki 2009) and dynamical influences of a growing thin disk on a pre-existing thick disk in a disk galaxy (e.g., Kazantzidis et al. 2009; Villalobos et al. 2010), they did not discuss how non-axisymmetric structures such as bars and spirals in a live thin disk influence the dynamical evolution of a thick disk in a galaxy. The present study therefore adopts a new two-component disk model in which a live thin disk can dynamically influence a thick disk through the growth of non-axisymmetric structures over a long timescale. We then use the model to discuss structural and kinematical properties of the present Galactic thick disk surrounding the thin disk.
We also construct a new self-consistent chemical evolution model in which the early star formation history and chemical evolution of the thin disk is influenced by (1) the remaining gas of the thick disk, (2) later gas accretion onto the thin disk, and (3) dynamical properties of the thick disk. Since the present chemical evolution model is the first one that is based on the minor merger scenario, the predicted properties of the model enable us to discuss strengths and weaknesses of the minor merger scenario in explaining the observed properties of the thick disk (e.g., Chen et al. 2000; Gratton et al. 2000; Prochaska et al. 2000; Mashonkina & Gehren 2001; Tautvaisienė et al. 2001; Bensby et al. 2003, 2005; Reddy et al. 2003, 2006; Casagrande et al. 2011). Based on our chemical and dynamical models, we particularly discuss the radial metallicity gradient of the thick disk, dynamical interaction between the thin and thick disks after the formation of the thick disk, the metallicity distribution function (MDF), and the [α/Fe]–[Fe/H] relation of the thick disk. The present model is novel because these thick disk properties have not been discussed in previous theoretical studies based on the minor merger scenario.
The structure of the paper is as follows. In the next section, we describe our new two-component dynamical models of the Galactic disk and our chemical evolution models for the Galactic thin and thick disks. In Section 3, we present the results of the present chemical and dynamical models for the Galactic disks. In Section 4, we discuss a number of key observational results in the context of different formation scenarios for the thick disk and we summarize our conclusions in Section 5. Although our previous chemodynamical models of the formation of the Galaxy discussed physical correlations between [Fe/H] and kinematics of the Galactic disk and stellar halo (Bekki & Chiba 2000, 2001), the present study, which is not based on a fully self-consistent chemodynamical model, does not allow us to do so. Because of this limitation, we only briefly discuss the observed correlations between chemical and kinematical properties of the thick disk in the present paper, and will extensively discuss these in our future studies based on fully self-consistent chemodynamical simulations. Because we focus exclusively on the Galactic thick disk in the present paper, we will discuss the origin of thick disks observed in other disk galaxies (e.g., Yoachim & Dalcanton 2008) in the context of the minor merger scenario in forthcoming papers.
2. MODELS
We discuss chemical and dynamical properties of the Galactic thick disk by using both N-body simulations and one-zone chemical evolution models. We first describe the models for the ancient minor mergers, the growth of the thin disk, and the dynamical evolution of the stellar disk composed of thin and thick disks (Section 2.1). These models are used for deriving radial metallicity gradients of the thick disk formed by minor merging, and determining structural and kinematical properties of the present thick disk. We then describe one-zone chemical evolution models that are used for deriving the MDFs and correlations between different chemical abundances of the thin and thick disks (Section 2.2). Dynamical properties of the stellar remnants of minor mergers and orbital eccentricity distributions of thick disk stars formed from minor merging have been extensively discussed in a number of recent papers (e.g., Villalobos & Helmi 2008; Di Matteo et al. 2011; Qu et al. 2011) and we confirm that their main results can be held for the present minor merger models. We therefore focus on the new results that have not been discussed elsewhere.
2.1. Dynamical Models
2.1.1. FGTD
The FGTD is modeled as a bulgeless disk galaxy with total mass Md and size Rd embedded in a massive dark matter halo. The total mass and the virial radius of the dark matter halo of the FGTD are denoted as Mdm and rvir, respectively. We adopt a Navarro–Frenk–White (NFW) halo density distribution (Navarro et al. 1996) suggested from cold dark matter simulations:

where r, ρ0, and rs are the spherical radius, the characteristic density of a dark halo, and the scale length of the halo, respectively. We adopted c = 12 (=rvir/rs) and rvir = 12 Rd for the dark matter halo, and the mass ratio of halo to disk (fdm) is regarded as a free parameter that can control the mass ratio of the simulated thick disk to the thin disk. In the present scenario, minor merging occurred when the FGTD was still rapidly growing and thus a much less massive disk embedded in a massive dark matter halo. We therefore consider that fdm should be rather large and investigate models with fdm ranging from 79 to 157. We mainly describe the results of the models with fdm = 157 in which the final stellar disk has a thick disk component with a mass ∼10% of its thin disk component and a maximum circular velocity (Vc) ∼240 km s−1, which is reasonable for the Galaxy (e.g., Binney & Tremaine 2007).
The stellar component of the FGTD is assumed to have an exponential profile with radial and vertical scale lengths of 0.2 Rd and 0.02 Rd, respectively. In addition to the rotational velocity made by the gravitational field of the disk and halo components, the initial radial and azimuthal velocity dispersion are given to the disk component according to the epicyclic theory with Toomre's parameter (Binney & Tremaine 1987) Q = 1.5. The vertical velocity dispersion at a given radius is set to be 0.5 times as large as the radial velocity dispersion at that point. The initial disk plane of the FGTD is set to be the x–y plane in the present study (i.e., the z-axis is the polar direction of the disk). Figure 1 shows the radial profile of the circular velocity Vc for the FGTD in a model with Md = 4 × 10⁹M☉ and Rd = 17.5 kpc. It is clear from this figure that the original thin disk has Vc that is significantly smaller than the present one in the Galaxy.

Figure 1. Radial profile of the circular velocity (Vc; red dashed) for the FGTD with Md = 4 × 10⁹ M☉, Rd = 17.5 kpc, and fdm = 157: contributions from the dark matter halo and the stellar disk are shown by blue solid and green dotted lines, respectively. The maximum circular velocity of a dwarf disk that merges with the FGTD is shown by a dotted line for m2 = 0.05, 0.1, 0.2, and 0.3, where m2 is the mass ratio of the dwarf to the FGTD.
Download figure:
Standard image High-resolution imageRecent photometric and spectroscopic observations of the Galactic stellar and gaseous components have demonstrated that the present thin disk has metallicities that depend on location within the disk, i.e., metallicity gradients (e.g., Friel 1995). In the present minor merger scenario, stars within the present Galactic bulge had been already formed before the minor merger occurred and they initially consisted of the inner part of the FGTD. The inner part of the thick disk became the part of the Galactic bulge in response to the bar formation in the inner part of the two-component Galactic disk. We thus need to assume that the inner disk of the FGTD has a metallicity gradient that is different from that of the outer part and similar to that of the bulge. In the present study, we consider that the metallicity gradient is different between the inner (R < Rth) and outer (R ⩾ Rth) regions of the FGTD, where R < Rth is set to be 2 kpc, corresponding to the size of the bulge.
We allocate metallicity to each disk star in the outer disk (R ⩾ Rth) according to its initial position: at r = R, where r (R) is the projected distance (in units of kpc) from the center of the disk, the metallicity of the star is given as

We consider that (1) the slope αd is a free parameter and (2) [m/H]d, r = 0 is determined such that the metallicity at the solar radius (R = R☉ corresponding to 8.5 kpc) is −0.7 for the adopted αd. We adopt the observed value of αd ∼ −0.04 (e.g., Andrievsky et al. 2004). Guided by the observational results on the radial metallicity gradient of the Galactic bulge (e.g., McWilliam & Rich 1994; Wyse et al. 1997; Frogel et al. 2000), we assign the metallicity of a star at r = R in the inner disk (R < Rth), where r (R) is the projected distance (in units of kpc) of the star from the center of the disk, to be

We allow the slope of the metallicity gradient to be a free parameter and investigate different models with different αb. The central metallicity of the disk is determined such that the metallicity at R = R☉ is consistent with the value derived from Equation (2) for the outer disk. If we adopt the metallicity gradient from Frogel et al. (2000) in which the slope αb = −0.4, then [m/H]b, r = 0 = 0.36 for αd = −0.04 and [m/H]d, r = 0 = −0.36.
The dwarf disk is also assumed to have a metallicity gradient, though it does not have an inner disk component that becomes a bulge. Therefore, the radial metallicity gradient for the entire disk region is described by the following single relationship:

The slope of the metallicity gradient αdw is assumed to be a free parameter that can control the final metallicity gradients of merger remnants (i.e., thick disks). Since there is an observed relation between luminosity (L) and metallicity (Z) for galaxies (Z ∝ L0.4; Mould 1984), we allocate a smaller metallicity of [m/H]dw, r = 0 for the dwarf disk according to the mass of the stellar disk in the dwarf (Md, dw). The dwarfs disks in the present study are assumed to have total masses 5%–20% of the FGTD and thus cannot be similar to low-mass dwarfs with lower [α/Fe] observed in the local group: they are not literally dwarfs. The adopted massive dwarf disks can experience rapid star formation in their early histories (thus have higher [α/Fe]) and correspond to the Large Magellanic Cloud which shows higher [α/Fe] in its old stellar populations. Thus the simulated thick disks in the present study, which can have stars from disrupted dwarf disks, can show higher [α/Fe], which is consistent with recent observations by Ruchti et al. (2010) and Lee et al. (2011). In order to show more clearly how minor galaxy merging can influence radial metallicity gradients of merger remnants, we allocate metallicities to stars at each radius according to their positions R alone. We do not introduce initial vertical metallicity gradients in the FGTD in the present study, because we need to assume a few additional unknown parameters, which can make the interpretation of the simulation results much less straightforward. It would be possible for different stars at the same R in the FGTD to have different metallicities owing to chemical and dynamical evolution, but we do not consider this possibility. Ignoring such a dispersion in the initial metallicity at each radius allow us to avoid introducing additional free parameters for clarity. The final mean metallicity in the central region (R < 2 kpc) corresponding to the Galactic bulge region in each merger remnant can be as low as −0.3, owing to radial mixing of stellar populations in the present study. The central metallicity can be higher if we adopt higher metallicities in the inner regions of the FGTD. Since the purpose of this paper is not to discuss the origin of the bulge, we do not consider its chemical properties.
The total numbers of particles used for the dark matter halo (Ndm) and the stellar disk (Ndisk) of the FGTD in each simulation are 800,000 and 100,000, respectively. The total number of particles used for the dark matter halo and the stellar disk in a dwarf are m2Ndm and m2Ndisk, respectively, where m2 is the mass ratio of the dwarf to the FGTD. As demonstrated by Walker et al. (1996), the total particle number of more than 5 × 10⁵ is enough to properly investigate the formation processes of thick disks from thin ones through minor galaxy merging. Therefore, the present simulations with N ∼ 106 enable us to derive physical properties of galactic thick disks in a convincing way. In all of the present models, the adopted gravitational softening length is fixed at 0.014 Rd, which corresponds to 252 pc for Rd = 17.5 kpc.
2.1.2. Minor Mergers
We consider minor galaxy mergers with mass ratios (m2) of merger progenitor galaxies ranging from 0.05 to 0.3, so that we can investigate the physical properties of thick disks. The FGTD and the satellite galaxy that finally merges with the FGTD are assumed to have self-similar structures and kinematics in dark matter halos and stellar disks: they both have NFW halos with Rvir/Rd = 12 and exponential disks with scale lengths and vertical scale heights of 0.2 Rd and 0.02 Rd, respectively. We investigate only galaxy mergers between bulgeless stellar disks in the present study, though there can be some differences in dynamical properties of merger remnants between disk–disk merger models and disk–spheroidal ones (e.g., Villalobos & Helmi 2008). Since our main focus is not the detailed properties of minor merger remnants, we do not discuss the results of disk–spheroidal merger models in the present study. The disk size of the dwarf (Rd, dw) is assumed to depend on the mass of the disk (Md, dw) such as Rd, dw∝M0.5d, dw, which corresponds to Freeman's law. Therefore, m2 can determine the size of the stellar disk for the dwarf and thus the structural and kinematical properties of the dark matter halo and the stellar disk.
In the present simulation of a minor merger, the orbit of the two disks is set to be initially in the x–y plane, and the orbital plane of the satellite disk is assumed to be inclined by Θ degrees with respect to the orbital plane. The initial distance between the two spirals (ri) is set to be either 3 Rd or 4 Rd in the present study. The pericenter distance (rp) and the orbital eccentricity (ep) are assumed to be free parameters that control the orbital angular momentum and the energy of the merging galaxies. For most merger models, rp and ep are set to be 1.0 (in our units) and 1.0, respectively. The spin of the satellite dwarf galaxy is specified by two angles θ and ϕ (in units of degrees). Here, θ is the angle between the z-axis and the vector of the angular momentum of the disk, and ϕ is the azimuthal angle measured from the x-axis to the projection of the angular momentum vector of the disk onto the x–y plane. We show the results of the models with θ = 45 and ϕ = 30 in the present study. We investigate the dynamical evolution of a minor merger for [32–40] × tdyn in each model (depending on m2 and orbital configurations), where tdyn is the dynamical timescale of the FGTD. We adopt tdyn = 1.7 × 10⁸ yr in the present study.
Figure 2 shows an example of the final stellar distributions in the stellar remnants of minor galaxy mergers. The initial thin disk in this merger model has m2 = 0.05, Θ = 30, rp = Rd, and ep = 0.5 has Md = 4 × 10⁹M☉, Rd = 17.5 kpc, and fdm = 157. The thin disk can be dynamically heated up by the sinking dwarf disk so that the disk can be transformed into a thick disk with outer disturbed stellar substructures. The vertical stellar velocity dispersion and the rotational velocity in the thick disk are ∼30 km s−1 and ∼120 km s−1 at R = R☉ (=8.5 kpc), respectively. The stellar velocity dispersions and rotational velocity of the thick disk can increase significantly during the growth of a thin disk surrounded by the thick disk. As described later, the final rotational velocity of the thick disk (formed in this minor merger model) after the growth of the thin disk is not altogether consistent with observations. In the present study, merger remnants with larger m2 (∼0.2) can be regarded as better models for the thick disk formation.

Figure 2. Final stellar distribution projected onto the x–y plane (left) and the x–z plane (right) for the minor merger model with m2 = 0.05, rp = Rd, ep = 0.5, and Θ = 30.
Download figure:
Standard image High-resolution image2.1.3. Slow Growth of Thin Disks for Two-component Disk Models
A thin stellar disk is placed within the thick disk so that the dynamical response of the thick disk to the slowly growing thin disk can be investigated. The thick disk formed in a minor merger model is inclined significantly with respect to the x–y plane with the inclination angle depending on Θ. Accordingly a coordinate transformation is performed for the thick disk, so that the final disk plane can be again coincident with the x–y plane and thus with the disk plane of the thin disk. Then the stellar particles that finally consist of the new thin disk are slowly added to the thick disk until the thin disk finally has a mass of Md, n and a size of Rd, n. This addition of stellar particles can mimic the slow growth of the thin disk by gas accretion from the Galactic halo region and the subsequent star formation from the gas. The accretion/formation timescale of the thin disk is set to be 20 tdyn for all models in the present study. The values of Md, n and Rd, n are fixed at 4 × 10¹⁰M☉ and 17.5 kpc, respectively, for most models so that physical properties of the simulated thin disk can be consistent with the observed ones. During the growth of the thin disk, the thin disk particles keep their original locations and velocities, whereas the thick disk particles are allowed to dynamically respond to the changing gravitational potential due to the growth of the thin disk.
The thin disk is assumed to be an exponential disk with the radial scale length being either 0.143 Rd, n or 0.2 Rd, n and the vertical scale height being 0.02 Rd, n. Stellar particles with the total particle number nacc are randomly allocated their initial locations at each time step during the growth of the thin disk. We assume that the disk growth rate is constant, nacc at each time step is Nd, n/Nstep in the present study, where Nd, n is the total number of stellar particles used in the thin disk and Nstep is the total number of time steps in a numerical simulation for the growth of the thin disk. After the completion of the thin disk formation, we then allocate the three-dimensional velocities to each thin disk stellar particle according to the final mass profiles of the dark matter, thick disk, and thin disk in the same way that we did for the FGTD. In addition to the rotational velocity made by the gravitational field of halo and disk components, the initial radial and azimuthal velocity dispersion are given to the disk component according to the epicyclic theory with Toomre's parameter Q = 1.5. The total number of stellar particles in the thin disk is set to be 100,000 for all models in the present study. Thus the two-component disk consists of a collisionless particle with the same softening length for thin and thick disks and the total particle number of 900,000 × (1 + m2) + 100,000 in the simulation.
Figure 3 shows the final stellar distributions of the thick and thin disk components in the two-component disk constructed from the remnant of the minor merger shown in Figure 2. The mass ratio of the thick disk to the thin one (fthick) is 0.105 and ad, n = 0.2 Rd, n in this model. Clearly, the thick disk has a larger scale height and still shows a diffuse flattened halo-like structure (R > 10 kpc). The original thick disk is dynamically compressed and stellar substructures formed in minor merging cannot be clearly seen in this two-component disk. The vertical velocity dispersion and rotational velocity of the thick disk finally becomes 39 km s−1 and 187 km s−1 at R = R☉, respectively, both of which are significantly higher than the original values in the thick disk before the slow growth of the thin disk. The final vertical velocity of the thick disk is larger by a factor of 2.8 than that of the thin disk in this two-component disk model. Although we mainly investigate dynamical evolution of two-component disk models with ad, n = 0.2 Rd, n, we compare the results between models with ad, n = 0.143 Rd and 0.2 Rd, n.

Figure 3. Initial stellar distribution projected onto the x–z plane for the thick disk component (left) and thin one (right) in the two-component disk model constructed from the remnant of the minor merger model with m2 = 0.05, rp = Rd, ep = 0.5, and Θ = 30.
Download figure:
Standard image High-resolution image2.1.4. A Parameter Study
We investigate the dynamical evolution of the thin and thick disks for 40 tdyn by using the two-component stellar disks constructed above. We particularly investigate rotational velocities (Vϕ) and radial (σr), azimuthal (σϕ), and vertical (σz) velocity dispersions in the thin and thick stellar disks when the central stellar bar (=boxy bulge) is formed for each model. Although we have run models with different model parameters, we mainly describe the results of the "standard model" with Md = 4 × 10⁹M☉, Rd = 17.5 kpc, fdm = 157, m2 = 0.2, rp = Rd, ep = 0.5, Θ = 30, Md, n = 4 × 10¹⁰M☉, and Rd, n = 17.5 kpc. Figure 4 shows the radial profiles of Vc and Vϕ in the thin and the thick disk for the two-component disk model. The standard model shows larger differences in Vϕ (∼30 km s−1), which is more consistent with observations (e.g., Soubiran et al. 2003) in comparison with other models. The mass ratio of the thick disk to the thin one (fthick) is 0.12, which is consistent with the observed range of the mass ratio.

Figure 4. Radial profiles of the rotational velocity of the thin disk (blue), that of the thick disk (red), and the circular velocity (green) in the two-component disk for the standard model.
Download figure:
Standard image High-resolution imageWe consider that the models with higher m2 (∼0.2) can be better ones for the thick disk formation in comparison with those with lower m2 (∼0.05), mainly because differences in Vϕ in the simulated thin and thick disks in the models with larger m2 are more similar to the observed one (e.g., Soubiran et al. 2003). The two-component disk model shown in Figure 3 shows a rather small difference in Vϕ at R = R☉ (at most ∼10 km s−1) so that the model cannot be the best model. Two-component disk models constructed from stellar remnants of more energetic mergers with m2 = 0.05, rp = 0.5 Rd, and large ep (e.g., 0.8), however, show larger differences in Vϕ between the thin and thick disks. We investigate the following four kinematical properties at R = R☉ in each model: (1) the circular velocity Vc, (2) the difference in Vϕ between the thin and thick disks, (3) σz, and (4) σr/σz, σϕ/σz, and σr/σϕ. Since the entire structure and kinematics of the thick disk are currently unknown, we compare the above kinematical properties at R = R☉ with the corresponding observational ones (e.g., Dinescu et al. 2011) for the diagnosis of the better models.
Most of the present models show higher σz (40–50 km s−1) at R = R☉ in the thick disk component, which is slightly larger than the observed value. The present minor merger simulations are purely collisionless ones so that they can overpredict stellar velocity dispersions of merger remnants (=thick disks) owing to the lack of gaseous dissipation and cooling. We therefore consider that models with σz ∼ 50 km s−1 which are appreciably larger than the observed one (40 ± 10 km s−1; 39 ± 4 km s−1 Soubiran et al. 2003) can be regarded as reasonable. The present minor models are less realistic in some points (e.g., non-inclusion of gas dynamical and star formation), and we have explored a limited range of model parameters. Therefore, it should be stressed that the present standard model does not explain all of the observed properties of the thick disk in a fully self-consistent manner.
Table 1 summarizes the parameter values for the representative models investigated in the present study. The standard model is labeled M1. For each of these models, we investigate the radial metallicity gradient and the MDF of the simulated thick disk and their dependence on the model parameters for the initial metallicity gradient of the FGTD (e.g., αd). Numerical computations were carried out both on (1) the latest version of GRAPE (GRavity PipE, GRAPE-DR)—which is the special-purpose computer for gravitational dynamics (Sugimoto et al. 1990) and (2) one IBM system iDataPlex with two GPU cards (NVIDIA Tesla M2050) and the CUDA G5/G6 software package installed for calculations of gravitational dynamics at University of Western Australia. It took about 9 CPU hours, 6 CPU hours, and 14 CPU hours for one GRAPE-DR machine to simulate one minor merger model, slow growth of a thin disk surrounded by a thick disk, and dynamical interaction between the thin and thick disks, respectively (thus about 29 CPU hours for ∼92 tdyn dynamical evolution of one sequential dynamical simulation). The time T represents the elapsed time for each simulation of the two-component disk evolution.
Table 1. Model Parameters for N-body Simulations
| Model | Mda | fdmb | m2c | rpd | epe | Θf | fthickg | Md, nh | ad, ni |
|---|---|---|---|---|---|---|---|---|---|
| M1 | 4.0 | 157 | 0.2 | 1.0 | 0.5 | 30 | 0.12 | 4.0 | 0.2 |
| M2 | 4.0 | 157 | 0.05 | 1.0 | 0.5 | 30 | 0.105 | 4.0 | 0.2 |
| M3 | 4.0 | 157 | 0.1 | 1.0 | 0.5 | 30 | 0.11 | 4.0 | 0.2 |
| M4 | 4.0 | 157 | 0.3 | 1.0 | 0.5 | 30 | 0.13 | 4.0 | 0.2 |
| M5 | 4.0 | 157 | 0.2 | 0.5 | 0.8 | 30 | 0.12 | 4.0 | 0.2 |
| M6 | 4.0 | 157 | 0.1 | 1.0 | 0.5 | 60 | 0.12 | 4.0 | 0.2 |
| M7 | 4.0 | 157 | 0.2 | 1.0 | 0.5 | 30 | 0.12 | 4.0 | 0.14 |
| M8 | 8.0 | 79 | 0.2 | 1.0 | 0.5 | 30 | 0.24 | 4.0 | 0.2 |
| M9 | 4.0 | 99 | 0.2 | 1.0 | 0.5 | 30 | 0.12 | 4.0 | 0.2 |
| M10 | 4.0 | 99 | 0.05 | 1.0 | 0.5 | 30 | 0.105 | 4.0 | 0.2 |
| M11 | 4.0 | 99 | 0.2 | 1.0 | 0.5 | 30 | 0.12 | 4.0 | 0.14 |
| M12 | 4.0 | 157 | 0.2 | 1.0 | 0.5 | 30 | 0.24 | 2.0 | 0.2 |
| M13 | 4.0 | 157 | 0.2 | 1.0 | 0.5 | 30 | 0.40 | 1.2 | 0.2 |
| M14 | 4.0 | 157 | 0.05 | 1.0 | 0.8 | 30 | 0.105 | 4.0 | 0.2 |
| M15 | 4.0 | 157 | 0.1 | 1.0 | 0.5 | 0 | 0.11 | 4.0 | 0.2 |
| M16 | 4.0 | 157 | 0.2 | 1.0 | 0.5 | 0 | 0.12 | 4.0 | 0.2 |
Notes. aThe total mass of the stellar disk in the FGTD in units of 109 M☉. bThe mass ratio of the dark matter halo to the stellar disk in the FGTD. cThe mass ratio of the dwarf disk to the FGTD in a minor merger. dThe pericenter distance of the orbit in a minor merger model in units of Rd, where Rd is the disk size of the FGTD. eThe orbital pericenter distance in a minor merger model. fThe inclination angle between the orbital plane of the dwarf disk and the x–y plane (corresponding to the disk plane of the FGTD). gThe mass ratio of the thick disk to the thin disk in a two-component disk model. hThe total mass of the stellar disk in the thin disk in units of 1010 M☉. iThe scale length of the thin disk in units of the disk size (Rd, n).
Download table as: ASCIITypeset image
2.2. Chemical Evolution Models
Since the present one-zone chemical evolution models for the Galaxy are essentially the same as those adopted in our previous paper (Tsujimoto et al. 2010), we here briefly describe the models. The basic picture is that the Galactic thin and thick disks were formed by gas infall from outside the disk region. For the infall rate, we apply an exponential form with a timescale τin. Taking into account the relatively rapid formation of the thick disk and the presence of the G-dwarf problem for the thin disk, we assume a rather short timescale of τin = 0.3 Gyr for the thick disk, and a much longer timescale of τin = 4 Gyr for the thin disk. The metallicity Zin of infalling gas is set up as follows. The MDF of the thick disk shows a sharp increase from [Fe/H] ∼−1.3 to the peak located at [Fe/H] ∼−0.7. This feature was first reported by Wyse & Gilmore (1995) with a small number of complete samples, and the location of its peak is confirmed by the huge Sloan Digital Sky Survey database of stars within the thick disk (Allende Prieto et al. 2006). These observational results suggest that material for the proto-thick disk was pre-enriched up to [Fe/H] ∼−1.3. The mechanism of pre-enrichment may be attributable to wind enrichment triggered by an initial starburst in the Galactic bulge (Tsujimoto et al. 2010; Tsujimoto 2011). Accordingly, [Fe/H] = −1.3 is assumed for the infalling gas of the thick disk.
On the other hand, Zin of the thin disk (i.e., metallicity of the gas accreted from the Galactic halo) is determined by an implication from the cosmic evolution of damped Lyα systems (Wolfe et al. 2005). Its metallicity at the epoch of thin disk formation, i.e., ∼9 Gyr ago, is assumed to be fixed around [Fe/H] = −1.5 while the thin disk is forming. We also assume that the [α/Fe] ratio in the gas accreted onto the thin disk is fixed at a high value (e.g., [Mg/Fe] = +0.4) as expected from chemical enrichment dominated by SNe II. As shown later in Section 3.3, the present model can self-consistently reproduce some of the observed chemical properties of the Galactic thin and thick disks for the adopted values of Zin and the [α/Fe] ratios for gas accreted onto the disks.
The star formation rate (SFR) is assumed to be proportional to the gas fraction with a constant coefficient ν for the duration ΔSF. The higher value of ν = 2 Gyr−1 for ΔSF = 1.5 Gyr is adopted for the thick disk, compared with ν = 0.7 Gyr−1 and ΔSF = 12 Gyr for the thin disk. Here, the duration of thin disk formation is set so that the sum of timescales for two-disk formation is broadly equivalent to the age of the universe (=13.7 Gyr). For the initial mass function, we assume a power-law mass spectrum with a slope of −1.35, which is combined with the nucleosynthesis yields of SNe Ia and II taken from Tsujimoto et al. (1995). In our model, the products of SNe II are ejected with the short lifetime ∼106 − 7 yr of massive stars depending on their masses, while those of SNe Ia are released with a delay of a considerably longer lifetime spanning over 0.5–3 Gyr (Yoshii et al. 1996). The fraction of stars that eventually produce SNe Ia for 3–8 M☉ is assumed to be 0.05.
In the present scenario of thick disk formation, star formation within the thin disk can occur after the termination of star formation in the thick disk. Accordingly, the present chemical evolution models are different from those previously adopted (e.g., Chiappini et al. 1997). We consider the three models for the star formation history of the thin disk after the formation of the thick disk by minor merging described below. The first scenario is the "continuous star formation model" in which the thin disk stars start to form from the thick disk's remaining gas (corresponding to only ∼10% of the original gas) mixed with the gas accreted onto the disk immediately after the thick disk formation. In this model, chemical abundances of the first stars in the thin disk are similar to those of the most metal-rich stars in the thick disk.
The second scenario is the "temporal truncation model" in which star formation in the thin disk cannot start until some amount of gas is accreted onto the disk. Therefore, the first stars in the thin disk will have chemical abundances different from those of the final stars in the thick disk. Here the timing to initiate the formation of thin disk stars is set at the time when the metallicity of gas is diluted to [Fe/H] = −0.7 by gas accretion from the halo region (corresponding to about 1.5 Gyr after the formation of the thick disk). The total amount of the halo gas accreted onto the disk before the commencement of star formation in the thin disk is about five times larger than that of the remaining gas of the thick disk. We discuss a possible mechanism for the assumed temporal truncation of star formation later in the Appendix. The third scenario is the "gas expulsion model" in which the thick disk's remaining gas is expelled immediately after the formation of the thick disk and thus the thin disk is formed purely from gas accreted from the halo. Since our N-body simulations, which do not include star formation and gas accretion, do not allow us to determine the most probable model among the above-mentioned three, we investigate all three scenarios and compare them with one another in Section 3.3.
3. RESULTS
3.1. Metallicity Gradients and MDFs in Thick Disks
Figure 5 shows the radial distribution of stellar metallicities in the thick disk formed from minor merging with m2 = 0.2, rp = Rd, ep = 0.5, and Θ = 30 (i.e., the standard model M1) for αd = −0.04, αb = −0.4, and αdw = −0.04. During minor merging, stellar populations with different metallicities can be radially mixed so that the original radial metallicity gradient changes significantly. As shown clearly in Figure 5, the initial steeper radial metallicity gradient of the FGTD can become significantly flattened after minor merging. More metal-rich stars initially in the inner disk region can be finally located at R > 5 kpc so that the final mean metallicities at radial bins with R > 5 kpc can slightly increase. On the other hand, the more metal-poor stars initially in the outer part of the FGTD can be located in the inner disk region, which lowers the mean metallicities for R < 2 kpc. The mean metallicities in radial bins with R > 10 kpc can significantly increase after minor merging, because the more metal-rich stars in the inner region of the disk (R < 10 kpc) can be transferred to the outer region.

Figure 5. Radial distribution of stellar metallicities in the thick disk formed in the minor merger model with m2 = 0.2, rp = Rd, ep = 0.5, and Θ = 30, which is used for constructing the two-component disk in the standard model. Each small black dot represents the location of a star in the thick disk. The red, blue, and green lines represent the initial metallicity gradients for the stellar disk of the FGTD, the dwarf, and the bulge component of the FGTD, respectively. Each magenta filled circle represents the mean [Fe/H] for each radial bin.
Download figure:
Standard image High-resolution imageThe radial mixing of the stellar population in minor merging can transfer metal-rich stars with [Fe/H] ∼−0.5–0.3 initially in the inner disk region into the solar neighborhood (R = R☉ corresponding to 8.5 kpc). This result implies that some fraction of metal-rich stars currently at R = R☉ in the thick disk can originate from the inner disk of the FGTD. It should be stressed that the radial transfer of the inner metal-rich stars into the solar neighborhood depends strongly on m2 and that the radial transfer can be less effective in minor merging with smaller m2. As a result of radial mixing of stellar populations with different metallicities, the MDF of the thick disk is different between different regions. Figure 6 shows that the MDF in the solar neighborhood (8 kpc ⩽R ⩽ 9 kpc) has a peak metallicity at [Fe/H] ∼−0.7 and a wide metallicity distribution. The MDF of the thick disk at the bulge region (R ⩽ 2 kpc) shows a higher peak metallicity at [Fe/H] ∼−0.5 and a narrower distribution with a long tail in the distribution at higher [Fe/H] (>0.1). The MDF at R ⩾ 12 kpc shows a lower peak metallicity at [Fe/H] ∼−0.8 and a larger fraction of metal-poor stars with [Fe/H] <−0.8.

Figure 6. MDFs for R ⩽ 2 kpc (bulge region; red), 8 kpc ⩽ R ⩽ 9 kpc (the solar neighborhood; blue), and R ⩾ 12 kpc (outer disk, green) in the thick disk shown in Figure 5. The number distribution of stars is normalized by the maximum number of stars in the metallicity bins for each of the three regions.
Download figure:
Standard image High-resolution imageThe final radial metallicity gradient of the thick disk depends on the adopted initial metallicity gradient of the FGTD. We confirm that flattening of the initial metallicity gradient of the FGTD can be seen in almost all of the simulated thick disks in different models for initial radial gradients of stellar metallicities, though the degree of the flattening depends largely on m2. Figure 7 shows that the radial metallicity gradient of the thick disk is not influenced so much by that of the bulge, because only a minor fraction of the bulge stars can be transferred to the disk region during minor merging. As shown in Figure 7, the flattening of the radial metallicity gradient can be more clearly seen in the model with the steeper initial metallicity gradient of the FGTD. There is no significant difference in the final metallicity gradient of the thick disk between the standard model and the one with no initial metallicity gradient in the dwarf disk, which means the transfer of metal-poor stellar populations from a dwarf disk to the thick disk is not an important factor for determining the radial metallicity gradient of the thick disk. Figure 8 shows that the shapes of the MDFs for the three different regions of the thick disk depend on the adopted initial metallicity gradient of the FGTD, which suggests that the MDFs can have some fossil information on the original metallicity gradient of the FGTD before ancient minor merging transformed it into the thick disk.

Figure 7. Same as Figure 5 but for four different models: (a) shallower metallicity gradient in the bulge (αb = −0.2), (b) shallower metallicity gradient in the disk ((αd = −0.02), (c) steeper metallicity gradient in the disk (αd = −0.08), and (d) no metallicity gradient in the dwarf (αdw = 0).
Download figure:
Standard image High-resolution image
Download figure:
Standard image High-resolution image3.2. Dynamical Properties of Two-component Disks
Figures 9 and 10 show the long-term dynamical evolution of the two-component stellar disk in the standard model (M1) in which the final mass fraction of the thick disk versus the thin disk is 0.12. A stellar bar can form spontaneously from global bar instability in the thin disk within ∼2 Gyr so that the thin disk appears to have a boxy-shape in the edge-on view (T = 2.8 Gyr). The "box-shaped bulge," which is just an edge-on bar, appears to grow as the stellar bar becomes stronger and longer (T = 5.5 Gyr). Finally a thin disk is transformed into a longer stellar bar with the edge-on view being similar to a disk with a boxy bulge (T = 6.9 Gyr). The stellar bar of the thin disk can dynamically interact with the thick disk so that the structural and kinematical properties of the thick disk can be significantly changed. One of the remarkable effects of the barred thin disk is that the initially non-barred thick disk can be transformed into a barred one with the position angle and pattern speed of the bar being similar to those of the bar in the thin disk. As shown in Figure 9, a slightly shorter stellar bar is formed in the thick disk at T = 2.8 Gyr. This formation of the "barred thick disk" suggests that the Galactic thick disk is likely to have a barred structure, in particular, in its inner part. Figure 10 also shows that the thick disk appears to be thicker and more triaxial after its dynamical interaction with the thin disk.

Figure 9. Time evolution of stellar distributions for the thin disk component (upper six) and for the thick one (lower six) projected onto the x–y plane in the two-component disk for the standard model. The time T in units of Gyr is shown in the upper left corner of each panel.
Download figure:
Standard image High-resolution image
Figure 10. Same as Figure 9 but for the x–z plane.
Download figure:
Standard image High-resolution imageFigure 11 shows the radial and vertical surface stellar density profiles (Σs) of the thin and thick disks at T = 0 Gyr (initial) and T = 2.8 Gyr (after bar formation) in the standard model. This figure accordingly shows how the radial and vertical structures of the two disks change as a result of the dynamical interaction between the stellar bar and the two disks. The simulated rather flat profile of the vertical structure of the thick disk at 5 ⩽ R ⩽ 9 kpc in the present study can be seen also in a recent work by Villalobos et al. (2010). Although the inner part of the thick disk is morphologically transformed into a bar, the radial density profile does not change so significantly. The central (R < 2 kpc) and outer (R > 12 kpc) parts of the thin disk show slight increases in the radial surface stellar density profile (Σs(R)) whereas the inner part at R ∼ 5 kpc shows a decrease in Σs(R). The thick disk at 5 kpc ⩽ R ⩽ 9 kpc does not show a significant change in the overall vertical structure, though the profile becomes slightly steeper. The vertical density profile of the thin disk becomes appreciably flatter (or the thin disk becomes slightly thicker) owing to the dynamical action of the bar. Thus, the radial and vertical density profiles of the thin disk can be more strongly influenced by the stellar bar in comparison with those of the thick disk.

Figure 11. Radial (upper) and vertical (lower) stellar surface density (Σs) profiles for the thin (blue) and thick (red) disks at T = 0 Gyr (solid) and T = 2.8 Gyr (dotted) for the two-component disk in the standard model. The black dashed line in the upper panel represents the observed Σs (49.6 M☉ pc−2) at R = R☉.
Download figure:
Standard image High-resolution imageFigure 12 shows that the thin and thick disks have different kinematical properties just after the formation of the inner stellar bar at T = 2.8 Gyr. Owing to the dynamical influence of the stellar bar on the thick disk, the Vϕ difference in the thin and thick disks at R = R☉ becomes smaller (∼16 km s−1). The vertical velocity dispersion of the thick disk also becomes slightly larger (σz ∼ 53 km s−1) after the stellar bar formation. The thick disk has σr = 70 km s−1 (i.e., σr/σz ∼ 1.3) and σϕ = 55 km s−1 (σϕ/σz ∼ 1.0), both of which are significantly higher than those of the thin disk. The thick disk can continue to be dynamically influenced by the growing stellar bar in the thin disk so that σϕ and σz at R = R☉ can become slightly larger at T = 6.9 Gyr. The derived larger σz means that the stellar bar in the thin disk can continue to change the kinematics of the thick disk within ∼7 Gyr.

Figure 12. Radial profiles of Vϕ (top), σϕ (the second from the top), σr (the second from the bottom), and σz (bottom) for the thin disk (blue) and the thick disk (red).
Download figure:
Standard image High-resolution imageFigure 13 shows that the kinematical properties of the simulated two-component disks depend largely on the model parameters of minor mergers (m2, rp, and ep) in the models, M2–M5. The two-component disks constructed from merger remnants with m2 = 0.05 (M2) and 0.1 (M3) have smaller Vϕ differences in the thin and thick disks and smaller σz. In these models with smaller m2, the differences in the radial profiles of Vϕ, σr, and σϕ between the thin and the thick disks at R < 10 kpc are small and thus are less consistent with observations, which means that minor merging with lower m2 is unlikely to be responsible for the formation of the Galactic thick disk. The model M4 with larger m2 (=0.3) shows a higher degree of kinematical differences in the thin and thick disks, which can still be consistent with observations. The stellar bar developed in the thick disk for this model is a shorter (or fatter) and weaker one. The thick disk in the model M5 with m2 = 0.2, rp = 0.5 Rd, and ep = 0.8 (thus more energetic minor merger) does not clearly show a strongly barred structure, though the thin disk has a strong bar. As shown in Figure 13, the FGTD is too strongly damaged by minor merging so that the Vϕ difference in the thin and thick disks is quite large, even after the slow growth of the thin disk. This model cannot be regarded as reasonable for the Galactic disk.

Figure 13. Same as Figure 12 but for four different models: (a) m2 = 0.05 (model M2), (b) m2 = 0.1 (M3), (c) m2 = 0.3 (M4), and (d) m2 = 0.2, rp = 0.5 Rd, and ep = 0.8 (M5). For the three models, (a), (b), and (c), the orbital parameters of minor mergers are the same as those adopted in the standard model.
Download figure:
Standard image High-resolution imageAlthough we confirm that stellar bars can be formed in thick disks for most models (i.e., M1–M12 except M5), the morphological properties of the simulated bars are different between different models. For example, the model M12 with a smaller mass of the thin disk (Md, n = 2 × 10¹⁰ M☉) shows the formation of a shorter and weaker bar in the thin disk so that the thick disk cannot clearly show a strongly barred structure (but show a fat, elliptic morphology) owing to the weaker dynamical effect of the bar of the thin disk on the thick disk. The models with smaller Md, n (e.g., Md, n ⩽ 1010 M☉) do not show the formation of bars in the thin (thus thick) disk. These results suggest that the thick disk can be influenced by the barred structure of the thin disk only in the later stage of the disk evolution (i.e., when the disk has a larger mass). These models with smaller Md, n show lower velocity dispersion within the thick disk (e.g., σz ∼ 40 km s−1), which is more consistent with observations. The present results on the kinematical differences between thin and thick disks do not depend so strongly on Md, fdm, and ad, n, but they depend more strongly on m2 and Θ. The dynamical properties of the model M6 with large Θ (=60) are less consistent with observations than other models with lower Θ (⩽30), as already demonstrated by previous works (e.g., Villalobos & Helmi 2008).
It is possible that the slow growth of the thin disk and its stellar bar can also significantly change the radial metallicity gradient owing to the dynamical action of the bar. Figure 14 shows that the radial metallicity gradient at T = 2.8 Gyr becomes slightly flattened in comparison with the gradient just after minor merging shown in Figure 5. The reason for this is that the metallicities in the inner regions of the thick disk at R < 10 kpc become systematically smaller after the formation of the stellar bar. This result implies that the growth process of the thin disk and the dynamical action of the stellar bar can be important factors for determining the slope of the radial metallicity gradient of the thick disk. It should be stressed here that the flattening of the radial metallicity gradient of the thick disk by the thin disk can also be clearly seen in the model with lower m2 (=0.05 and 0.1): the radial metallicity gradients of the thick disks at R > 5 kpc in these two-component models become significantly more flattened than those just after minor merging.

Figure 14. Same as Figure 5 but for the two-component disk at T = 2.8 Gyr (upper) and T = 6.9 Gyr (lower) for the standard model. The disk has a stellar bar so that the radial metallicity gradient of the thick disk can be flattened slightly by dynamical action of the bar (i.e., radial mixing of stars with different metallicities).
Download figure:
Standard image High-resolution imageThe dynamical interaction between stellar bars and thick disks in the present two-component disk models can transfer stars within R = 2 kpc to the outer disk regions at R > R☉. However, the number fractions of stars that are located initially at R ⩽ 2 kpc and finally at R ⩾ 8 kpc is less than 10−4 for the present models, even if the central bars become long and strong. Therefore, the radial transfer of bulge stars with high [Fe/H] to the solar neighborhood is much less efficient in the present models. It should be stressed here that some fraction of metal-rich stars in the inner disk regions can be transferred to the solar neighborhood. On the other hand, the slow growth of the thin disk can contract the thick disk so that the number fractions of more metal-rich stars ([Fe/H] >−0.5) at R > 5 kpc in the thick disks can slightly decrease as the thin disk slowly grows (though the number fractions just after minor merging are larger). Thus these results in Sections 3.1 and 3.2 suggest that both minor merging and dynamical influences of the evolving thin disk on the thick disk can be important in understanding the origin of the radial metallicity gradient and the presence of metal-rich stars at R = R☉ in the Galactic thick disk.
3.3. Chemical Evolution of the Thin and Thick Disks
Figure 15 shows the star formation histories, MDFs, and [Mg/Fe]–[Fe/H] relations for the thin and thick disks in the continuous star formation model. The upper panel of Figure 15 shows the predicted star formation history of the Galactic disk, where the thick disk is first formed rapidly, followed by a gradual formation of the thin disk over a prolonged timescale. Here, each SFR is normalized so that each total stellar mass is unity. The resultant MDFs for thick disk and thin disk, and the correlations of [Mg/Fe] with [Fe/H] are shown in this figure. In this model, the thick disk formation terminates when the metallicity reaches [Fe/H] ∼ 0 at around 1.5 Gyr, and accordingly this model explains the overall shape of the observed MDF. However, if we assume a longer timescale of star formation, the predicted [Mg/Fe] trend afterward continues to decrease with increasing [Fe/H] whereas the observed [Mg/Fe] for [Fe/H] > 0 holds broadly constant.

Figure 15. Chemical features predicted by the continuous star formation model for the thick and thin disks in the solar neighborhood. Upper panel: the star formation rate as a function of time for the thick disk (red curve) and the thin disk (blue curve). Each SFR is normalized so that each total stellar mass is unity. Middle panel: predicted MDFs of the thick disk (left) and the thin disk stars (right) compared with the observations. The calculated distributions are convolved using a Gaussian with a dispersion of 0.1 dex considering a measurement error expected in the data. Filled circles represent data taken from Wyse & Gilmore (1995), and open circles are from Edvardsson et al. (1993). Bottom panel: observed and predicted correlations of [Mg/Fe] with [Fe/H] for the thick and thin disks, compared with those for the Galaxy. The observed data of the thick disk are denoted by filled circles (Bensby et al. 2005), and those for the thin disk are denoted by crosses (Edvardsson et al. 1993; Bensby et al. 2005).
Download figure:
Standard image High-resolution imageTherefore, the model cannot reproduce well the observed flat distribution of the thick disk stars with [Fe/H] >0 in the [Mg/Fe]–[Fe/H] relation (e.g., Bensby et al. 2003). Although the total number of such stars could be less than ∼10% (e.g., Bensby et al. 2007), this apparent inconsistency implies that such metal-rich stars cannot form in situ in the solar neighborhood. Thus, we need to consider that (1) this apparent inconsistency is due largely to the limitation of the adopted one-zone chemical evolution model which does not consider mixing of stellar populations between different disk regions and thus (2) these metal-rich stars with [Fe/H] >0 and [Mg/Fe] ∼0.1 are likely to migrate from the inner thick disk and the bulge where more metal-rich stars exist. We will discuss this point later in the context of radial mixing due to minor merging in Section 4.2.
Since the thick disk formation leaves the metal-rich gas as an end product of its chemical evolution, the evolution of [Mg/Fe] starts from [Fe/H] ∼ 0 (when the final gas mass fraction is ∼10%). Then, [Fe/H] and [Mg/Fe] decreases and increases, respectively, owing to dilution by metal-poor infalling gas with a high [Mg/Fe] ratio (∼+0.4). This reverse evolution comes to an end when the chemical enrichment by star formation exceeds the effect of gas dilution, and subsequently a usual evolutionary path appears. In the end, the overall behavior explains, in part, a large dispersion in stellar ages as well as in [Mg/Fe] among the thin disk stars. In addition, it may be possible to claim that the remaining metal-rich gas after the thick disk formation results in the presence of no metal-poor thin disk stars.
The results of the temporal truncation model do not differ significantly from those of the continuous star formation model in terms of the MDF of the thin disk stars. Figure 16 shows that the temporal truncation model can reproduce the observed MDF of the thin disk stars as well as the continuous one. The remarkable difference between the two is that there are no old thin disk stars with [Fe/H] ∼0 and [Mg/Fe] ∼0.1 in the temporal truncation model, because star formation in the thin disk can start only after the gas of the disk has [Fe/H] ∼−0.7 owing to gas accretion in the temporal truncation model. There is a clear distinction between the locations of the thin and thick disk stars on the [Mg/Fe]–[Fe/H] relation in the temporal truncation model versus the continuous star formation model. However, it is currently difficult to determine which of the two can better fit to observations owing to the lack of observational information on the relation between [Mg/Fe], [Fe/H], and stellar ages among the thin disk stars.

Figure 16. Predicted features by the temporal truncation model (solid curve) and the expulsion model (dashed curve) for the thin disk. The symbols are the same as in Figure 15. For reference, the result for the thick disk is shown as a red curve in the lower panel.
Download figure:
Standard image High-resolution imageThe gas expulsion model shows MDFs and [Mg/Fe]–[Fe/H] relations quite similar to those in the other two models, which implies that it would be difficult to observationally determine the best possible model among the three based only on the comparison between the observed and simulated MDFs and [Mg/Fe] relations. The only significant difference between this model and other two is the presence of thin disk stars with low [Fe/H] (<−1) and high [Mg/Fe] (∼0.4). In the end, the locations of the oldest thin disk stars on the [Mg/Fe]–[Fe/H] relation can be significantly different among the three models, which implies that the simultaneous derivation of ages and abundances for such older stars is a key to distinguish between the three models. The overall agreement of the observed and simulated MDFs and [Mg/Fe]–[Fe/H] relations of the Galactic thin and thick disk stars for all of the three models suggests that the minor merger scenario of the thick disk formation is a promising one.
4. DISCUSSION
4.1. The Possible Presence of a Barred Thick Disk
The present study has first demonstrated that the Galactic thick disk can have a barred structure if it was formed prior to the formation of the Galactic thin disk and thus has long been influenced dynamically by the thin disk with a stellar bar. Given that most models have shown the formation of a barred thick disk in the two-component stellar disks, the present prediction on the presence of the barred thick disk in the Galaxy might well be regarded as robust. Recent theoretical studies on the formation of the thick disk through radial mixing of stars did not show the formation of the barred thick disk in their models (e.g., Schönrich & Binney 2009; Loebman et al. 2010). Previous cosmological simulations on the thick disk formation via accretion (Abadi et al. 2003) and gas-rich mergers (Brook et al. 2004) did not show the formation of the barred thick disk either. It is thus possible that the presence or absence of the global barred structure of the thick disk can be a clue as to how the thick disk was formed. However, it should be stressed here that the present study could overestimate the dynamical influence of the stellar bar on the thick disk, because the simulated bars are stronger and longer than the real Galactic bar owing to the adopted model in which the entire disk has a smaller Q (1.5) when it is fully developed: a stronger and longer stellar bar can form from such a massive disk with a smaller Q parameter.
Larsen & Humphreys (1996) first revealed an excess of faint blue stars with B − V bluer than by 0.6 mag in Quadrant 1 (Q1) in comparison with Quadrant 4 (Q4) and thus suggested that the observed excess can result either from the elliptic thick disk or heating of the disk by the bar. Parker et al. (2004) later confirmed the presence of the asymmetric thick disk in Q1 and also revealed kinematical asymmetry between the thick disk stars in Q1 and Q4 (i.e., differences in Vϕ). Humphreys et al. (2011) confirmed the kinematical differences of the thick disk stars in Q1 and Q4 and suggested that the dynamical interaction between the stellar bar and the thick disk can be responsible for the observed kinematical differences. Given that these observations did not map the entire region of the thick disk, it remains observationally unclear whether or not the thick disk stars have a global barred structure, in particular, in the inner disk (R < 3 kpc), where the Galactic bar is considered to exist (e.g., Weinberg 1992).
Although the above observations cannot be compared directly with the present results, it is instructive for the present study to show how Vϕ in the thick disk can be different in different regions of the Galaxy. Figure 17 shows the two-dimensional (2D) distribution of Vϕ for thick disk stars projected onto the x–y plane at T = 2.8 Gyr in the standard model. The simulated thick disk with a central bar in this model is divided into 50 × 50 local regions within 12 kpc from the center of the disk and the mean Vϕ at each region is estimated. The derived 2D Vϕ distribution clearly shows an elongated and asymmetric (bar-like) feature, in particular, for the inner region (R < 5 kpc). This result clearly suggests that if observational studies find an asymmetric 2D Vϕ distribution in the thick disk, there is kinematical evidence which supports the presence of a barred thick disk in the Galaxy. There is no clear sign of a past minor merger event in the 2D Vϕ distribution, which implies that kinematical evidence for past minor merger events would be hard to find in observations on the 2D Vϕ distribution of the Galactic thick disk.

Figure 17. Two-dimensional (2D) distribution of Vϕ for thick disk stars at T = 2.8 Gyr in the standard model. The simulated 2D Vϕ distribution is clearly asymmetric, in particular, in the central 5 kpc of the thick disk.
Download figure:
Standard image High-resolution imageIf the Galactic thick disk really has a barred structure in its inner part, then the observed 2D structure and kinematics can give strong constraints on the formation processes of the thick disk. The discovery of a barred structure with a position angle and pattern speed of the bar being almost identical to those of the Galactic bar would support the minor merger scenario. If such a bar is not found in the inner region of the Galaxy, then the minor merger scenario would need to clarify why the formation of a bar in the thick disk is suppressed in spite of the presence of ongoing interaction between the realistic bar and the thick disk. Given that there is no paper that extensively investigated dynamical interaction between the realistic Galactic bar and the thick disk, it is doubtlessly worthwhile for future studies to investigate their dynamical interaction in a comprehensive way, and compare the simulated 2D radial and azimuthal velocity dispersions in the thick disk with the corresponding observations (e.g., Humphreys et al. 2011).
4.2. The Radial Metallicity Gradient in the Thick Disk
Allende Prieto et al. (2006) revealed that G-dwarf stars in the Galactic thick disk have a very flat radial metallicity gradient for 4 kpc < R < 14 kpc and 1 < |z| < 3 kpc and that the mean metallicity at each radial bin for 4 kpc < R < 14 kpc is about [Fe/H] ∼−0.7 (independent of R). Although the presence of more metal-rich stars in the outer part (R > 10 kpc) of the thick disk is consistent with the present merger scenario, the observed no/little radial metallicity gradient appears to be less consistent with the predictions of the present minor merger models. The above-mentioned problem of the present minor merger scenario is due to the larger mean metallicity ([Fe/H] >−0.7) of the thick disk stars at 4 kpc < R < 7 kpc. For the minor merger scenario to be still a promising one, the problem would need to be resolved. Obviously, if the original metallicity gradient in the FGTD is flat, then the final one in the thick disk can be also flat. If this is the case, the minor merger scenario has no serious problem with the observed lack of a metallicity gradient in the thick disk. However, star formation can proceed more rapidly in higher density regions so that chemical abundances become higher more rapidly in these regions. Therefore, it is less likely that the FGTD with an initial exponential radial density profile (i.e., higher density in the inner region) has no radial metallicity gradient. Thus the above apparent inconsistency on the radial metallicity gradient would need to be regarded as a potential problem in the minor merger scenario.
The observed lack of the radial metallicity gradient in the thick disk is suggested to be consistent with the gas-rich merger scenario for thick disk formation (e.g., Brook et al. 2004; Allende Prieto et al. 2006). Although the radial mixing scenario by Schönrich & Binney (2009) did not extensively discuss the radial metallicity gradient of the thick disk, Figure 12 in Loebman et al. (2010) shows a flat (or possibly positive) gradient 7 kpc < R < 11 kpc, though the thick disk stars appears to have higher [Fe/H] ranging from −0.5 to −0.3 in their Figure 6. Since numerical simulations based on the accretion scenario by Abadi et al. (2003) did not include chemical evolution models, we cannot discuss the scenario here in the context of the radial metallicity gradient of the thick disk.
Radial mixing of stellar populations during minor merging can transfer stars with higher metallicities in the inner FGTD (R < 5 kpc) to the solar neighborhood (R = R☉, 8.5 kpc) and thus provide a clue to the origin of the observed presence of metal-rich stars with [Fe/H] >0 and higher [α/Fe] (∼0.1) in the thick disk (e.g., Bensby et al. 2003; Casagrande et al. 2011). In the present study, the final number fractions (Fmr) of metal-rich stars with [Fe/H] >0 at R > 8 kpc in the two-component models are less than 10−4 (even after the formation of bars). This number Fmr can increase significantly if we adopt a more realistic model in which the initial MDF at each radius in the FGTD has a dispersion: the metallicity at each radius in the FGTD is fixed at a certain value (with no dispersion) according to the adopted metallicity gradient in the present study. It should also be stressed here that minor merging with m2 ⩽ 0.05 does not show such efficient radial mixing as seen in other models with m2 ⩾ 0.1 in the present study. Figure 18 shows that (1) the metallicity gradient becomes flat only for R > 10 kpc in the model M2 with m2 = 0.05 and (2) the transfer of the metal-rich stars initially within R < 5 kpc to the solar neighborhood is much less efficient. The radial mixing scenario (e.g., Roškar et al. 2008; Loebman et al. 2010) can explain the presence of such metal-rich stars in a different way from the present merger scenario.

Figure 18. Same as Figure 5 but for the model M2 with m2 = 0.05. It is clear that radial mixing of stellar populations by minor merging in this model is less efficient in comparison with the standard model M1 shown in Figure 5.
Download figure:
Standard image High-resolution image4.3. The Observed Vϕ–[Fe/H] Relation of the Thick Disk
Chiba & Beers (2000) investigated space motions and metal abundances of 1203 solar-neighborhood stars with [Fe/H] <−0.6 and found that Vϕ of the more metal-rich stars are larger for |z| < 4 kpc (see also more recent results by Carollo et al. 2010). Spagna et al. (2010) also found that more metal-rich stars in the Galactic thick disk at 1 < |z| < 3 kpc have higher Vϕ and suggested that this correlation can give a constraint on the formation models of the thick disk. Lee et al. (2011) have recently confirmed a positive correlation between Vϕ and [Fe/H] in the thick disk and derived a relation of ΔVϕ/Δ [Fe/H] = 49.0 ± 3.4 (km s−1 dex−1). If future observations (e.g., Gaia and HERMES) can select thick disk stars based both on their locations and kinematics and thereby investigate the Vϕ–[Fe/H] relation, then we will be able to make a more robust conclusion on the viability of the minor merger scenario based on the comparison between the observed and simulated Vϕ–[Fe/H] relations. However, it is worthwhile for the present study to investigate whether there is a positive correlation between [Fe/H] and Vϕ in the simulated thick disks.
Figure 19 shows the Vϕ–[Fe/H] relation for 1789 stars of the thick disk at 8 kpc ⩽ R ⩽ 9 kpc and 1 kpc ⩽ |z| ⩽ 3 kpc for the two-component disk of the standard model (at T = 2.8 Gyr). Here four different models for different initial metallicity gradients in the outer part of the FGTD are adopted. Although the dispersion at each [Fe/H] bin is large (∼50 km s−1), there is no clear Vϕ–[Fe/H] correlation for αd = −0.04 in the standard model. In the present minor merger scenario, more metal-rich stars are initially located in the inner regions of the FGTD (owing to the adopted negative metallicity gradient of the FGTD), where Vϕ is smaller, so that they can have smaller Vϕ. Therefore, it is not so straightforward for the minor merger scenario to explain the higher Vϕ in more metal-rich stars at R = R☉. It is found that for a steeper metallicity gradient (αd = −0.08), the simulated Vϕ −[Fe/H] relation becomes similar to the observed one by Lee et al. (2011), which shows a weak positive correlation between Vϕ and [Fe/H]. There would be a possibility that the thin disk stars with higher [Fe/H] and larger Vϕ are included in the observed thick disk sample. If this contamination of the thin disk stars is real, then the observed Vϕ −[Fe/H] becomes even weaker so that it can be more consistent with the simulated one in the present study. We confirm that models with αd = −0.04 and different central metallicities in the disk (e.g., panel (d) in Figure 19) cannot reproduce the observation very well. These results imply that the observed correlation between Vϕ and [Fe/H] can give some constraints on the initial metallicity gradient of the FGTD in the Galaxy.

Figure 19. Dependence of Vϕ for thick disk stars at the solar neighborhood on [Fe/H] in the standard model with different metallicity gradients for the FGTD: (a) αd = −0.04, (b) αd = −0.06, (c) αd = −0.08, and (d) αd = −0.04 and the central metallicity of the FGTD 0.1 dex lower than that in the model (a). Each filled circle and error bar represent the mean Vϕ and its dispersion at each [Fe/H] bin. The observed positive Vϕ–[Fe/H] correlation from Lee et al. (2011) is shown by a solid line in each frame. Here stars with 8 ⩽ R ⩽ 9 kpc and 1 ⩽ |z| ⩽ 3 kpc are selected so that the simulation results can be compared with the corresponding observations.
Download figure:
Standard image High-resolution image4.4. Vϕ and Orbital Eccentricities of the Thick Disk Stars Dependent on |z|
Recent observational studies have revealed that Vϕ depends on |z| such that Vϕ is smaller for larger |z| (ΔVϕ/Δ|z| = −10.8 ± 0.9 km s−1 kpc−1) for the Galactic thick disk at the solar neighborhood (Lee et al. 2011). Although Villalobos & Helmi (2008) have already shown that thick disks which formed from minor merging with lower Θ (0 and 30 in their Figure 20) can clearly show Vϕ–|z| correlations, they did not directly compare their results with the corresponding observations. Accordingly, it is worthwhile for the present study to compare the results with the observational result by Lee et al. (2011). We have investigated which model in the present study can reproduce the observed Vϕ–|z| and Vϕ–R relations best among the representative models and found that model M15 can show these relations similar to the observed ones better than other models (including M16 with m2 = 0.2 and Θ = 0). Figure 20 shows the results of model M15 in which Θ = 0 and m2 = 0.1 are adopted. The observed Vϕ–|z| correlation can be better reproduced in models with low Θ (⩽30) in the present study, which is consistent with the results by Villalobos & Helmi (2008). The models with low Θ show no strong positive correlation between Vϕ and R whereas observations (Lee et al. 2011) show a rather weak correlation (ΔVϕ/ΔR = −5.6 ± 1.3 km s−1 kpc−1).

Figure 20. Dependence of Vϕ on R (upper) and |z| (lower) in the model M15 which can reproduce well the observations by Lee et al. (2011). The mean Vϕ and dispersion in Vϕ at each bin are shown by filled circles and error bars, respectively. The small dots show the results of individual thick disk particles in the model. The observed correlations from Lee et al. (2011) are shown by solid lines.
Download figure:
Standard image High-resolution imageLee et al. (2011) furthermore have revealed that the orbital eccentricities of thick disk stars at the solar neighborhood show a correlation between e and |z| (and R). If the thick disk formed before the formation of the thin disk in the Galaxy, then orbital eccentricities of the thick disk stars could be influenced by the formation processes of the thin disk. Previous simulations on the eccentricity distribution (f(e)) of the thick disk stars, however, did not consider the evolution of f(e) during the formation of the thin disk. We accordingly have investigated f(e) based on the first ∼3 Gyr orbital evolution of the simulated thick disk stars for different models (after the formation of the thin disk yet before the strong influence of the stellar bar formed in the thin disk). For the purpose of direct comparison between simulations and observations from Lee et al. (2011), the thick disk stars with 7 kpc ⩽ R ⩽ 10 kpc and 0 kpc ⩽ |z| ⩽ 2.3 kpc are selected to derive f(e) and mean orbital eccentricity (em) at a given R and |z| in each model.
Observations on em at different radial and vertical bins by Lee et al. (2011) show positive correlations of em with R and |z| (i.e., larger em for larger R and |z|). Figure 21 shows f(e) and em dependent on |z| (and R) derived in the five representative models and accordingly can be compared with observational results shown in Figures 9 and 10 by Lee et al. (2011). The standard model M1 with ep = 0.5 shows an orbital eccentricity distribution similar to the observed one (Lee et al. 2011) whereas the models with low m2 (0.05 and 0.1) and ep = 0.5 show narrower distributions with their peaks at lower e. The model M14 with m2 = 0.05 and ep = 0.8 shows a small bump at higher e (>0.8), which is not observed in Lee et al. (2011). Furthermore the dependency of em on |z| in this model M14 is qualitatively inconsistent with the observed one. The model M15 with m2 = 0.1, ep = 0.6, and Θ = 0, which can explain better the observed Vϕ–|z| relation (in Figure 20), shows a peak around e ∼ 0.15, which is slightly smaller than the observed peak around e ∼ 0.2. These results imply that the models with larger m2 (∼0.2) and lower ep (∼0.5) can better reproduce the observed f(e) in the Galactic thick disk.

Figure 21. Distributions of orbital eccentricities (f(e), top), dependence of mean orbital eccentricities (em) on R (middle), and those on |z| (bottom), for five different models: the standard M1 (blue), M2 (red), M3 (green), M14 (magenta), and M15 (cyan). The observed correlations from Lee et al. (2011) are shown by solid lines in the middle and bottom panels.
Download figure:
Standard image High-resolution imageThe standard model M1 shows a very weak positive correlation between em and R (i.e., larger em at larger R) whereas models with lower m2 show rather flat em–R relations. The observations by Lee et al. (2011) show a weak positive flat em–R relation (i.e., larger em for larger R), which appears to be more consistent with models with higher m2. These results imply that the observed em–R relation can give some constraints on m2 of minor mergers that formed the thick disk. Only the model M15 (lower Θ) clearly shows a positive correlation between em and |z| (i.e., larger em for larger |z|), which appears to be more consistent with the observation by Lee et al. (2011), though other models do not show such a correlation. This result for model M15 is consistent with those in Figure 20 which show that Vϕ is lower at lower |z|: stars with lower |z| have lower e (i.e., more circular orbits) and thus higher Vϕ. The observed em–|z| relation combined with the Vϕ–|z| relation imply that if the thick disk was formed by minor merging, then the orbital inclination angle (Θ) of merging dwarf disks should be low. Thus the observed f(e), em–|R| correlation, and em–|z| can give some constraints on the present formation model of the Galactic thick disk.
4.5. Vertical Metallicity Gradient in the Thick Disk
Recently Allende Prieto et al. (2006) have revealed that there is no vertical metallicity gradient discernible in the thick disk between 1 kpc < z < 3 kpc. Karataş & Klement (2011) did not find a clear vertical abundance ([M/H]) gradient in the thick disk either. Although there are only a few observational studies which investigate the vertical metallicity gradient of the thick disk stars, the observed gradient can be used for distinguishing between different theoretical models for the thick disk formation. We accordingly have investigated the final vertical metallicity gradient of the thick disk in the standard two-component disk model based on a model for the initial vertical metallicity gradient of the FGTD. The initial metallicity of a star with r = R and a vertical distance (|z|) from the x–y (equatorial) plane of the FGTD depends also on |z| and it is assigned as follows:

where [m/H]r = R, |z| = 0 is a metallicity at r = R and |z| = 0. We adopted the slope αv ≈ −0.4 that is consistent with observations (Frogel et al. 2000). The metallicity of a star is therefore determined by Equations (2), (3), and (5) according to its positions R and |z|. It should be stressed here that Equation (5) is used only for investigating the vertical gradient shown in Figure 22: other results shown in Figures 1–21 are not based on Equation (5). During minor merging and evolution of the two-component disk, the initial vertical metallicity gradient of the FGTD can change owing to dynamical influences of minor mergers and the stellar bar.
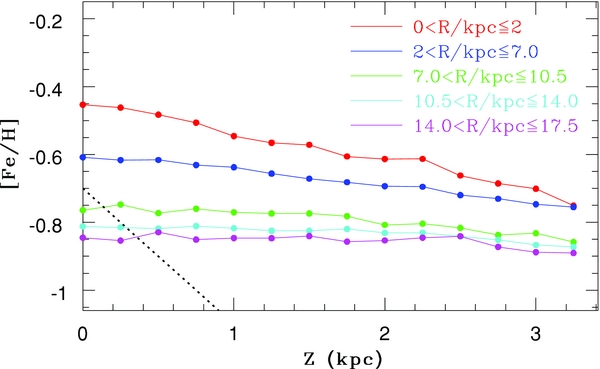
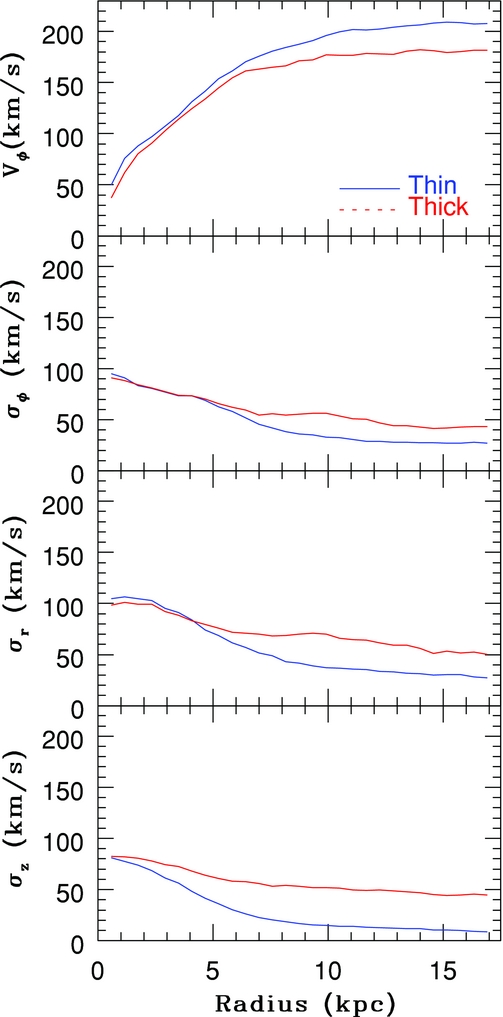
Figure 22. Vertical metallicity gradients at different radii in the standard model: at 0 kpc < R ⩽ 2 kpc (red), 2 kpc < R ⩽ 7.0 kpc (blue), 7.0 kpc < R ⩽ 10.5 kpc (green), 10.5 kpc < R ⩽ 14 kpc (cyan), and 14.0 kpc < R ⩽ 17.5 kpc (magenta). For comparison, the original vertical metallicity gradient of the FGTD at R = 8.5 kpc is shown by a thick dotted line.
Download figure:
Standard image High-resolution image
Figure 22 shows vertical metallicity gradients of the thick disk at different radii (R) at T = 2.8 Gyr in the standard model. It is clear that irrespective of R, the original steep gradients can be significantly flattened. This is mainly because minor merging can cause vertical heating of the initially thin disk (the FGTD) and thus mixing of stellar populations with initially different metallicities. The vertical metallicity gradient at the solar neighborhood (7 kpc < R ⩽ 10.5 kpc) in the model shows a rather flat (or a very weakly negative) gradient, which is consistent with the above-mentioned two observations. This rather flat gradient is, however, not so consistent with observations by Ivezić et al. (2008), which show a negative vertical metallicity gradient for stars at |z| > 1 kpc. The vertical metallicity gradients are steeper in the inner regions (R < 7 kpc) of the simulated thick disk in comparison with the outer ones, because the vertical heating is more efficient in the outer part of the stellar disk. The derived rather flat vertical gradient at R > 7 kpc can be seen in other representative models of the present study. Given that observational studies have not yet extensively investigated the vertical metallicity gradient of the thick disk, it would be fair for us to claim that if future observations confirm the lack of a strongly negative vertical metallicity gradient in the thick disk, then the present minor merger scenario of the thick disk formation is supported.
5. CONCLUSIONS
We have investigated chemical and dynamical properties of the Galactic thick disk formed by ancient minor merging based on the results of N-body numerical simulations and chemical evolution models. In the present minor merger scenario, dynamical evolution of the thick disk can be influenced by the mass growth and non-axisymmetric structures of the thin disk whereas the early star formation history and chemical evolution of the thin disk can be influenced both by gas left behind from the thick disk formation (i.e., the FGTD) and by dynamical properties of the thick disk. The main results are summarized as follows.
- 1.Minor merging can cause radial mixing of stars with different metallicities so that more metal-rich stars initially in the inner part of the FGTD can be transported into the outer region. As a result of this, the thick disk formed by minor merging can have stars with [Fe/H] ∼−0.3 at R = 0.5 Rd (corresponding roughly to R = R☉) and those with [Fe/H] ≈−0.7 at R = Rd just after merging, even if such metal-rich stars do not exist there initially. Therefore the mean metallicities in the outer regions (R > 0.5 Rd) of the disk can increase significantly owing to this mixing. This radial mixing of different stellar populations during minor merging is more effective in mergers with larger m2. Thus the presence of more metal-rich stars in the outer part of the Galactic thick disk can be possible evidence for ancient minor mergers occurring in the early dynamical history of the Galaxy.
- 2.As a result of radial mixing of stars during minor merging, the original metallicity gradient of the FGTD can become significantly flattened in the final thick disk. Although the final radial metallicity gradients of the simulated thick disks depend on model parameters of the original metallicity gradients, the present models do not show the very flat radial metallicity gradient that was derived in some previous observations. The simulated metallicity gradients are more flattened in the outer part (R > 0.5 Rd) for most models in the present study. Radial mixing can also cause the differences in MDFs between different regions of the thick disks.
- 3.The pre-existing thick disk can be strongly influenced by the growth processes of the thin disk, in particular, by the formation of a stellar bar in the thin disk. The thick disk can be transformed into a "barred thick disk" with position angle and bar length similar to those of the stellar bar in the thin disk. Given that the formation of the barred thick disk can be seen in most models of the present study, we suggest that the bar formation in the thick disk is highly likely if the thick disk was formed prior to the thin disk formation. In some models, the inner part of the thick disk can be vertically expanded due to the dynamical interaction with the thin disk. The barred thick disk cannot be formed in models with lower masses of the thin disks (Md, n ≈ 1010 M☉) owing to the absence of the strong stellar bars in the thin disks.
- 4.The final structural and kinematical properties of the thick disk after the formation of the thin disk depend largely on m2. Although minor mergers with m2 = 0.2 can explain better the observed differences in Vϕ, σr, σϕ, and σz between the thin and thick disks at least qualitatively, the simulated σz at R = R☉ can be slightly larger than the observed one. Most models with smaller m2 (=0.05) are difficult to explain so well the observed difference in Vϕ at R = R☉ between the thin and thick disks. The observed kinematical differences between the thin and thick disks can give some constraints on physical parameters of minor merging, if the thick disk was indeed formed by minor merging.
- 5.The final thick disks in most models do not clearly show positive correlations between Vϕ and [Fe/H] at 8 kpc ⩽ R ⩽ 9 kpc (i.e., R ∼ R☉) and 1 kpc ⩽ |z| ⩽ 3 kpc. The models with steeper metallicity gradients with αd ∼ −0.08 for the FGTD can, however, show a weak yet positive Vϕ–[Fe/H] correlation. Some observations clearly show a positive Vϕ–[Fe/H] correlation (i.e., higher Vϕ for more metal-rich stars), which suggests that the observed Vϕ–[Fe/H] correlation can give strong constraints on the present minor merger model, in particular, the radial metallicity gradient of the FGTD. However, it would be possible that the stars used for observational derivation of the Vϕ–[Fe/H] relation include thin disk stars which formed later in the Galactic disk.
- 6.The present numerical studies have confirmed that only models with lower Θ (⩽30) can reproduce the observed Vϕ–|z| correlation in the Galactic thick disk. The simulated Vϕ–R relations in most models are rather flat whereas the latest observations show a very weakly negative correlation between Vϕ and R (smaller Vϕ for larger R) for the thick disk. This implies that the present minor merger model needs to improve in terms of reproducing the observed Vϕ–R correlation. Accordingly the observed Vϕ–|z| and Vϕ–R correlations can be used for determining model parameters that are the most reasonable for the thick disk formation.
- 7.The simulated orbital eccentricity distribution (f(e)) of the thick disk stars in the solar neighborhood is in good agreement with the observations for the models with higher m2 (∼0.2) and lower ep (∼ 0.5). The models with higher ep show bumps at higher e (>0.8) in the simulated f(e), which is inconsistent with observations. The observed mean orbital eccentricities (em) of the thick disk stars dependent on R can be reproduced by some models in the present study. Although the latest observations have revealed a positive em–|z| correlation (larger em for higher |z|) in the Galactic thick disk, only some models with low Θ can clearly show such a positive correlation in the present study.
- 8.The star formation timescale of the FGTD needs to be ∼1.5 Gyr so that the observed MDF and the [Mg/Fe]–[Fe/H] relation of the thick disk can be simultaneously explained. Our one-zone chemical evolution models cannot explain the observed metal-rich stars with [Fe/H] >0 and [Mg/Fe] >0 at R = R☉ owing to the model assumption that no radial mixing can occur. As suggested by the present N-body simulations, the observed metal-rich stars in the thick disks at R = R☉ can be transferred from the inner regions of the FGTD with the higher metallicity owing to radial mixing during minor merging.
- 9.The chemical evolution of the thin disk depends on how star formation proceeds from the infalling halo gas mixed with the remaining gas left behind from the formation of the thick disk. If the remaining gas of the thick disk can be used for star formation in the thin disk at the early stage of the thin disk evolution, then the new stars can have high [Fe/H] (∼0) and low [α/Fe] (∼0.1). Alternatively, if the remaining gas of the thick disk is expelled from the disk region through galactic wind (e.g., due to starbursts triggered by minor merging), the first stars of the thin disk have lower [Fe/H] and higher [Mg/Fe]. Such delayed star formation would be also possible if the remaining gas of the thick disk cannot be converted into stars until enough halo gas can be accreted onto the disk to effectively dilute the remaining gas of the thick disk. Although the details of the evolution of the thin disk on the [Mg/Fe]–[Fe/H] plane depend on how the remaining gas of the thick disk mixes with the infalling halo gas, the present chemical evolution models can reproduce reasonably well the observed MDF and [Mg/Fe]–[Fe/H] relation of the thin disk in a self-consistent manner.
- 10.Our chemical and dynamical models suggest that the co-evolution of the Galactic thin and thick disks is quite important for better understanding the origin of the two distinctive Galactic disks. As demonstrated by extensive comparison between the observed and simulated properties of the thick disk, the observed correlations between Vϕ, R, |z|, and [Fe/H] of the thick disk stars can give strong constraints on model parameters in the formation scenarios of the thick disk. The present study did not extensively discuss the physical properties of the thin disk and the bulge of the Galaxy. We therefore plan to explore a theoretical model that can reproduce physical properties of the thin and thick disks and the bulge fully self-consistently in our forthcoming papers.
We are grateful to the referee, Timothy Beers, for his constructive and useful comments that improved this paper. We are grateful also to Jonathan Diaz, who reviewed this paper and gave us scientific comments and English corrections. K.B. acknowledges the financial support of the Australian Research Council throughout the course of this work.
APPENDIX: POSSIBLE SUPPRESSION OF STAR FORMATION IN THE EARLY EVOLUTION PHASE OF THE THIN DISK BY THE THICK DISK?
Although the temporal truncation model for the chemical evolution of the Galactic thin disk has provided some explanations for the origin of the observed [Mg/Fe]–[Fe/H] relation of the thin disk, it did not show how the early star formation of the thin disk can be truncated until the gas metallicity of the thin disk becomes as low as [Fe/H] ∼−0.7. Accordingly the temporal truncation model needs to explain why such severe suppression of star formation could occur in the early formation history of the thin disk. One of possible physical reasons for the suppression of star formation in the thin disk is a higher Toomre's Q parameter of the thin disk due to the higher stellar velocity dispersion of the thick disk. Wang & Silk (1994) proposed that one of important parameters for galactic star formation in the two-component disk composed of gas and stars is the effective Q parameter (Qe), which is defined as Q−1e = Qs−1 + Q−1g, where Q−1s and Q−1g are the stellar and gaseous Q parameters, respectively. Given that the radial velocity dispersion of the thick disk can be a factor of ∼2 higher than that of the initial FGTD depending on m2 (thus Qs becomes larger than ∼3), the two-component Galactic disk just after the thick disk formation might well have a higher Qe.
If we adopt Qs = 3 and if we assume that star formation in the thin disk can happen for Qe < 1, then Qg needs to be less than 1.5. Therefore, it is possible that star formation in the thin disk cannot efficiently occur until Qg becomes as low as 1.5 owing to the increase of the surface gas density (and/or the decrease of the gaseous velocity dispersion). The possible higher Qe in the early stage of the thin disk formation therefore would be responsible for severe suppression of star formation in the thick disk for the minor merger scenario. If all of the remaining gas were expelled from the thick disk after the minor merger owing to energetic stellar winds associated with a triggered starburst, then new stars in the thin disk can be formed purely from gas accreted onto the disk from the Galactic halo. If this is the case, then there is no chemical connection between the thin and thick disks, and the above severe suppression of star formation in the thin disk does not need to be considered in the minor merger scenario.