


ABSTRACT
The first core is a hydrostatic object which is formed just before the stellar core formation and is one of the most important objects needed to understand the star formation process. However, it has not been observed yet. In this paper, we studied observational characteristics of the first core through radiative transfer calculation. We adopted the rotating first core model from the results of three-dimensional hydrodynamical simulations with a barotropic equation of state. The rotating first core has a radius of ∼10 AU, a thickness of ∼1 AU, and a mass of ∼0.1–0.01M☉. The first core is covered with a thin (∼0.001 AU) accretion shock layer and radiates mainly in the mid-infrared (mid-IR; a few μm <λ < 50 μm). However, most mid-IR radiations are absorbed by the infalling envelope and this heating forms a 10 AU scale warm region (20–50 K) above the first core. As a result, the rotating first core is observed as an object that has cold spectral energy distribution (SED; the radiation of 12 μm or 24 μm is much darker than that of 70 μm) and low luminosity (∼0.1–0.01 L☉). The peak of SED corresponds to the blackbody radiation of 20–30 K. The first core increases the luminosity and temperature gradually. We show that it is possible to identify the rotating first core with the ALMA in full operation phase. In the face-on view, the dust thermal emissions from the first core are characterized by a central bright core with a radius of a few AU and a low surface brightness disk of 10–20 AU scale, in which a weak spiral structure is seen with a 0 01 resolution if the object is in a nearby star-forming region with a distance of d = 150 pc. Another way to identify this object is to detect submillimeter OH lines from the shocked layer.
Export citation and abstract BibTeX RIS
1. INTRODUCTION
A great deal of research has been devoted to clarifying the star formation process. In recent years, a number of surveys of starless molecular cloud cores have attempted to find very low luminosity objects (VeLLOs) to observe the moment of star formation directly. One of the main aims of these observations was to identify "the first core," the first hydrostatic object in the dynamic contraction of molecular gas. However, there is no firm identification of the first core observationally, and the first core has not been discovered yet.
The existence of the first core was first predicted in theoretical work concerning star formation which is studied with the spherically symmetric (radiative) hydrodynamical simulations of cloud collapse (e.g., Larson 1969; Masunaga et al. 1998; Masunaga & Inutsuka 2000). According to these simulations, molecular cloud cores collapse isothermally because the radiative cooling timescale is much shorter than the compression heating timescale (see also Hayashi 1966). However, when the central gas density exceeds ρ ≳ 10−13 g cm-3, the radiative cooling is no longer able to effectively compensate for the compression heating, and the gas begins to behave like an adiabatic gas. This adiabatic gas forms a first hydrostatic object at the center with a radius of ∼ a few AU and a mass of ∼0.02 M☉. After several hundred years, this first core begins to collapse and forms a stellar core.
In order to identify the first core, it is necessary to know the observational characteristics of the object. Masunaga et al. (1998) showed the spectral energy distribution (SED) of the first core from their radiative hydrodynamical simulation. It is characterized by very low luminosity (≲0.1 L☉) and low bolometric temperature (∼10 K) without any other characteristic features. Omukai (2007) estimated the H2O line emissions expected from a shocked layer around the first core by assuming isothermal similarity solutions and showed that most of the emissions are absorbed in the envelope.
Note that these characteristics are obtained by assuming spherical collapse of the cloud core. However, many authors showed that rotational motion changes the collapse of the molecular cloud core and the structure of the formed first core (e.g., Bonnell 1994; Bate 1998; Matsumoto & Hanawa 2003). Saigo & Tomisaka (2006) and Saigo et al. (2008, hereafter Paper I) showed that cloud cores with the angular speed of Ω>0.05 rad Myr−1 must form a centrifugally supported first core (disk) and it has a completely different structure and thus evolutionary path from the spherical core. According to Goodman et al. (1993) and Caselli et al. (2002), even the slowest rotating cloud core has the angular velocity of Ω ∼ 0.6 rad Myr−1. Thus, almost all the first cores are (centrifugally supported) rotating first cores. Typically, a rotating first core has a radius of ∼20 AU and a mass of 0.1–0.01M☉. These are several times larger than those of the spherical ones. Furthermore, the structure of the infalling envelope also changes with rotation. In order to identify the first core, we should investigate the observational characteristics of this rotating first core.
In this paper, we study the radiations expected from the rotating first core by using radiative transfer for the dust thermal radiation to create a template to find the object. We use the numerical results obtained with three-dimensional hydrodynamical calculations from Paper I to calculate the radiation. In Section 2, we describe our method of obtaining the radiation and temperature structure. Section 3 is for the numerical result in which the temperature structure, intensity distribution, and SED are shown both for rotating and non-rotating models. The difference between them is also illuminated in this section. Section 4 is devoted to discussion on the observability.
2. MODELS AND NUMERICAL METHOD
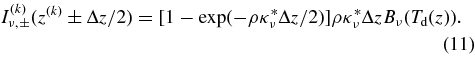
2.1. Model of the Rotating First Core
We assumed a density and velocity structure of a rotating first core from three-dimensional hydrodynamical simulations. We calculated the collapse of uniformly rotating Bonnor–Ebert spheres (Ebert 1955; Bonnor 1956) with the central density of ρc0 = 10−19 g cm−3 for various initial rotating speeds and calculated the formation and evolution of the first cores using a nested grid hydro code (see also Matsumoto & Hanawa 2003) by assuming a barotropic equation of state. Here, we take a model in which the rotating first core has an initial rotation speed of Ωc0 = 0.05/tff, where tff denotes the free-fall time of (32π/3Gρc0)1/2 (CL050 model in Paper I). Figures 1(a), (b), and (c) show the density and velocity distributions of the rotating first core at three epochs: the early stage of t = 712 yr (stage A), middle stage of t = 1343 yr (stage B), and latest stage of t = 2765 yr (stage C). We defined t = 0 as the formation time of the first core. The thick red dashed curves are outer boundaries of the first core. Here, we defined the first core as an equilibrium region whose infall speed is less than the local sound speed.2 The first core is made of adiabatic gas with ρ>1 × 10⁻¹³ g cm−3 and is surrounded by a shock wave formed by mass accretion from the isothermal infalling envelope. The central densities of these snapshots are ρc0 = 1.5 × 10⁻¹⁰ g cm−3, 3.4 × 10⁻⁹ g cm−3, and 3.2 × 10⁻⁹ g cm−3, respectively. The central density at stage C, 3.2 × 10⁻⁸ g cm−3, is close to the critical density at which hydrogen molecules begin to dissociate into atoms.

Figure 1. Density and velocity distributions of the rotating and non-rotating first cores. Panels (a), (b), and (c) show the rotating first core at t = 711, 1343, and 2763 yr, respectively. In (d), we show the non-rotating first core with the same central density as (c). Each upper and lower panel represents the cross-cuts of the x–z plane of y = 0 and the equatorial plane of z = 0, respectively. The arrows denote the velocity vector in the plane. The time after the first core is formed, t, is shown in the upper left corner. Thick red dashed curves denote the boundary of the first core. Numbers and boxes overlaid on the density distributions indicate the nesting level of our grid code (see Paper I).
Download figure:
Standard image High-resolution imageFigure 1(d) shows a snapshot of the non-rotating first core with the same central density as panel (c). The non-rotating first core is supported only by the thermal force. The observational characteristics of the non-rotating first core have been studied by some pioneers in detail (Larson 1969; Masunaga et al. 1998). On the other hand, the rotating first core is mainly supported by centrifugal force (on the x–y plane) and forms a disk with much larger radius (see Figure 1(c)). Paper I showed that almost all the molecular cloud cores form the centrifugally supported disks with large radii (rotating first core). We investigate the observability of the rotating first core model shown in Figures 1(a), (b), and (c). This is the first result needed in order to explore the observational characteristics of the rotating first core based on the three-dimensional numerical hydro simulations.
2.2. Basic Equations
In this paper, we are interested in observational characteristics of the face-on rotating first core model. The barotropic approximation is valid in the interior of the first core which is composed of accreted gas in the early stage. However, the temperature structure near the surface of the first core is far from that anticipated by the barotropic approximation, because of the release of the kinetic energy at the shock fronts (Whitehouse & Bate 2006). To obtain more realistic radiations from the shock surface around the first core, we solve the energy equation by assuming plane-parallel radiative transfer. This assumption is justified in the rotating first core and the shock heating layer because the object is geometrically thin (thickness ≪ radius; see Figure 1) and the radiation energy flows mainly along the z-direction near the core surface. This approximation must be modified away from the first core surface to include the geometrical effects (the energy is transported radially). We show the approximation in the envelope in the following subsection.
Here, we solve the following equations only along the z-direction by assuming a locally plane-parallel geometry in each point (x, y) and obtain the temperature and radiation distributions along the z-direction. In the non-rotating case, we solve only along the r-direction by assuming a spherical geometry (see below). Basic hydrodynamic equations for the ideal gas, which is thermally coupled with the dust grain, are as follows:
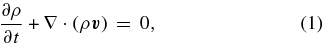

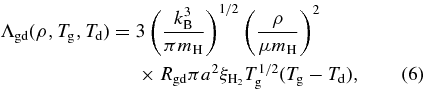
where p, ψ, Tg, Td, γad, kB, mH, μ, and Λgd(ρ, Tg, Td) denote the gas pressure, gravitational potential, gas temperature, dust temperature, specific heat ratio, Boltzmann constant of 1.3807 × 10⁻¹⁶ erg K−1, mass of hydrogen atom of mH = 1.67 × 10⁻²⁴ g, the mean molecular weight for interstellar molecular gas of μ = 2.3, and the energy exchange rate per unit volume, respectively. The energy exchange rate from gas to dust grains is given by Leung (1975) as
where Rgd, a, and  denote the dust-to-gas mass ratio of Rgd = 0.015, radius of grains of a = 1 × 10⁻⁶ cm, and the accommodation coefficient of 0.5, respectively.
We simplified the equation of energy (Equation (3)) by using Equations (1), (2), and (5). The energy equation is rewritten as
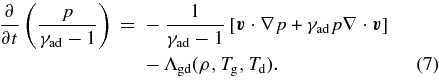
If the dust temperature Td is given, the system of energy (Equations (4), (6), and (7)) closes.
2.3. Dust Temperature
Since the heat capacity of dust is very small, the dust temperature is given by the energy balance between the gas–dust energy exchange and radiation heating and cooling as

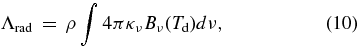
where Γrad and Λrad denote, respectively, the heating and cooling rates per unit volume, for the dust component as
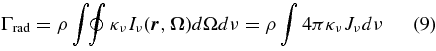
and
where κν,  , and Bν(T) denote the opacity by dust, specific intensity in the direction of solid angle Ω, and the Planck function, respectively.
Here, we use the two-stream approximation in the radiative transfer calculation (see, e.g., Rybicki & Lightman 1979). In this approximation, the radiation field is assumed to be represented with intensities in two directions with an angle of  . In this approximation, we substitute the opacity with
  . The frequency-dependent opacity was taken from Adams & Shu (1986), and we divided the frequency range 1011–1015 Hz into 50 bins. The spatial distribution of grid points for the radiation calculation is the same as those used for the hydrodynamic computation (Paper I). However, we added extra spatial grid points in the vicinity of the first core surface to resolve the thin shock heating layer. Consider the intensities originally emitted from a cell at z = z(k), propagating upward I(k)ν,+ and downward I(k)ν,−. The upward and downward intensities at the boundary of the kth cell are given considering the self-absorption in the cell as
They propagate receiving absorption at each grid point as
which is solved with the initial condition (Equation (11)) at z = z(k) ± Δz/2. After calculating I(k)ν,± for all k, the mean intensity Jν(z) at z is obtained by adding contributions from all cells,
where η(z, k) is a geometrical factor and in the case of plane-parallel propagation, η(z, k) is unity. We took
so that the mean intensity must decrease in the spherically symmetric infalling envelope. Here, zshock denotes the position of the accretion shock front. We defined zshock as the position where the velocity jump is the largest.
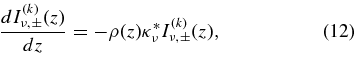
Of course, this assumption of the geometrical factor brings much uncertainty in the thermal structure of the infalling envelope that is far from the first core. However, in this paper, we justify this approximation from the following two points. First, the uncertainties from this approximation have little effect on observational characteristics of the first core. We discuss this in Section 4. Second, although this is an approximation, we show that the temperature structure is in good agreement with two extremes: the results of the diffusion approximation in the optically thick region in the infalling envelope (z ≲ 10 AU) and the results of optically thin approximation in such region z ≳ 100 AU (see Figure 2). The size of the optically thick region agrees with that of the photosphere expected by the Rosseland mean opacity.

Figure 2. Density, infall velocity, and temperature distributions of the rotating first core on the z-axis. Panels (a) and (b) show those of the rotating (stage B) and non-rotating first cores, respectively. Upper and middle panels show the density and infall velocity distributions. Bottom panels show the temperature distributions. Solid and dashed curves denote the gas and dust temperature distributions, respectively.
Download figure:
Standard image High-resolution imageWe also used the same geometrical factor, Equation (14) in the spherical case. Although η = 1 seems invalid in the spherical first core, this has little effects on the radiation from the first core. This is understood as follows: the evolution timescale of the spherical first core is much shorter than the timescale of the radiative energy transfer from the deep interior. The surface temperature depends only slightly on the mean intensity, Jν(z), calculated by Equation (13). And owing to the large opacity of the first core, I(k)ν,+, which contributes Jν at the first core surface, is restricted to those from the vicinity of the shock front. This thin geometry, ΔR/R ≪ 1, ensures the assumption of η = 1 in the spherical first core.
2.4. Numerical Method
To obtain the quasi-steady temperature distribution along the z-direction, we solved the energy Equations (6)–(8) with the radiative transfer Equations (12)–(13) for the previously obtained density and velocity fields. We integrate these equations with a 0.1 yr time step for 30 yr by using the implicit time-advance method. After 30 yr, the temperature distribution of z ≲ 100 AU is in a quasi-steady state and is independent of the initial temperature distributions. The initial guess of the temperature distribution is given by the polytropic equation of state (see Paper I). In order to accelerate the convergence to the solution at each time step, we use the diffusion approximation for a region deep inside the first core (τ>5) before applying the implicit method. We stopped the iteration after the maximum change of pressure |δp|/p in one iteration loop became less than 1 × 10⁻⁶. The CPU time per model was 1200 hr by using Xeon (3.0 GHz). We calculated four models.
3. RESULTS
3.1. Thermal Structure of the Rotating First Core
The top panels of Figures 2(a) and (b) show the density distribution along the z-axis of rotating and non-rotating models, respectively. The snapshot of the rotating model (Figure 2(a)) is stage B of t = 1343 yr (Figure 1(b)), and the non-rotating model (Figure 2(b)) has the same central density (Figure 1(d)). Regardless of the rotation or non-rotation model, the density distribution is almost the same in the infalling envelope above z ≳ 100 AU (ρ ∝ z−2). In addition, in each model, there is a dynamical accretion region that has a shallow power-law density distribution seen at z ≲ 100 AU. In this region, the gas envelope infalls nearly freely (v ∝ −z−1/2) and the density decreases with time (Shu 1977). Furthermore, the density of the dynamical accretion region decreases more rapidly for the rotation model because of its angular momentum (top panel of Figure 2(a)), and the rotating model has a nearly constant density distribution of ρ ∼ 10−14 g cm−3 at 1 AU ≲z ≲ 100 AU at stage B.
The middle panels of Figure 2 show the infall velocity along the rotational axis. The first core accretes mass from the infalling envelope through a strong shock wave seen at z ≃ 1 AU. It should be noticed that the infall velocity of the rotation model is much larger compared with the non-rotating model. This is explained by the fact that the mass of the rotating first core is much larger than that of the non-rotation model, both of which have the same central density but different ages and thus masses. The gas and dust temperatures shown in the bottom panels of Figure 2 are obtained by solving the energy (Equations (6)–(8)) and radiation (Equations (12) and (13)) equations by assuming the kinematic structure of the rotating and non-rotating first core model, respectively. Solid and dashed curves denote the gas Tg and dust Td temperatures, respectively. The temperatures are Tg = Td ≃ 700 K at the center of z = 0. Temperatures at the first core surface for the rotation and non-rotation models are Tg ≃ 180 K and Tg ≃ 450 K, respectively. The difference seems to come from the difference of optical depth in the infalling envelope, which is much larger for non-rotating cases. The gas temperature jumps up to ≃2000 K in the thin surface shock heating layer.
The dust grain in the infalling envelope is heated by the radiation from the first core and forms a warm infalling envelope. Dotted lines denote the asymptotic behaviors predicted by the optically thick diffusion approximation and optically thin radiative equilibrium approximation (Hartmann 1998). The temperature structure in the warm infalling envelope of z ≲ 30 AU is well matched by that obtained from diffusion approximation. Furthermore, the size of the region corresponds to the photosphere expected from the Rosseland mean opacity. Thus, our result reproduces the temperature structure of the rotating first core well, although it is based on the two-stream approximation. The temperature structure in the warm infalling envelope strongly depends on the density structure. When the opacity and density are proportional to κν ∝ νm and ρ ∝ z−n, respectively, the resultant temperature distribution becomes
Here we assumed the radiative equilibrium to be ∫κν(Jν − Bν)dν = 0 for the optically thin limit and the steady diffusion energy flux,  , in the spherical symmetry, where σ and κR denote the Stefan–Boltzmann constant and the Rosseland mean opacity of κR ∝ Tm, respectively (Adams & Shu 1986). The opacity has a dependence of κν ∝ ν2 (m = 2) in the far-infrared (far-IR) and submillimeter frequency (see, e.g., Hartmann 1998). Except for the shock heating layer, gas and dust of z ≲ 100 AU are well coupled thermally. In the diffuse envelope of z ≳ 100 AU, the cooling and heating rates are too small to reach the equilibrium state within 30 yr and the gas temperature remains that of the ambient gas at 10 K.
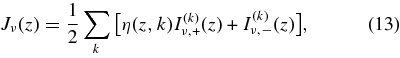
Figure 3 shows the thermal structure around the shock heated layer for the rotating first core model. Gas flows from right to left in this panel. The gas temperature jumps up to the shock temperature expected from the Rankine–Hugoniot relation,3 Tg ≃ 2000 K. Then it cools down rapidly due to the energy loss caused by the collision with dust grains with a cooling rate of Λgd ∝ T1/2g(Tg − Td). The cooling timescale of the gas is as short as ∼1 hr just after the shock front. The dust grains can radiate the excess energy away quickly and the dust temperature rises only up to 200 K in the post-shock layer. It should be noted that the thickness of the shock heated layer is 1/1000 times smaller than that of the global size of the first core.

Figure 3. Close-up view in the vicinity of the shock heating layer of the rotating first core (Figure 2(a)). Solid and dashed curves denote the gas and dust temperatures, respectively. Crosses denote the grid point for the calculation of the energy equations and radiative transfer.
Download figure:
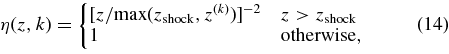
Standard image High-resolution imageIn order to obtain three-dimensional thermal structures, we divided the rotating first core disk into cells whose sizes (Δx, Δy) are equal to (1 AU, 1 AU) on the x–y plane, and solved the energy and radiative transfer equations along the z-direction at each cell. Figure 4 shows the distribution of the gas temperature for the rotating first core. The bottom panel shows the temperature on the equatorial plane of z = 0. The figure shows the rotating first core which consists of a central high-temperature core and an outer low-temperature disk which indicates a spiral structure. The spiral pattern traces the minima of the gravitational potential which was originally caused by the gravitational instability of the disk. The gas in the dip is heated by compression. On the other hand, the upper panel shows the temperature distribution on the x–z plane (y = 0). We can see the shock heating layer as a hot thin gas layer at z ∼ 0.5–4 AU. Thus, the first core is surrounded by the shock layer. Radiation from the first core heats the gas in the infalling envelope and a warm infalling envelope extends above the rotating first core disk. The gas temperature in the infalling envelope is as high as ∼100 K just above the central high-temperature core but decreases to ∼30 K above the outer spiral disk. The striped pattern seen in the upper panel seems affected by the assumption that the radiation energy flows only in the z-direction.

Figure 4. Distribution of the gas temperature of the rotating first core. Upper and lower panels show the cross section of the x–z plane at y = 0 and the equatorial plane at z = 0, respectively. The central cross indicates the position of the center of mass.
Download figure:
Standard image High-resolution image3.2. Face-on Images of the Rotating First Core
Figure 5 shows face-on images of the first core observed in various frequencies at the three evolutionary stages. Figure 5(a) in the first row shows the images for the rotating first core at the early stage A (t = 711 yr). The first core can be roughly approximated by a rigidly rotating spheroid with a uniform density of ≃1.5 × 10⁻¹⁰ g cm−3 with a mass of only 0.02 M☉ (see Figure 1(a)). Observational frequency ranges from ν = 3 × 10¹¹ Hz (λ = 1000 μm) to ν = 6 × 10¹² Hz (λ = 50 μm). Here, the distance to the first core is assumed to be d = 150 pc which is the distance to nearby low-mass star-forming regions such as the Taurus molecular cloud. The images are convolved assuming a 002 beam size (white circle at the lower left).4 The rotating first core is brightest around the frequency of ν ≃ 9 × 10¹¹ Hz. The radiation comes from the entire disk with a radius of 7 AU and brightness of Fν∼ a few ×10−3 Jy beam−1. Figure 5 also shows that the first core is the brightest around 2 × 10¹² Hz. The brightness of the first core decreases rapidly for a higher frequency of ν>2 × 10¹² Hz and the first core is not observable at 6 × 10¹² Hz. However, 2 THz and 6 THz have been taken to be the observable frequencies of ALMA. Therefore, we are expecting the observation of the first core with ALMA in the 300–900 GHz band. ALMA, especially, will have the ability to obtain a disk image with enough spatial resolution in the future (full operation phase).

Figure 5. Simulated face-on images of the rotating first core. We assume that the disk is face-on to the observer at a distance of d = 150 pc. The scale of brightness is common to all three stages and is shown in the upper right of this figure. Each panel has size 40 AU × 40 AU (=0266 × 0266). All the images are convolved with a point-spread function (PSF) of 3 AU (=002) from the calculation with 1 AU×1 AU grid. White circles denote the sizes of the PSF.
Download figure:
Standard image High-resolution imageSoon after that, the first core becomes unstable against the non-axisymmetric rotation instability driven by the mass and angular momentum accretion, and forms spiral arms. Gravitational torque by the non-axisymmetric structure transfers angular momentum outwardly in the disk and also transfers matter inwardly to the inner regions. As shown in Figures 1(b) and (c), the first core forms a central high-density core and a large centrifugally supported disk. Stage B (t = 1343 yr) is an example of this middle evolution phase. The mass and central density of the first core are 0.04 M☉ and 3.4 × 10⁻⁹ g cm−3, respectively. The energy flux is concentrated in the central region. Figure 5(b) in the middle row shows the face-on images during stage B (t = 1343 yr). Brightness in the central region rises to Fν ∼ 10−2 Jy beam−1. The radius of the low-brightness disk with Fν ≳ 10−3 Jy beam−1 extends to r ≃ 10 AU and weak spiral structures are traced in Figure 5(b).
Stage C (t = 2765 yr) is an example of the late evolution phase. The central density reaches 3.2 × 10⁻⁸ g cm−3, which almost corresponds to the H2 dissociation density of 5.6 × 10⁻⁸ g cm−3. The total mass of the first core is 0.076 M☉. Figure 5(c) in the bottom row shows the face-on images during stage C (t = 2763 yr). The first core disk with Fν > 10−3 Jy beam−1 extends to r ≃ 15 AU. However, more than half of the energy comes from the central region within the radius r ≲ 3 AU. The peak frequency moves to a higher frequency with evolution, ν ≃ 2 × 10¹² Hz. This is caused partly by the increase in the intrinsic radiation temperature of the first core and partly by the decrease in the column density in the envelope. Thus, according to the evolution, the brightness of the central region (with the radius of a few AU) rises, and the radius of the low-brightness disk expands. In all the evolution stages, the face-on first core must be detected sufficiently strongly with Fν ∼ 10−2 Jy beam−1 in the far-IR wavelength. However, the radiation luminosity of the core falls rapidly due to the absorption in the infalling envelope for ν>2 × 10¹² Hz.
Both the increase in luminosity and the concentration of the flux toward the center are caused by the change in the distribution of the gravitational potential. In the centrifugally supported first core, the angular momentum is transported by the gravitational torque to the outer region and the gas falls into the central region during the evolution. Although the half-mass radius of the first core is ≃4 AU at stage B, it shrinks to ≃3 AU at stage C.
3.3. Evolution of SED for the Rotating First Core
Solid curves in Figure 6 show the SED expected for the face-on view of the rotating first core at the three evolution stages A, B, and C (see Figure 5). This SED is made by integration of radiation in the 40 AU × 40 AU box including the first core. At the early stage A (t = 711 yr), the SED has a peak of λFλ ≃ 3 × 10⁻¹²(d/150 pc)−2 erg s-1 cm−2 at λ ≃ 200 μm. This SED is quite similar to 20 K blackbody radiation. Thus, the SED of the first core has a color temperature of 20 K. The observed luminosity is 0.0026 L☉ at this stage. The dashed curve shows the energy flux distribution measured at the first core surface. This intrinsic SED has a peak of λFλ ≃ 10−11(d/150 pc)−2 erg s-1 cm−2 at λ ≃ 200 μm. Thus, the intrinsic radiation corresponds to 50 K in color temperature. At the middle stage B (t = 1343 yr), the observed total luminosity is 0.0068 L☉ with a color temperature of 25 K and the intrinsic radiation increases up to 100 K in color temperature. At the latest stage C (t = 2763 yr), the SED peak reaches λFλ ≃ 3 × 10⁻¹¹(d/150 pc)−2 erg s-1 cm−2 at λ ≃ 80 μm. The color temperature of the observed flux corresponds to 30 K, although the intrinsic radiation has a color temperature of 350 K. At this stage, the total observed luminosity is expected to be 0.023 L☉. We also plotted the SED of L1521F-IRS (in Figure 6) which is one of the most famous objects classified as VeLLOs (Bourke et al. 2006). Bourke et al. (2006) found an outflow cavity in the Spitzer image of this object and concluded that it is in a proto-brown dwarf stage. Compared with the SED of VeLLOs, the first core is characterized by little emission flux at the wavelength shorter than 24 μm.

Figure 6. SED at three typical evolutionary stages. Solid lines correspond to observed SED at the three stages A, B, and C. Dashed lines show the λFλ measured at the surface of the first core. Squares denote the observation sample of the VeLLO, L1521F-IRS (Table 1 in Bourke et al. 2006).
Download figure:
Standard image High-resolution imageThis figure shows that, according to the increase in the intrinsic luminosity from stages A to C, the observed luminosity rises by a factor of 10 and at the same time the peak of the SED moves slightly to a shorter wavelength from 200 μm to 100 μm. These evolutions of SED expected for the first core are also explained by the dynamical evolution of the core as mentioned in the previous subsection. That is, contraction of the core raises its kinetic temperature and thus the color temperature of the intrinsic radiation from the first core. As contraction proceeds, the density of the envelope and thus its optical depth decreases. This makes the observed SED brighter and bluer.
4. DISCUSSION
4.1. Position of the Photosphere
The rotating motion of a cloud core changes not only the structure of the first core but also that of the infalling envelope. This provides very important information for the interpretation of the observation results. In Figure 7, we show the column density distribution Σ(z) = ∫∞zρ(z)dz against z. Thick solid curves show the column density for our rotating model at the three evolution stages. Breaks at zs ∼ 1 AU correspond to the accretion shock front at the first core surface. In this paper, we define the physical surface of the first core as the position of the shock wave, zs ≡ zshock. During stage B, the column density of infalling envelope is Σ ≃ 6 g cm−2. The column density of the infalling envelope decreases with time (see light blue, green, and red solid curves in Figure 7). This comes from the expansion of the shallow density distribution region or the dynamical accreting region (see Section 3.1). During stage C, the column density of the infalling envelope decreases to Σ ≃ 3 g cm-2.

Figure 7. Column density profiles along the rotation axis (z-axis) Σ(z) ≡ ∫∞zρ(z)dz. Dotted curve shows the column density of the non-rotating spherical collapsing model. Solid curves show those of the rotating model at the three stages A, B, and C.
Download figure:
Standard image High-resolution imageThe thick dotted curve shows the column density for the non-rotating spherical collapsing model with the same central density of stage B of the rotating model (see Figures 1(d) and 2(b)). The column density of this model is Σ ≃ 100 g cm−2 in the infalling envelope. This is between the two extreme models of the Larson–Penston dynamical collapsing sphere (a solid thin straight line) and the singular isothermal sphere (a long dashed line; Larson 1969; Penston 1969; Shu 1977). It is shown that the rotating envelopes have much smaller column densities than do non-rotating envelopes. The difference comes from the centrifugal force which bends the accreting flow aside, while the inflow in the non-rotating model converges at the center.
The density distribution in the envelope greatly affects the radiation of the first core and interpretation of the observation. In Figure 8, the position of the photosphere observed from outside of the cloud core is plotted as a function of observed wavelength. We defined the photosphere as a surface where the optical depth from the outside of the cloud core reaches unity. The figure shows that in the non-rotating model only mm-wave λ ≳ 1000 μm photons can penetrate the envelope and can observe the first core surface (zs ∼ 1 AU). In the rotating model, small column density leads to thinner optical depth. We are able to observe the first core surface directly in submillimeter wavelength λ ≳ 100 μm, while we can see the envelope around z ∼ 10–1000 AU in the IR wavelengths λ ≲ 100 μm. As the column density decreases in the envelope from stages A to C, the optical depth for the first core decreases with time.

Figure 8. Position of the photosphere at each stage plotted against the wavelength of the radiation. The thick black curve corresponds to the non-rotating first core shown in Figure 1(d). Cross symbols on it denote the wavelength bins of our calculation. This shows clearly that the surface of the first core can be seen for far-IR and submillimeter wavelength of λ>100 μm in the rotating case.
Download figure:
Standard image High-resolution image4.2. Observational Possibility and Identification of the First Core
The lifetime of the rotating first cores is 1000–3000 yr (Saigo et al. 2008). It is much longer than that expected for the non-rotating one, several 100 yr (Masunaga & Inutsuka 2000). It is because the centrifugal force supports the gravitational contraction although the evolution of first core is driven by the gravitational contraction. In the case of the rotating first core, the lifetime is given by the timescale of transportation of angular momentum (Saigo et al. 2008). On the other hand, the lifetime of the starless cloud core with central density of nc = 105 cm−3 is ∼4 × 10⁵ yr (Onishi et al. 2002). Statistically, we can expect that there is one rotating first core for 100 such starless cores, and we can expect a few rotating first cores within the distance of d ∼ 150 pc. From Section 3.3, the candidates for the first core must have a very low luminosity (∼0.1–0.01 L☉) and a very cold SED (color temperature = a few 10 K). VeLLOs and starless cores are good candidates to search for the first core (e.g., Evans et al. 2003; Dunham et al. 2008; Onishi et al. 1998). We propose additional criteria for the first core: that the radiation at 24 μm is much darker than that of 70 μm, and there are no IR counterparts in λ < 10 μm.
The most serious problem in finding the first core is how to identify it. Figure 7 shows that identification based only on SED is not efficient, because the expected SEDs for the first core are featureless and very similar to that of the gas clump with T ∼ 15–40 K. How about the imaging radio interferometric observation with ALMA? It seems that the simplest way is to take an image at submillimeter wavelength with high spatial resolution and sufficient sensitivity. According to Figure 5, in order to identify the characteristic structures of the rotating first core, it is necessary to observe in the submillimeter wavelength of 150 μm (2 THz) to 500 μm (600 GHz), with the spatial resolution of <001 (< AU scale), and with the sensitivity of <1 mJy beam−1. The 10σ sensitivity of 1 mJy beam−1 even for the maximum baseline can be achieved in only 5.7 hr integration by using the ALMA in the full operation phase at 900 GHz after the Band 10 receivers5 are installed.
Next, we consider another method to identify the first core using emission lines. Stahler et al. (1980) showed that accretion shock layers emit considerable radiation energy. Omukai (2007) estimated the radiation energy of continuum and line emissions from the accreting shocked layer by assuming spherical collapse with the density of n ∼ 1010–1011 cm−3 and the infall speed of vr = a few km s-1. He showed that 10% of the radiation energies of the first core are emitted by H2O rotational lines. Table 2 of Omukai (2007) shows that an  line at λ = 539 μm (556 GHz) has a luminosity of L ≃ 4.9 × 10⁻⁹ L☉ after the envelope absorption is processed for his LP05 model. It is equivalent to the energy flux of ∫lineFνdν ≃ 7.0 × 10⁻¹⁸ erg s-1 cm−2(d/150 pc)−2, if the distance of the object is assumed equal to d = 150 pc. If we assume that the line width, νwidth, is caused by the velocity width in the shock heating layer of vwidth ≃ 7 km s−1, the average flux density of the line
  becomes 54 mJy. However, the absorption by water vapor in the Earth's atmosphere prohibits the observation of H2O lines in the submillimeter range from the ground. He concluded that observation by space telescope is necessary to observe such lines.6 At present, the Herschel Space Observatory and SOFIA (The Stratospheric Observatory for Infrared Astronomy) are the most suitable observational facilities for detecting such
  rotational lines.
This is very helpful in searching for appropriate lines to observe. Here, we re-estimate the luminosity for our rotating models. As shown in Section 4.1, the emission line from the surface shocked layer suffers a negligible absorption by the infalling envelope in wavelengths longer than 100 μm (frequency lower than 3 THz). And the infall velocity of the rotating first core is several times more than the spherical non-rotating case, which seems to boost the line luminosities. In the following, we estimate the average flux density  of emission lines of OH and CO at λ>100 μm. Neufeld & Hollenbach (1994) have shown that the line strength ratio of OH to H2O is ∼1/10 for the density of n ∼ 1010.5 cm−3 and the shock velocity of vr = a few km s-1. So, the energy flux density of an OH line at 317 GHz is expected as ∼ 9.4 mJy (d/150 pc)−2(vwidth/7 km s-1)−1. This estimation is based on the result of the spherical collapse model by Omukai (2007) as a reference. Since the infall velocity of the rotating model is two or three times larger than the spherical model (see Figure 2), the radiation energy of the OH line increases by a factor of 100 or more owing to the increase in shock speed (Figure 9 of Neufeld & Hollenbach 1994). Finally, the OH line from the rotating first core object is estimated to be ∼1 Jy (d/150 pc)−2(vwidth/7 km s-1)−1. In this case, this OH emission line is observable by using ALMA with the velocity resolution of 0.1 km s−1. From a similar estimation, we also conclude that the vibration lines of CO are observable by ALMA, although it is necessary to do a quantitative estimation for the rotating model.
Next, we estimate the absorption in the envelope for line emissions. The rotating first core has a column density of Σ ∼ 3 g cm−2 in the envelope (Figure 7). Optical depth, τ, in the envelope is estimated as
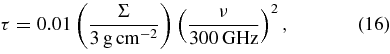
which attains τ = 0.3 in the non-rotating model (Figure 7). Thus, absorption in the envelope does not play a role at ν = 300 GHz even in the non-rotating model. On the other hand, the optical depths of the rotating and non-rotating models are estimated at 0.1 and 3 at ν = 900 GHz, respectively. The absorption in the non-rotating envelope is significant at ν = 900 GHz. In conclusion, it is shown that the rotating first core is much brighter than the non-rotating one even in the line emission at the ALMA band 9–10 and THz frequency (e.g., Herschel Space Observatory).
4.3. What Happens After the First Core Phase?
Finally, we discuss the evolution and observational characteristics of this system after the first core phase. Saigo et al. (2008) proposed the scenario of the rotating first core evolution during the second collapse phase and following the main accretion phase.
- 1.The rotating first core forms the central high-density core that is supported by the pressure gradient (r ≲ 2 AU region of Figure 1(b) and r ≲ 1 AU region of Figure 1(c)). The high-density core increases its mass and density. The mass supply from the outer disk is caused by the angular momentum transfer in the first core.
- 2.Density in the core exceeds the critical value of hydrogen dissociation. The high-density core begins to collapse due to gravitational instability (the so-called second collapse). The timescale of the collapse is about several months.
- 3.The stellar core/disk is formed at the center. The main body of the centrifugally supported first core with the radius of 10–20 AU remains after stellar core/disk formation. Here, we call the first core after stellar core formation the "adiabatic torus." The stellar core/disk accretes mass via the centrifugally supported adiabatic torus. This mass accretion seems to be controlled by the angular momentum transfer in the adiabatic torus.
The radius and mass of the region that fell into the stellar core/disk is only ∼ 1 AU and several 0.001 M☉ (Saigo et al. 2008). Thus, most regions and mass of the first core were left as the adiabatic torus. Saigo et al. (2008) show that the luminosity of the stellar core/disk jumps to ∼1 L☉ soon after the second collapse. Such a large luminosity is caused by a prompt release of the gravitational energy. Thanks to the large luminosity, we can easily distinguish them. It may be possible to distinguish such objects using jets which are believed to be a good indicator of protostars. Machida et al. (2008) show that the protostellar core drives the high velocity and collimated jet with a velocity of ∼ 30 km s−1 (Tomisaka 2002). However, the luminosity and jet activity of this phase depend greatly on the mass accretion rate. The adiabatic torus must be an important object which controls the early main accretion phase.
5. SUMMARY
We studied observational characteristics of the first core through radiative transfer calculation. We adopted the rotating first core model from the results of three-dimensional hydrodynamical simulations with a barotropic equation of state (Saigo et al. 2008). Our results and conclusions are as follows.
- 1.The rotating first core is covered with thin (∼0.001 AU) accretion shock layers. The intrinsic color temperature of the rotating first core is in the range of 50–250 K and radiates mainly in mid-IR. However, most mid-IR radiation is absorbed by the infalling envelope and forms a 10 AU scale warm region (several 10 K) above the first core.
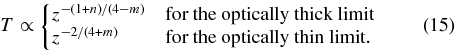
- 2.The rotating first core must be observed as an object characterized by cold SED (color temperature of 20–30 K) and very low luminosity of ∼0.1–0.01 L☉. The radiation of 12 μm or 24 μm is much darker than that of 70 μm. The luminosity and color temperature increase gradually during the first core phase.
- 3.There are two characteristic structures in the submillimeter image of the rotating first core. It has a central bright core with a few AU scale and has a low surface brightness disk with 10–20 AU scale. The low surface brightness disk has weak spiral structures. If we observe nearby star-forming regions (d = 150 pc), we can spatially resolve those features by ∼001 resolution.
- 4.In the case of the rotating first core, we can observe the surface shock layers directly in submillimeter wavelength λ ≳ 100 μm, while the layers are obscured by the envelope around z ∼ 10–1000 AU for λ ≲ 100 μm. In the case of the non-rotating first core, even the submillimeter radio wavelengths λ ≲ 800 μm are heavily obscured by the thick envelope.
- 5.H2O and OH lines in the far-IR and submillimeter are one of the main coolants of the surface shock layer and characterize the first core. However, emission lines in far-IR (λ ≲ 100 μm) are absorbed by dust in the infalling envelope, and H2O lines are completely absorbed by water vapor in the Earth's atmosphere. The strength of OH lines in the submillimeter wavelength is sufficient for observation by ALMA.
We are grateful to T. Matsumoto and T. Hanawa who helped our hydrodynamical calculations through their offers of code and data. We also thank S. Inutsuka, R. B. Larson, Y. Li, M.-M. MacLow, J. Oishi, and K. Omukai for valuable discussion and comments. Finally, we wish to give special thanks to the referee for fruitful comments and suggestions. Numerical calculations and data analysis were carried out with Fujitsu VPP5000 at the Center for Computational Astrophysics, National Astronomical Observatory of Japan. This research was supported in part by Grants-in-Aid for Scientific Research from MEXT, Japan (21244021 and 17340059 [K.T.]).
Footnotes
- 2
The first core was only defined as ρ>1 × 10⁻¹³ g cm-3 in Paper I. This is an improvement to estimate the mass of the first core accurately. The difference of this definition does not influence the calculation of this paper at all.
- 3
![$\left[\displaystyle \frac{k_{\rm B} \rho }{\mu m_{\rm H}} T_{\rm g} + \rho v^2 \right] = 0$](data:image/png;base64,iVBORw0KGgoAAAANSUhEUgAAAAEAAAABCAQAAAC1HAwCAAAAC0lEQVR42mNkYAAAAAYAAjCB0C8AAAAASUVORK5CYII=) , where, the bracket, [], denotes the difference of the physical values on both sides of the shock wave front.
, where, the bracket, [], denotes the difference of the physical values on both sides of the shock wave front. - 4
The beam size 0
02 was taken from the highest spatial resolution of ALMA. The expected flux Fν ∼ 10−3 Jy beam−1 will be achieved by time integration of ∼3 minutes at ν = 9 × 10¹¹ Hz (see http://www.eso.org/sci/facilities/alma/observing/tools/etc/index.html). - 5
The Band 10 receiver is planned to operate in the highest frequency from 787 GHz to 950 GHz in ALMA observatory.
- 6
He mentioned SPICA (SPace Infrared telescope for Cosmology and Astrophysics) as an example.
![$\left[\displaystyle \frac{k_{\rm B} \rho }{\mu m_{\rm H}} T_{\rm g} + \rho v^2 \right] = 0$](https://content.cld.iop.org/journals/0004-637X/728/2/78/revision1/apj377822ieqn6.gif)