


ABSTRACT
We aim to investigate the magnetic field strengths and cyclotron emission of the two soft X-ray-emitting intermediate polars (IPs) UU Col and NY Lup. We study the connection between polars and soft X-ray-emitting IPs by searching for evidence of circularly polarized light in these two systems, which may be examples of progenitors of polars. We carried out photopolarimetric observations of our targets using the Very Large Telescope (UT2) and FORS1 at Paranal. Imaging polarimetry with good signal-to-noise and relatively high time resolution is possible for these targets using such a large telescope. Detection of circular polarization, modulated according to a white dwarf (WD) spin period, is clear evidence of cyclotron emission processes near the WD surface. The color dependence of the polarization allows us to make estimates of the magnetic field strength. We found that both UU Col and NY Lup emit circularly polarized light in the B and I bands, modulated at the spin period of the WD in each case. We add further confirmation to the idea that soft X-ray-emitting IPs emit circularly polarized light and that cyclotron emission plays an important role in these systems. This also suggests that some soft X-ray-emitting IPs might be progenitors of polars.
Export citation and abstract BibTeX RIS
1. INTRODUCTION TO MAGNETIC CATACLYSMIC VARIABLES
Magnetic cataclysmic variables (mCVs) consist of two groups of objects: intermediate polars (hereafter IPs) and polars. The first class is also known as DQ Herculis stars, and the latter as AM Herculis stars by some authors, after likely prototypes. Sometimes the use of the name DQ Her stars is limited to ultra fast spinning IPs, such as DQ Her itself, AE Aqr, and a few others whose spin/orbital period ratio is less than about 0.01.
IPs and polars are both interacting binary stars in which a late-type main-sequence star (the secondary star) transfers matter to the white dwarf (WD: the primary star) via Roche lobe overflow. The strong magnetic fields found in mCVs (of order megagauss) have an effect on the accretion: in polars the matter is captured from the coupling region near the L1-point. From there plasma flows toward the magnetic pole(s) on the surface of the WD, forming a shock. In IPs, matter typically first forms an accretion disk, and thus their magnetic field is weaker than the gravitational potential at this point. Closer to the WD, magnetic forces begin to dominate over gravitational forces, and matter thereafter flows toward the WD surface along the magnetic field lines, in a similar way to polars. IPs often appear to have two equally accreting regions on the surface of the WD, whereas polars often have only one dominant accretion region. Above these accreting regions, the accreted matter is decelerated from supersonic speed to subsonic speed and is heated in a free-standing shock just above the surface of the WD.
Cooling processes in the heated plasma produce hard X-rays (kT∼ 10–60 keV, via bremsstrahlung radiation) and cyclotron radiation, which is seen in the infrared and as harmonic overtones also in the optical. Cyclotron emission is typically found in polars, as is soft X-ray blackbody emission (kT ∼ 20–60 eV), believed to arise from reprocessing of the hard X-rays in the WD photosphere, and/or direct heating by accretion of dense blobs that are not decelerated in a shock above the surface. In high magnetic field systems, the cyclotron emission process dominates (Woelk & Beuermann 1992). According to the recent studies of Koenig et al. (2006), most of the reprocessed hard X-ray and cyclotron radiation is emitted in the far-UV in polars.
The big difference between these two classes of mCV (in addition to those above) is also that the WD rotation in IPs is unsynchronized with the orbital period. In polars, the WD rotation period is synchronized to the orbital period of the system. Synchronization should occur in long orbital period mCVs with a magnetic moment of ∼1034 G cm3 or larger, and with ∼1033 G cm3 synchronization will set in at orbital periods below 3 or 4 hr (Norton et al. 2004). As IPs all rotate unsynchronized, it could be expected that their magnetic moments are less than those values. The high magnetic field strengths found in polars (tens of MG) are correspondingly able to lock the spin of the WD to the orbital period. Chanmugam & Ray (1984) suggested that IPs evolve into polars. This idea has not been widely accepted, mainly because there have not yet been direct measurements of magnetic field strengths in IPs of similar size to that of polars.
1.1. The Soft X-ray Intermediate Polars
Before the ROSAT era, it was assumed that IPs do not emit soft X-rays and they differ in that sense from polars, i.e., emitting mostly in hard X-rays, whereas the polars were known as "soft X-ray mCVs." However, in the 1990s ROSAT found several IPs which have a significant soft quasi-blackbody X-ray component. Later BeppoSAX and the highly sensitive XMM-Newton revealed more IPs with soft X-ray components, and there are now 13 soft X-ray-emitting IPs out of the total of 33 confirmed IPs (the current number of IPs is taken from Koji Mukai's Catalog of IPs, version 2009a) and thus they account for about 40% of the whole sample.
The first discoveries of soft X-ray-emitting IPs had led to the suggestion of two spectrally distinct classes (Haberl & Motch 1995). However, Evans & Hellier (2007) did a survey from XMM-Newton data and found that 8 of the 12 selected IPs showed a soft blackbody component in their spectra. Their conclusion was that soft X-ray emission is a common feature amongst IPs and not just a characteristic of a small subclass. They also suggested that whether or not an IP shows a soft X-ray component is totally dependent on geometric factors alone: a blackbody is not seen in IPs which have accretion regions obscured by accretion curtains or (in cases where they are visible) only when foreshortened on the limb of the WD. In those systems where the soft X-ray component is seen, there is no obscuration due to the geometry (such as orbital inclination, the magnetic colatitude on the surface of the WD, and accretion curtains, etc.) or the obscuration is heavily reduced allowing us to see the blackbody component.
1.2. Circular Polarization in Intermediate Polars
In the 1970s, there were some studies of polarization variations in DQ Her (the IP prototype star; Swedlund et al. 1974; Kemp et al. 1974). In these studies, polarimetric variations of ∼0.2% were found using observations in an unfiltered broad passband between 3500 Å and 5800 Å(i.e., the blue part of the spectrum), modulated with a 142 s period. Cropper (1986) observed more than 10 years later a sample of five IPs (nine IPs were known at that time) and reported that the maximum percentage polarization in the variable component of white and red light was 0.3% and 0.8%, respectively.
By the time of polarimetric observations of soft X-ray-emitting IPs in the 1990s and 2000s, seven IPs were found to emit circularly polarized light: BG CMi (Penning et al. 1986), PQ Gem (Piirola et al. 1993), V2400 Oph (Buckley et al. 1997), V405 Aur (Piirola et al. 2008), V2306 Cyg (Norton et al. 2002), 1RXS J213344.1+510725 (Katajainen et al. 2007), and 1RXS J173021.5–055933 (Butters et al. 2009).
1.3. UU Col
RX J0512.2–3241 (UU Col) was discovered from the ROSAT survey as a soft, high-galactic latitude X-ray source, and it was later identified as a V ∼17.6 mag star (Burwitz et al. 1996). Its X-ray spectrum was characterized by a soft component with negligible intrinsic absorption and a blackbody temperature kTbb ∼ 38 eV. Burwitz et al. (1996) determined a 863.5 ± 0.7 s spin period and a 3.45 ± 0.03 hr orbital period. By using an empirical relationship between the bremsstrahlung and blackbody fluxes (Fbr and Fbb; Beuermann & Burwitz 1995), they estimated Fbr/Fbb = 0.10 ± 0.06 which indicates that the magnetic field strength could be between 10 MG and 30 MG and derived an accretion rate of  .
.
The orbital period given by de Martino et al. (2006b) is 3.13 ± 0.17 hr, significantly shorter than that given by Burwitz et al. (1996). Their light curves show 15% (UV) and 6% (B) amplitude modulations, and suggest a hot component being responsible for the pulsations at those wavelengths. These optical pulsations are anti-phased with the hard X-ray variability so that the minimum of UV- and B-band pulses is centered on the hard X-ray maximum. The soft X-ray band shows a maximum at the same WD rotational phase as the optical bands, however. This optical spin pulse is also broad, which suggests that the accretion region is wide.
1.4. NY Lup
1RXS J154814.5–452845 (NY Lup) was discovered from the ROSAT all-sky survey as a new IP by Haberl et al. (2002). It shows pulsations in the optical and X-ray light curves with a period of 693 s, which is assumed to be the spin period of the WD. Its orbital period was tentatively calculated to be either 9.37 hr or 6.72 hr by Haberl et al. (2002). Values of 693.01 ± 0.06 s and 9.87 ± 0.03 hr were subsequently determined for the spin and orbital periods by de Martino et al. (2006a). This is one of the longest orbital periods amongst IPs and it has one of the highest degrees of asynchronism amongst IPs (i.e., spin period/orbital period ∼0.02).
The X-ray spectrum of NY Lup shows both hard and soft components. The hard X-ray spectrum can be modeled with a multi-temperature bremsstrahlung model with a temperature distribution up to ∼60 keV. The soft X-ray component has a temperature of 84–97 eV (Haberl et al. 2002) or 104 eV (Evans & Hellier 2007), and its magnetic field is assumed to be weak, based on the measured X-ray luminosity and accretion rates derived from that of de Martino et al. (2006a). de Martino et al. (2006a) estimated that the magnetic moment of the accreting WD is μ ⩽ 4.1 × 1032 G cm3, and thus NY Lup would be a low magnetic field IP. In contrast, the estimates from the spin-to-orbital period ratio of 0.02 for a system with an orbital period of 9.87 hr using the model of spin equilibrium by Norton et al. (2004) gives μ ⩽ 1.4 × 1033 G cm3 for q = 0.5.
2. OBSERVATIONS
The observations described in this paper were obtained using the ESO Very Large Telescope (VLT) and FORS1 instrument at Paranal. FORS1 is a multi-mode instrument with polarization analyzing optics consisting of super-achromatic half-wave and quarter-wave phase retarder plates, and a Wollaston prism with a beam divergence of 22''. The instrument optics and performance are described by Seifert et al. (2000). As we are searching for polarization signals near the detection limits of the VLT and FORS1 combination, possible sources of instrumental polarization have to be carefully taken into account. Circular polarization itself is a rare phenomenon amongst astronomical targets but instrumental cross-talk effects might be important when weak signals are studied. FORS1 is affected by a spurious linear instrumental polarization due to curved lenses in the collimator combined with some reflections in the coatings (Patat & Romaniello 2006). In our case, targets were always measured in the center of the CCD frame, and thus the problem of the instrumental polarization (via cross-talk) in these observations was almost negligible. Circular polarimetry is calculated from the ratio of the ordinary ray and extra-ordinary ray fluxes (see ESO's FORS manual about FORS polarimetry at http://www.eso.org).
During our observations, FORS1 was equipped with an anti-reflection coated 2048 × 2048 pixel Tektronix TK-2048EB4-1 CCD with 24 μm pixels which corresponds to a scale of 0 125 pixel−1. The instrument was used in imaging polarimetry (IPOL) mode and in standard 1 × 1 binning. Seeing conditions were highly variable in 2005 December, from 06 to 23. In 2006 March, average seeing was very good, between 04 and 05. The dates and times of the photopolarimetric observations and exposure times are given in Table 1: Columns 1 and 2 give the epoch of the observations (date and HJD time). Column 3 gives the total (non-contiguous) time spent observing in one filter per night. Columns 4 and 5 give the orbital period and the spin period of the target. Column 6 gives the filter used, Column 7 the exposure time with that filter, and Column 8 gives the name of the target.
Table 1. Observing Log
| Date of Obs. | HJD of First Obs. | Duration | Periods | Filter | Exp. Time | Target | |
|---|---|---|---|---|---|---|---|
| (Start of Night) | (+2 453 000.0) | (hr:minutes) | Porb (hr) | Pspin (minutes) | (s) | ||
| 2005 Dec 11 | 716.6452 | 3:26 | 3.45 | 14.39 | B | 230 | UU Col |
| 2005 Dec 11 | 716.7634 | 2:00 | 3.45 | 14.39 | I | 230 | UU Col |
| 2006 Mar 17 | 812.5528 | 2:59 | 3.45 | 14.39 | I | 150 | UU Col |
| 2006 Mar 17 | 812.6459 | 1:13 | 9.87 | 11.55 | B | 20–40 | NY Lup |
| 2006 Mar 17 | 812.7851 | 3:14 | 9.87 | 11.55 | I | 10–15 | NY Lup |
| 2006 Mar 18 | 813.5110 | 2:52 | 3.45 | 14.39 | I | 150 | UU Col |
Download table as: ASCIITypeset image
The observations were carried out during two periods, the first run was on 2005 December 11 and the second run on two consecutive nights, 2006 March 17 and 18, at the VLT in Paranal (Chile). Data were collected with broadband BBessel and IBessel filters then reduced and analyzed in a standard way with NOAO/IRAF using IMRED and DAOPHOT packages. The photon counts f o (ordinary ray) and feo (extra-ordinary ray) were measured via aperture photometry after proper bias subtraction and flat-field corrections. Zero calibration was done using unpolarized standard stars, and by using some field stars near the center of the CCD frame. To check for the sign of the circular polarization, observations of the highly polarized stars LP790–29 (West 1989), HE0330–002 (Schmidt et al. 2001), and G99–37 (Landstreet & Angel 1971) were used.
3. RESULTS
3.1. Circular Polarization Curves: UU Col
UU Col was observed during three different nights: 2005 December 11 as well as 2006 March 17 and 18. The B and I bands were selected to give information about possible polarization in the blue and the red part of the spectrum.
Due to the relatively poor seeing conditions on 2005 December 11, we had to take much longer exposure times than originally planned, and thus the spin-phase resolution in that data is poor. As the effective integration time of one polarization point is ∼2/3 of the spin cycles, the variations in polarization have been smeared out significantly. Also meaningful spin period analysis cannot be done for the polarimetry data. Figure 1 shows the individual circular polarimetric observations in the B band and I band for UU Col in 2005 December. The B band was used for UU Col only in 2005 December. The uncertainties in each bin in circular polarization curves are calculated from photon noise statistics and error bars correspond to ±1σ level in each case.

Figure 1. Top: the individual circular polarimetric observations in the B band and I band for UU Col in 2005 December as a function of time. The error bars are calculated from photon noise statistics and corresponds to ±1σ uncertainties. Bottom: unbinned differential photometry of UU Col in the B band and I band from 2005 December.
Download figure:
Standard image High-resolution imageSignificant circular polarization is detected both in the B and the I band (Figure 1) in 2005 December. The 2/3 spin-phase-averaged B-band circular polarization varies between +0.7% ± 0.1% and −0.4% ± 0.1%. The grand average circular polarization is +0.127% with a standard deviation of σ = 0.204%.
In the I band in 2005 December (Figure 1), the observed circular polarization is mostly negative. The 2/3 spin-phase-averaged circular polarization varies between +0.47% ± 0.09% and −0.66% ± 0.09%. The deviations from zero polarization are significant. The grand average circular polarization is −0.008% with a standard deviation of σ = 0.413%.
In 2006 March, UU Col was observed with significantly better weather and seeing conditions. We could use shorter exposure times to ensure better time (and phase) resolution (see Table 1). We searched for periodic variations in polarization of the two March nights by performing a CLEAN periodogram analysis. A single strong peak emerged corresponding to a period of Ppol = 0.010097 ± 0.000030 days. Our spin folding is made using this period. The zero point of the phase was chosen arbitrarily at HJD = 2 453812.55287, the first March data point. This is within Δϕ = 0.1 of the minimum in the photometric light curve.
Polarization variations and the light curve of UU Col in the I band in 2006 March are shown in Figure 2. The polarization shows a clear spin modulation. The modulation can be described by a single smooth variations, although one should keep in mind that fast variations Δϕ < 0.2 may have escaped detection. A positive peak value of ∼+0.6% is seen at spin phase ϕ = 0.0. The minimum is reached at ϕ = 0.3 with a negative polarization, of ∼−0.7%. Zero crossing from positive to negative polarization is at ϕ = 0.07. As the polarization crosses from negative to positive values, there appears to be a standstill near zero polarization from ϕ = 0.6 to ϕ = 0.8.
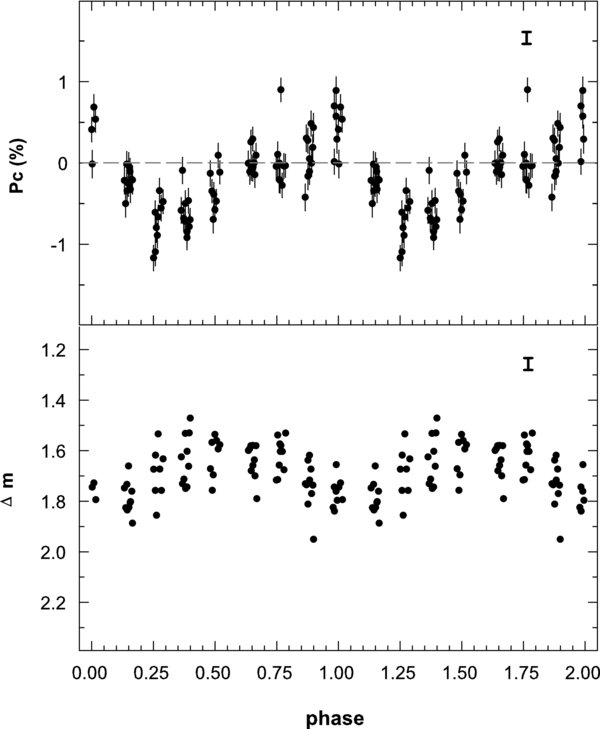
Figure 2. Top: unbinned circular polarization of UU Col in the I band from 2006 March. A single strong peak in Fourier analysis corresponds to a period of Ppol = 0.010097 ± 0.000030 days. Spin folding is made using this period. The zero point is arbitrarily HJD = 2 453812.55287 (the first March data point). The error bars are calculated from photon noise statistics and correspond to ±1σ uncertainties. Bottom: unbinned differential photometry of UU Col in the I band from 2006 March.
Download figure:
Standard image High-resolution image3.2. Circular Polarization Curves: NY Lup
NY Lup was observed during the night of 2006 March 17 in the B and I bands, when atmospheric seeing was between 04 and 05. Exposure times between 20 s and 60 s were used in the B band (most of the B-band data were taken using 40 s exposure time) and between 10 s and 15 s in the I band. As NY Lup is a relatively bright target for the VLT (V = 14.6), we were able to obtain a very high signal-to-noise ratio and hence an accuracy between 0.10% and 0.05% in the polarization.
Figure 3 shows the circular polarization curves in the B band and I band for NY Lup. Data are phased according to the WD spin period of 0.0080209 days (de Martino et al. 2006a) and using the zero point of HJD2 453812.49676d. The polarization data have been averaged into 16 phase bins in Figure 3. The errors are from photon noise statistics and plotted bars in Figure 3 correspond to ±1σ uncertainties.

Figure 3. Top: circular polarization curves of NY Lup in the B band and I band from 2006 March, averaged into 16 phase bins and plotted against WD spin phase. The spin phases are calculated using the ephemeris of de Martino et al. (2006a). The error bars are estimated from photon noise statistics and correspond to ±1σ uncertainties. Bottom: unbinned differential photometry of NY Lup in the B band and I band from 2006 March.
Download figure:
Standard image High-resolution image
We detect negative circular polarization modulated at the WD spin period in the B and I bands in NY Lup which is strongly color dependent. The polarization in the B band is at a level of −0.1% throughout most of the WD spin cycle, whereas in the I band polarization is between −1% and −2%. A drop in the polarization level close to zero occurs near WD spin phase 0.5 in the B band. In the I band, the polarization does not approach zero values in any WD spin phase. The polarization does not change sign at any WD spin phase, and variations in the polarization level are smooth, contrary to those variations seen in UU Col (Figures 1 and 2).
3.3. Light Curves
Figures 1 and 2 show light curves obtained from our photopolarimetric observations in the B and I bands for UU Col. These light curves present differential photometry, i.e., the flux of the comparison star is subtracted from the flux of target, with the difference given in magnitudes. The light curves present the photometric data without any binning or averaging. The comparison star used for the B-band photometry is located 3 2 east and 12 south of UU Col, whilst the I-band comparison star is located 17 west and 23 north of UU Col. The B-band light variations (Figure 1) show strong flickering up to 0.2 mag. 2006 March I-band data (which are better sampled than 2005 December data) reveal almost sinusoidal variations.
The NY Lup light curves folded at the WD spin period show totally different variations in the B band and in the I band (Figure 3). The comparison stars used to produce the differential photometry light curves in Figure 3 are field stars located 10 west and 34 south of NY Lup (for the B band) and 06 east and 16 south of NY Lup (for the I band). There is flickering up to 0.1 mag in the B band, but otherwise the brightness is fairly constant over the spin cycle. In the I band, there is about a 0.2 mag smooth modulation over the WD spin period and also some flickering up to 0.1 mag.
4. DISCUSSION
4.1. Analysis of UU Col Polarization and Light Curves
The best sampled UU Col polarization and light curves are the 2006 March I-band data (Figure 2). Those curves reveal smooth sinusoidal variations in the light curve, which are similar to those seen by de Martino et al. (2006b) in the UV and B bands and by Burwitz et al. (1996) in the B and V bands. Circular polarization reveals clearly two different polarity in polarization, where the positive peak occurs near the light curve minimum (i.e., phase ϕ = 0 in our ephemeris), and the negative peak near phase ϕ = 0.3, and thus the shape of the polarization curve is asymmetric displaying a "sawtooth" profile.
The occurrence of a negative peak with an almost similar polarization level as that measured in the positive peak suggests a model whereby cyclotron emission arises from two different accretion poles with different magnetic polarity. If the opposite polarization were caused by geometrical effects, a single pole could only give brief polarization sign reversal when the accretion region is near the limb of the WD (assuming that the geometry is such that the angle between the line of sight and the magnetic field lines can go through 90°). The rapid variations in polarization from positive to negative, and the asymmetric shape of the polarization curve could also be a hint of quite a complex accretion geometry. Also the X-ray (both soft and hard) light curves suggest that the accretion geometry of UU Col is very complex.
Evans & Hellier (2007) propose a model for the accretion geometry of UU Col to explain the absorption dip and soft X-ray emission based on the XMM-Newton observations of de Martino et al. (2006b). They claim that the magnetic axis is highly inclined in UU Col so that the foreshortening is reduced and the blackbody emission (and cyclotron emission) is thus seen. This emission should arise near the lower pole, and should be viewed when it is closest to us. Their model for accretion in UU Col (their Figure 5, Evans & Hellier 2007, panel (c)) does not agree fully with our observations, as we see both poles (positive and negative) emitting polarized light. In their idea of a high inclination of the magnetic axis in UU Col, we would see only one accreting pole due to the highly inclined magnetic axis, and the other pole (i.e., the upper one) would stay obscured due to the accretion curtains. We propose that the magnetic axis is inclined, but in a way that the magnetic geometry allows us to detect circular polarization from both accretion regions. These two models (i.e., our model and the model by Evans & Hellier 2007) would be consistent with each other if it is also assumed that UU Cols accretion geometry is such that it allows us to detect circular polarization (due to cyclotron emission) from both of the poles, but the soft X-ray emission is visible only from one pole, however. This kind of geometry is possible, as cyclotron emission regions in mCVs are generally larger than those areas where soft X-rays are emitted.
4.2. Analysis of NY Lup Polarization and Light Curves
The shape of the polarization curves in NY Lup (Figure 3) suggests a scenario with only one accretion pole, as there are no observations of positive circular polarization at any WD spin phase. This must be due to either the accretion occurring mainly at one active pole, or the accretion geometry is such that it prevents us from detecting the oppositely signed polarization from the other accretion pole. There are dips in the polarization level, particularly in the B band. One dip occurs between spin phases 0.2and0.3, and another, wider drop in polarization is seen between phases 0.5and0.7. This is deep in the B band, where the polarization decreases almost to zero values for a short fraction of the spin cycle. One explanation for the zero polarization levels (seen in the B band) near phase 0.5 could be geometrical effects, i.e., the accretion pole disappears for a short fraction of the WD spin cycle behind the limb of the WD at this point. However, as there is about −1% polarization in the I band at that phase, it is difficult to explain the dip as due to such an effect.
Haberl et al. (2002) reported a dip in their X-ray light curves near the pulse maximum (most prominent in the 2.0–8.0 keV pulse profile). The dip seen in our polarization curves between phases 0.2and0.3, could have the same origin. The observed decline in X-ray hardness ratio suggests that the line of the sight is almost parallel to the accretion curtain. This allows an almost free view down to the surface of the WD, whilst the other accretion pole is hidden behind the accretion curtain (Haberl et al. 2002). Our polarization curves confirm this picture, as we see only negative circular polarization and the positive pole remains totally hidden. Evans & Hellier (2007) claimed that in NY Lup the light curves suggest that the accretion curtains do not hide the accretion footprints, which is true only for one accreting pole.
4.3. The Magnetic Moments
The most important result from our study is the clear detection of circular polarization in both UU Col and NY Lup. It unambiguously shows that cyclotron emission is important in both of these IPs, and that their magnetic field strengths are high enough to generate cyclotron emission. As our observations were made using only B and I bands, we cannot model the field strength reliably using cyclotron emission models by fitting calculated harmonic overtones of the cyclotron emission to the observed polarization curves. This type of modeling would require high signal-to-noise linear polarization data to make it possible to estimate the orbital inclination of the binary system, as the observed cyclotron emission is strongly dependent on viewing angle.
We observed UU Col at an almost similar circular polarization level in the B band and I band in 2005 December, whilst in the better sampled I-band polarization data from 2006 March we detected higher polarization than what was seen in 2005 December in the B band. This indicates a fairly strong magnetic field. Thus, our observations agree with values suggested by Burwitz et al. (1996). For example, polar or IP systems which have magnetic field strengths (estimated or measured) in the range from 10 to 30 MG often have equal polarization levels in the red and blue part of the spectrum and their polarization peak occurs near to visible wavelengths. Examples of such systems are EF Eri (Piirola et al. 1987), 1RXS J213344.1+510725 (Katajainen et al. 2007), and V405 Aur (Piirola et al. 2008). In the case of V405 Aur, the (marginally) highest peak of circular polarization occurs in blue light. Piirola et al. (2008) estimated from spectropolarimetry that the magnetic field of V405 Aur is ∼30 MG. In the case of UU Col, the peak in polarization may not probably exist in the blue, but either in the visible or red part of the spectrum. Thus, the magnetic field strength is possibly weaker than in V405 Aur. We can also assume that it is of order the same strength as that found in many polars and polarized IPs and thus UU Col could be a genuine polar progenitor.
In the case of NY Lup, de Martino et al. (2006a) came to the conclusion that its magnetic field strength is lower than 2 MG. Norton et al. (2004) gave estimates μ ⩽ 1.4 × 1033 G cm3 for q = 0.5 for the magnetic moment. We have observed circular polarization both in the blue and the red part of the spectrum, and we can claim that NY Lup has a magnetic field strength which is at least strong enough to generate cyclotron emission. It seems, however, that the estimates of de Martino et al. (2006a) (less than 2 MG) are too low for any cyclotron harmonics (and circular polarization) to be detected in the B band.
We can also compare the color dependence of the circular polarization seen in NY Lup with that of other IPs where a similar peak in polarization in red light has been seen. A good example of such an IP is PQ Gem, where magnetic field strength estimates range from 8 MG to 18 MG (Piirola et al. 1993), but accurate values for the field depend on several parameters used in modeling (the dimensionless size parameter Λ, X-ray temperature, etc.). With only B- and I-band polarization data available, and without accurate knowledge about the magnetic field strength, it is not possible to estimate whether NY Lup would evolve into a polar. Phase-resolved circular spectropolarimetry in the near-infrared region would be the best way to reveal the truth about the magnetic field strength in NY Lup, and this should be possible in the future with larger telescopes than are now available.
5. CONCLUSION
We have found that the soft X-ray-emitting IPs UU Col and NY Lup both emit circularly polarized light. The polarization in UU Col is between +0.4% and −0.4% in the B band and +0.6% and −0.7% in the I band, whereas NY Lup has about −0.1% in the B band and about −2% in the I band. In UU Col, we are likely seeing cyclotron emission from two poles, whereas in NY Lup it is likely that emission from only one pole is seen. Previous estimates of the magnetic field strength in UU Col of between 10 and 30 MG (Burwitz et al. 1996) are in agreement with these observations, as the polarization level is almost equal in both the blue and red parts of the spectrum. This in turn indicates a possible magnetic field strength of the same order as in some polars. NY Lup instead has a strong color dependence in its polarization, peaking in the red. This indicates that the field strength there could be of the same order as in other polarized IPs, such as PQ Gem. These magnetic field values should be confirmed using spectropolarimetry in the future.
This work has been supported by the Academy of Finland (S.K.) and "Societas Scientiarum Fennica-Suomen Tiedeseura" and its Magnus Ehrnrooth foundation (S.K.). This work is based on observations made with ESO Telescopes at the Paranal Observatories under programme ID 076.D-060BA.1 and 076.D-0608B.1.