


ABSTRACT
The quantities and wavelength dependencies of the dust extinction along the lines of sight toward 33 nearby gamma-ray bursts (GRBs) with redshifts z < 2 are derived from fitting their afterglow spectral energy distributions. Unlike previous studies which often assume a specific extinction law like that of the Milky Way (MW) and the Large and Small Magellanic Clouds (LMC/SMC), our approach—we call it the "Drude" approach—is more flexible in determining the true wavelength dependence of the extinction (while the shape of the extinction curve inferred from that relying on a priori assumption of a template extinction law is, of course, fixed). The extinction curves deduced from the Drude approach display a wide diversity of shapes, ranging from relatively flat curves to curves which are featureless and steeply rise toward the far-ultraviolet, and from curves just like that of the MW, LMC, and SMC to curves resembling that of the MW and LMC but lacking the 2175 Å bump. The visual extinction AV derived from the Drude approach is generally larger by a factor of ∼2–5 than that inferred by assuming a SMC-type template extinction law. Consistent with previous studies, the extinction-to-gas ratio is mostly smaller than that of the MW, and does not seem to correlate with the shape of the extinction curve. It is shown that the standard silicate–graphite interstellar grain model closely reproduces the extinction curves of all 33 GRBs host galaxies. For these 33 bursts at z < 2, we find no evidence for the evolution of the dust extinction, dust sizes, and relative abundances of silicate to graphite on redshifts.
Export citation and abstract BibTeX RIS
1. INTRODUCTION
The presence of dust in the host galaxies of gamma-ray burst (GRB) is now well recognized (see Li et al. 2008a for a summary), as revealed by dark bursts,3 reddening of GRB afterglows (Klose et al. 2000; Levan et al. 2006), depletion of dust-forming heavy elements (Savaglio et al. 2003), thermal emission of GRB host galaxies in the infrared (IR) and submillimeter wavelengths (Michałowski et al. 2008, 2009), and the association of long-duration bursts with the death of young massive stars (which suggests the residence of long bursts in dense, dusty star-forming regions; see Woosley & Bloom 2006 for a review). Very recently, Berger et al. (2009) reported the discovery of a very red near-IR and optical afterglow of GRB 070724A, a short-duration GRB. They argued that dust extinction (with an visual extinction of AV ≈ 2 mag) may also be responsible for reddening the optical/near-IR afterglow of this short burst (which is much redder than expected in the standard afterglow model).
However, little is known regarding the quantities and properties of the dust in GRB host galaxies. While studies based on fitting the spectral energy distributions (SEDs) of afterglows in the ultraviolet (UV), visible and near-IR with a power law (or broken power laws) reddened by a known template extinction law such as that of the Milky Way (MW) and the Large/Small Magellanic clouds (LMC/SMC) often suggest little extinction and a SMC-type extinction law (e.g., see Kann et al. 2006), dust depletion studies often favor large extinction and a flat or even gray extinction law (e.g., see Savaglio et al. 2003; Savaglio & Fall 2004), in stark contrast to the featureless SMC extinction law which steeply rises with inverse wavelength (λ−1). But some studies based on SED modeling also suggest that large extinction is not uncommon. For some bursts, the visual extinction AV exceeds several magnitudes, e.g., AV ≈ 3.2 mag for GRB 080607 (Prochaska et al. 2009), AV > 3.8 mag for GRB 970828 (Djorgovski et al. 2001), 2 ≲ AV ≲ 5 mag for GRB 060923A (Tanvir et al. 2008), AV > 5.0 mag for GRB 061222A (Perley et al. 2009), AV ≈ 5.5 mag for GRB 070306 (Jaunsen et al. 2008), and AV > 5.5 mag for GRB 070521 (Perley et al. 2009), just to list a few. Furthermore, extinction laws very different from that of the SMC have been inferred for some bursts. The 2175 Å extinction bump, the most prominent UV extinction feature in the Galactic extinction law, is clearly seen in GRB 070802 (Krühler et al. 2008; Elíasdóttir et al. 2009; Liang & Li 2009), GRB 080607 (Prochaska et al. 2009), and probably in GRB 970508 (Stratta et al. 2004), GRB 991216 (Kann et al. 2006; Vreeswijk et al. 2006), GRB 050802 (Schady et al. 2007), and GRB 050904 (Liang & Li 2009). On the other hand, some bursts appear to have a featureless extinction law but much flatter than that of the SMC (e.g., see Chen et al. 2006; Li et al. 2008b; Perley et al. 2008a).
In view of the wide diverse nature of the quantity and wavelength dependence of the dust extinction of GRB host galaxies, we developed a technique (we call it the "Drude" approach) to fit the observed afterglow SEDs to derive the extinction and its wavelength dependence of the dust local to GRB hosts (see Li et al. 2008a). The advantage of this approach is that it does not require a priori assumption of a template extinction law (see Section 2). This is important as there is no reason to believe that the extinction curves of GRB host galaxies which exhibit a wide range of ages, luminosities, metallicities, and star formation rates should resemble that of the known MW, LMC, SMC, and other templates. Even in the MW, there does not exist a universal extinction law: the extinction curve varies from one sightline to another. In the SMC and the LMC, there are also regional variations (see Gordon et al. 2003). So far, only a few other galaxies have their extinction curves measured; the extinction curves of these external galaxies differ much from the standard MW, LMC, and SMC laws (see Section 2.2 of Draine 2003). The "Calzetti" starburst attenuation law (i.e., the internal extinction by dust in starburst galaxies) determined by Calzetti et al. (1994) and the extinction curve inferred for a distant broad absorption line (BAL) QSO at a redshift z ≈ 6.2 by Maiolino et al. (2004)4 do not look like that of the MW, LMC, or SMC at all. Apparently, we should not expect a universal extinction law for GRB host galaxies.
Adopting the "Drude" approach (Li et al. 2008a; Section 2), in this work we perform a systematic study of the dust extinction of the host galaxies for a sample of 33 nearby or low-redshift (with z < 2) GRBs. In a separate paper, we will explore high-redshifted GRB host galaxies (at z > 2) with an aim of studying the properties of interstellar dust of the early universe and investigating whether (and how) they vary with z (S. L. Liang & A. Li 2010, in preparation). We compile the SEDs in the UV/optical/near-IR bands of these GRB afterglows (Section 3), and determine both the quantity and wavelength-dependence of the extinction for the host galaxy of each GRB (Section 3). In Section 4, we discuss the deduced extinction curves and model them in terms of the silicate–graphite interstellar dust model. The dust properties and how the dust is correlated with gas are also discussed in Section 4. The major conclusion of this work is summarized in Section 5.
2. DETERMINING THE DUST EXTINCTION: THE DRUDE APPROACH
We characterize the dust extinction properties of GRB hosts with the rest-frame visual extinction AV and the wavelength-dependence of the extinction (i.e., Aλ/AV or Aν/AV if expressed in frequency ν, often known as the "extinction curve" or "extinction law"). We derive AV and Aλ/AV (or Aν/AV) by fitting the UV, optical, and near-IR afterglow photometry with a dust-reddened power-law model through
where Fν is the afterglow photometry (with the Galactic foreground extinction corrected), β is the intrinsic power-law slope of the afterglow, Fo is a normalization constant, A(1+z)ν is the rest-frame extinction, and z is the GRB redshift.
As described in Li et al. (2008a), the "Drude" approach approximates the wavelength-dependence of the extinction by a simple formula consisting of four dimensionless parameters (c1, c2, c3, and c4)
where λ is in μm. In Equation (2), the first term in the right-hand side represents the far-UV extinction rise, the second term and the third term, respectively, account for the near-IR/visible extinction and the 2175 Å extinction bump.
We use the Levenberg–Marquardt minimization algorithm (Press et al. 1992) to find the best-fit parameters cj (j = 1, ..., 4) and β, AV and Fo. To be complete, we also model the afterglow SEDs using the MW, LMC, and SMC template extinction laws. Since for a given template the wavelength dependence of the extinction Aλ/AV is fixed, we only need to determine three parameters: β, AV, and Fo.
Compared to models based on template extinction curves, the "Drude" model is preferred because (1) it eliminates the need for a priori assumption of template laws (i.e., we do not need to choose a presumed dust extinction model), and (2) the analytical formula (Equation (2)) on which the "Drude" model is based restores the widely adopted MW, SMC, LMC, and "Calzetti" templates—even if the "true" extinction curve of a GRB host happens to resemble a certain template law, the "Drude" approach will allow us to restore it (see Li et al. 2008a).
We should note that it is unfortunate that the Drude approach needs more free parameters5—but this is the nature of the Drude approach: it allows the extinction curve to have a flexible shape, one has to have parameters to control the shape variation. While the approach of using "template" extinction curves has fewer parameters, their extinction shapes are fixed (although it is well recognized that there is no prior reason why a GRB host should have an extinction shape like that of a fixed template). Note that the Cardelli et al. (1989, hereafter CCM) parameterization of interstellar extinction curves with a single parameter RV6 (Cardelli et al. 1989) is only valid for the Galactic sightlines—indeed, it does not even apply to the LMC and the SMC (Gordon et al. 2003),7 otherwise one could simply adopt the CCM formula which has only one parameter (i.e., RV) instead of Equation (2) which has four parameters. The Fitzpatrick & Massa (1990, "FM") formula consisting of four parameters is good for the MW, SMC, and LMC; but it is only valid for λ < 0.3 μm.
Table 1. Parameters for Fitting the Afterglow SEDs with the MW, LMC, and SMC Template Extinction Laws
| GRB | MW Dust | LMC Dust | SMC Dust | |||||||||
|---|---|---|---|---|---|---|---|---|---|---|---|---|
| AV (mag) | β | log Fo | χ2/Nobs | AV (mag) | β | log Fo | χ2/Nobs | AV (mag) | β | log Fo | χ2/Nobs | |
| (μJy) | (μJy) | (μJy) | ||||||||||
| 970508 | 0.24 ± 0.08 | 0.14 ± 0.06 | 3.26 | 0.38 | 0.16 ± 0.05 | 0.10 ± 0.04 | 3.47 | 2.42 | 0.13 ± 0.04 | 0.25 ± 0.06 | 5.27 | 1.46 |
| 980703 | 0.72 ± 0.26 | 1.73 ± 0.62 | 27.22 | 0.65 | 0.21 ± 0.07 | 2.25 ± 0.80 | 34.74 | 0.91 | 0.39 ± 0.14 | 2.05 ± 0.73 | 31.87 | 0.80 |
| 990123 | 0.21 ± 0.13 | 0.44 ± 0.10 | 7.66 | 0.88 | 0.14 ± 0.06 | 0.34 ± 0.08 | 6.10 | 0.48 | 0.17 ± 0.08 | 0.40 ± 0.06 | 6.99 | 0.45 |
| 990510 | 0.16 ± 0.04 | 0.67 ± 0.22 | 11.94 | 2.38 | 0.18 ± 0.07 | 0.30 ± 0.14 | 6.44 | 0.32 | 0.15 ± 0.05 | 0.60 ± 0.26 | 10.96 | 0.78 |
| 991208 | 0.86 ± 0.29 | 0.16 ± 0.07 | 5.65 | 0.08 | 0.78 ± 0.18 | 0.17 ± 0.05 | 5.78 | 0.10 | 0.90 ± 0.20 | 0.11 ± 0.04 | 4.95 | 0.07 |
| 991216 | 0.16 ± 0.06 | 0.39 ± 0.12 | 8.09 | 0.20 | 0.14 ± 0.03 | 0.35 ± 0.12 | 7.57 | 1.13 | 0.14 ± 0.05 | 0.39 ± 0.14 | 8.08 | 0.35 |
| 000911 | 0.44 ± 0.17 | 0.55 ± 0.28 | 10.08 | 0.51 | 0.17 ± 0.03 | 0.77 ± 0.22 | 13.28 | 0.45 | 0.30 ± 0.08 | 0.64 ± 0.10 | 11.41 | 0.41 |
| 010222 | 0.15 ± 0.05 | 1.04 ± 0.12 | 17.63 | 1.99 | 0.13 ± 0.03 | 0.81 ± 0.09 | 14.12 | 0.67 | 0.16 ± 0.04 | 0.96 ± 0.11 | 16.43 | 0.98 |
| 010921 | 0.83 ± 0.27 | 0.91 ± 0.29 | 15.72 | 0.03 | 1.23 ± 0.39 | 0.11 ± 0.03 | 3.92 | 0.03 | 1.33 ± 0.43 | 0.19 ± 0.06 | 5.16 | 0.03 |
| 011121 | 0.50 ± 0.11 | 0.55 ± 0.19 | 9.55 | 0.56 | 0.40 ± 0.13 | 0.61 ± 0.15 | 10.40 | 0.43 | 0.48 ± 0.14 | 0.55 ± 0.14 | 9.55 | 0.46 |
| 020405 | 0.16 ± 0.05 | 0.96 ± 0.20 | 15.35 | 1.07 | 0.17 ± 0.06 | 0.93 ± 0.23 | 14.98 | 1.02 | 0.20 ± 0.09 | 0.91 ± 0.15 | 14.63 | 1.02 |
| 020813 | 0.11 ± 0.05 | 0.89 ± 0.16 | 15.23 | 1.09 | 0.16 ± 0.04 | 0.80 ± 0.20 | 13.97 | 0.53 | 0.21 ± 0.08 | 0.71 ± 0.15 | 12.61 | 0.60 |
| 030226 | 0.10 ± 0.03 | 0.61 ± 0.14 | 10.93 | 3.17 | 0.14 ± 0.03 | 0.43 ± 0.11 | 8.20 | 0.56 | 0.12 ± 0.04 | 0.43 ± 0.10 | 8.30 | 1.24 |
| 030328 | 0.18 ± 0.07 | 0.41 ± 0.19 | 7.87 | 2.36 | 0.15 ± 0.08 | 0.20 ± 0.08 | 4.71 | 0.40 | 0.15 ± 0.05 | 0.31 ± 0.10 | 6.44 | 0.52 |
| 030329 | 0.53 ± 0.23 | 0.32 ± 0.10 | 7.22 | 0.36 | 0.38 ± 0.14 | 0.43 ± 0.15 | 8.78 | 0.34 | 0.49 ± 0.17 | 0.34 ± 0.13 | 7.50 | 0.36 |
| 040924 | 0.26 ± 0.06 | 0.55 ± 0.16 | 8.60 | 0.84 | 0.21 ± 0.04 | 0.58 ± 0.16 | 9.03 | 0.97 | 0.29 ± 0.06 | 0.51 ± 0.15 | 8.03 | 0.80 |
| 041006 | 0.12 ± 0.03 | 0.39 ± 0.13 | 7.52 | 0.42 | 0.13 ± 0.02 | 0.36 ± 0.12 | 7.16 | 0.47 | 0.15 ± 0.02 | 0.36 ± 0.12 | 7.09 | 0.42 |
| 050318 | 0.93 ± 0.33 | 1.74 ± 0.41 | 44.06 | 0.60 | 0.65 ± 0.23 | 1.80 ± 0.36 | 43.93 | 0.24 | 0.79 ± 0.28 | 1.73 ± 0.55 | 44.01 | 0.29 |
| 050408 | 0.23 ± 0.04 | 1.34 ± 0.22 | 21.00 | 2.58 | 0.75 ± 0.12 | 0.27 ± 0.04 | 5.34 | 0.39 | 1.02 ± 0.17 | 0.11 ± 0.02 | 3.04 | 0.84 |
| 050525A | 0.38 ± 0.11 | 1.77 ± 0.50 | 28.19 | 0.10 | 0.17 ± 0.05 | 1.97 ± 0.56 | 31.03 | 0.15 | 1.33 ± 0.37 | 0.11 ± 0.03 | 3.91 | 0.06 |
| 050824X | 0.30 ± 0.09 | 0.16 ± 0.04 | 3.79 | 0.35 | 0.34 ± 0.06 | 0.14 ± 0.02 | 3.08 | 0.17 | 0.35 ± 0.08 | 0.14 ± 0.03 | 3.08 | 0.21 |
| 051111 | 0.18 ± 0.05 | 0.98 ± 0.25 | 17.34 | 1.77 | 0.35 ± 0.09 | 0.42 ± 0.11 | 9.13 | 0.34 | 0.62 ± 0.16 | 0.12 ± 0.03 | 4.90 | 0.56 |
| 060614 | 0.26 ± 0.12 | 0.69 ± 0.16 | 12.23 | 0.52 | 0.17 ± 0.16 | 0.67 ± 0.14 | 11.93 | 0.44 | 0.24 ± 0.10 | 0.69 ± 0.20 | 12.23 | 0.47 |
| 060729 | 0.20 ± 0.03 | 0.83 ± 0.22 | 14.45 | 0.52 | 0.16 ± 0.04 | 0.87 ± 0.32 | 15.05 | 0.44 | 0.16 ± 0.04 | 0.87 ± 0.25 | 14.98 | 0.56 |
| 061121 | 1.28 ± 0.52 | 0.93 ± 0.38 | 16.60 | 2.97 | 0.65 ± 0.26 | 1.29 ± 0.52 | 21.57 | 3.51 | 1.54 ± 0.62 | 0.11 ± 0.04 | 4.51 | 1.79 |
| 061126 | 0.06 ± 0.04 | 0.79 ± 0.13 | 14.23 | 0.73 | 0.06 ± 0.04 | 0.77 ± 0.12 | 13.87 | 0.63 | 0.07 ± 0.04 | 0.79 ± 0.13 | 14.16 | 0.47 |
| 070125 | 0.15 ± 0.02 | 0.73 ± 0.24 | 13.30 | 6.53 | 0.14 ± 0.04 | 0.52 ± 0.15 | 10.11 | 0.56 | 0.17 ± 0.04 | 0.67 ± 0.20 | 12.47 | 1.86 |
| 070306 | 1.41 ± 0.25 | 2.80 ± 0.34 | 14.45 | 1.89 | 1.34 ± 0.29 | 2.80 ± 0.42 | 15.23 | 1.96 | 1.34 ± 0.30 | 2.80 ± 0.46 | 16.02 | 1.90 |
| 071003 | 0.13 ± 0.08 | 1.13 ± 0.20 | 18.13 | 0.79 | 0.10 ± 0.05 | 0.91 ± 0.16 | 14.82 | 0.69 | 0.24 ± 0.05 | 0.70 ± 0.12 | 11.78 | 0.51 |
| 080319B | 0.10 ± 0.08 | 0.08 ± 0.06 | 4.24 | 2.35 | 0.14 ± 0.05 | 0.08 ± 0.06 | 4.24 | 1.32 | 0.08 ± 0.06 | 0.05 ± 0.02 | 4.24 | 1.67 |
| 080330 | 0.23 ± 0.16 | 0.50 ± 0.13 | 10.00 | 3.03 | 0.25 ± 0.11 | 0.44 ± 0.12 | 9.19 | 3.19 | 0.28 ± 0.14 | 0.48 ± 0.16 | 9.70 | 3.23 |
| 080514B | 0.10 ± 0.04 | 0.50 ± 0.14 | 8.60 | 0.50 | 0.08 ± 0.05 | 0.38 ± 0.10 | 6.89 | 0.59 | 0.08 ± 0.05 | 0.45 ± 0.70 | 7.86 | 0.43 |
| 081008 | 0.20 ± 0.10 | 1.21 ± 0.91 | 20.52 | 5.56 | 0.38 ± 0.28 | 0.11 ± 0.08 | 4.15 | 1.44 | 0.16 ± 0.12 | 1.10 ± 0.82 | 18.86 | 3.83 |
Note. The goodness of the fit is measured by χ2/Nobs, where Nobs is the number of observational data points.
Download table as: ASCIITypeset image
Table 2. Parameters for Fitting the Afterglow SEDs with the "Drude" Approach
| GRB | z | log( ) ) |
Ref. | c1 | c2 | c3 | c4 | AV (mag) | β | RV | log Fo (μJy) | χ2/Nobs |
|---|---|---|---|---|---|---|---|---|---|---|---|---|
| 970508 | 0.835 | 21.80 ± 0.40 | (1) | 0.24 | 1.32 | −2.00 | 0.12 | 0.15 ± 0.04 | 0.10 ± 0.03 | 3.14 | 43.56 | 0.20 |
| 980703 | 0.966 | 22.56 ± 0.20 | (2) | 1.33 | 3.33 | −2.16 | 0.04 | 1.25 ± 0.45 | 1.19 ± 0.42 | 3.93 | 55.91 | 0.49 |
| 990123 | 1.60 | 21.73 ± 0.40 | (1) | 1.60 | 2.90 | −2.00 | 0.00 | 0.30 ± 0.06 | 0.23 ± 0.07 | 3.25 | 20.77 | 0.30 |
| 990510 | 1.619 | 22.00 ± 0.30 | (1) | 1.94 | 2.49 | −2.03 | 0.00 | 0.37 ± 0.12 | 0.28 ± 0.10 | 3.21 | 45.41 | 0.18 |
| 991208 | 0.706 | ⋅⋅⋅ | ⋅⋅⋅ | 1.95 | 0.95 | −1.90 | 0.04 | 0.47 ± 0.15 | 0.48 ± 0.12 | 2.99 | 52.71 | 0.05 |
| 991216 | 1.02 | 21.80 ± 0.30 | (3) | 0.06 | 0.49 | −2.00 | 0.06 | 0.14 ± 0.05 | 0.36 ± 0.16 | 3.12 | 44.04 | 0.16 |
| 000911 | 1.058 | ⋅⋅⋅ | ⋅⋅⋅ | 0.62 | 2.62 | −2.02 | 0.06 | 0.32 ± 0.10 | 0.60 ± 0.19 | 3.09 | 51.68 | 0.23 |
| 010222 | 1.477 | 22.08 ± 0.20 | (4) | 4.68 | 4.79 | −1.98 | 0.00 | 0.29 ± 0.08 | 0.81 ± 0.19 | 3.29 | 18.86 | 0.48 |
| 010921 | 0.45 | ⋅⋅⋅ | ⋅⋅⋅ | 0.06 | 0.12 | −1.99 | 0.01 | 1.02 ± 0.33 | 0.52 ± 0.17 | 4.07 | 51.02 | 0.01 |
| 011121 | 0.36 | ⋅⋅⋅ | ⋅⋅⋅ | 0.06 | 0.17 | −1.99 | 0.01 | 0.56 ± 0.17 | 0.49 ± 0.14 | 3.52 | 48.81 | 0.32 |
| 020405 | 0.69 | 21.70 ± 0.30 | (5) | 0.21 | 0.74 | −1.96 | 1.0E−4 | 0.72 ± 0.14 | 0.44 ± 0.23 | 3.26 | 21.20 | 0.90 |
| 020813 | 1.25 | 20.88 ± 0.12 | (6) | 0.23 | 0.44 | −1.96 | 0.00 | 0.34 ± 0.12 | 0.46 ± 0.09 | 3.31 | 12.29 | 0.46 |
| 030226 | 1.98 | 21.50 ± 0.20 | (7) | 0.52 | 0.88 | −1.96 | 1.0E−3 | 0.24 ± 0.04 | 0.32 ± 0.08 | 3.20 | 28.97 | 0.36 |
| 030328 | 1.52 | 20.78 ± 0.18 | (8) | 0.22 | 1.28 | −2.00 | 0.00 | 0.20 ± 0.06 | 0.32 ± 0.12 | 3.26 | 44.89 | 0.27 |
| 030329 | 0.168 | 20.30 ± 0.05 | (9) | 0.02 | 0.28 | −2.00 | 0.00 | 0.30 ± 0.12 | 0.60 ± 0.23 | 3.29 | 35.37 | 0.18 |
| 040924 | 0.859 | ⋅⋅⋅ | ⋅⋅⋅ | 0.22 | 1.26 | −1.94 | 0.00 | 0.36 ± 0.10 | 0.40 ± 0.14 | 3.26 | 19.64 | 0.56 |
| 041006 | 0.716 | 21.51 ± 0.02 | (8) | 0.55 | 1.00 | −2.00 | 0.00 | 0.15 ± 0.04 | 0.32 ± 0.12 | 3.19 | 37.82 | 0.20 |
| 050318 | 1.44 | ⋅⋅⋅ | ⋅⋅⋅ | 1.59 | 1.20 | −2.00 | 0.00 | 1.51 ± 0.54 | 1.17 ± 0.42 | 3.04 | 40.00 | 0.17 |
| 050408 | 1.2357 | 22.08 ± 0.12 | (10) | 1.51 | 1.11 | −2.17 | 0.03 | 0.47 ± 0.08 | 0.62 ± 0.10 | 3.00 | 55.56 | 0.30 |
| 050525A | 0.606 | 21.34 ± 0.09 | (11) | 1.22 | 0.85 | −1.61 | 0.04 | 0.85 ± 0.23 | 0.63 ± 0.18 | 3.24 | 47.50 | 0.02 |
| 050824X | 0.83 | ⋅⋅⋅ | ⋅⋅⋅ | 1.45 | 0.92 | −1.67 | 0.05 | 0.23 ± 0.07 | 0.21 ± 0.04 | 3.16 | 45.52 | 0.13 |
| 051111 | 1.55 | 21.90 ± 0.15 | (12) | 0.61 | 0.50 | −1.91 | 0.03 | 0.38 ± 0.10 | 0.37 ± 0.10 | 3.37 | 24.34 | 0.28 |
| 060614 | 0.125 | 20.48 ± 0.12 | (13) | 0.30 | 2.86 | −1.89 | 0.00 | 0.42 ± 0.18 | 0.46 ± 0.22 | 3.29 | 22.94 | 0.35 |
| 060729 | 0.54 | 21.30 ± 0.08 | (14) | 0.50 | 0.91 | −2.00 | 0.00 | 0.45 ± 0.26 | 0.49 ± 0.17 | 3.20 | 42.94 | 0.30 |
| 061121 | 1.314 | 21.91 ± 0.10 | (15) | 8.45 | 5.34 | −0.99 | 0.10 | 1.10 ± 0.44 | 0.56 ± 0.23 | 3.29 | 51.52 | 1.39 |
| 061126 | 1.1588 | 21.43 ± 0.05 | (16) | 0.17 | 1.16 | −2.00 | 0.00 | 0.03 ± 0.01 | 0.90 ± 0.15 | 3.07 | 41.53 | 0.20 |
| 070125 | 1.547 | ⋅⋅⋅ | ⋅⋅⋅ | 0.14 | 0.21 | −1.95 | 2.0E−3 | 0.45 ± 0.13 | 0.22 ± 0.06 | 3.99 | 36.78 | 0.25 |
| 070306 | 1.4959 | 21.59 ± 0.04 | (17) | 0.50 | 0.32 | −1.98 | 0.00 | 1.40 ± 0.32 | 2.60 ± 0.43 | 3.69 | 20.34 | 1.87 |
| 071003 | 1.60435 | ⋅⋅⋅ | ⋅⋅⋅ | 0.22 | 1.08 | −2.01 | 0.02 | 0.51 ± 0.14 | 0.48 ± 0.08 | 3.26 | 37.21 | 0.47 |
| 080319B | 0.937 | 21.27 ± 0.03 | (18) | 1.36 | 0.66 | −1.97 | 0.00 | 0.05 ± 0.02 | 0.12 ± 0.04 | 3.06 | 52.42 | 0.48 |
| 080330 | 1.51 | ⋅⋅⋅ | ⋅⋅⋅ | 0.24 | 1.30 | −1.99 | 2.0E−3 | 0.41 ± 0.12 | 0.28 ± 0.07 | 3.26 | 14.73 | 2.19 |
| 080514B | 1.8 | 21.15 ± 0.30 | (19) | 0.30 | 1.68 | −2.10 | 0.01 | 0.24 ± 0.06 | 0.32 ± 0.13 | 3.26 | 42.19 | 0.29 |
| 081008 | 1.9685 | 21.83 ± 0.05 | (20) | 2.24 | 1.80 | −1.99 | 1.0E−3 | 0.31 ± 0.23 | 0.48 ± 0.36 | 3.08 | 50.05 | 1.20 |
References. (1) Galama & Wijers 2001; (2) Vreeswijk et al. 1999a; (3) Ballantyne et al. 2002; (4) Stratta et al. 2004; (5) Mirabal et al. 2003; (6) Butler et al. 2003; (7) Klose et al. 2004; (8) Butler et al. 2005; (9) Hjorth et al. 2003; (10) Foley et al. 2006; (11) Blustin et al. 2006; (12) Butler et al. 2006; (13) Dado et al. 2008; (14) Grupe et al. 2007; (15) Page et al. 2007; (16) Gomboc et al. 2008; (17) Jaunsen et al. 2008; (18) Bloom et al. 2009; (19) Rossi et al. 2008; (20) Racusin et al. 2008.
Download table as: ASCIITypeset image
3. RESULTS
To investigate the wavelength-dependence of dust extinction in the UV/optical/near-IR of the comoving frame and its effects on the afterglow SEDs, one needs to select the samples which have the necessary wavelength coverage for determining the dust extinction. The foreground (Galactic) extinction has been corrected for each burst. For those observations taken at slightly different epochs, we apply a correction using the temporal dependence of GRB afterglows Fν(t) ∝ t−α (where α is the decay index of the fitted light curve) and bring all values to the same epoch. To this end, we investigate the host galaxies of long-duration bursts for which a wealth of data on the afterglow are available. We build a sample composed of 33 long bursts. The sample is selected by requiring that (1) they are nearby or at a redshift z < 2, and (2) high-quality multiband (mainly UV/optical/near-IR) afterglow photometry is available. This GRB host galaxy sample spans a redshift interval 0.125 < z < 1.98, with a median value z ≃ 1.1. In Tables 1 and 2, we respectively tabulate the model parameters for fitting the afterglow SEDs using the MW, LMC, SMC extinction templates and the Drude approach. The fits are presented in Figures 1–11.

Figure 1. Upper panel (a): fitting the SED of the afterglow of GRB 970508 with the "Drude" approach (red) and the MW (black), LMC (blue), and SMC (green) templates for the GRB host extinction curve. Upper panel (b): comparison of the MW (black), LMC (blue), and SMC (green) extinction laws with that derived from the Drude approach (red). Upper panel (c): fitting the derived extinction curve (red solid line and black filled circles) with a mixture of amorphous silicate (cyan dotted line) and graphite dust (green dashed line). The blue solid line plots the resulting model extinction curve. Middle panel: same as the upper panel but for GRB 980703. Also shown in the middle panel (b) is the MW extinction curve of RV = 3.5 (dashed line). Bottom panel: same as the upper panel but for GRB 990123.
Download figure:
Standard image High-resolution image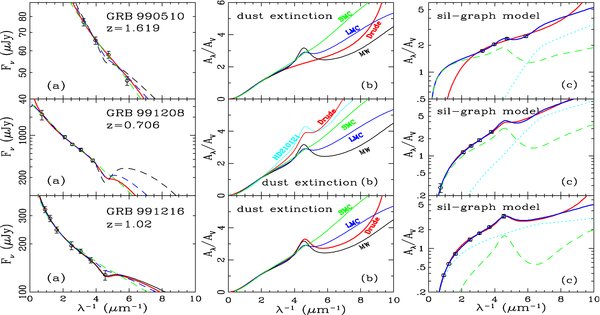
Figure 2. Same as Figure 1 but for GRB 990510, GRB 991208, and GRB 991216. Also shown in the middle panel (b) is the extinction curve of the high latitude translucent cloud toward HD 210121 (thin cyan line) which has the steepest far-UV rise ever observed in the Galaxy.
Download figure:
Standard image High-resolution image
Figure 3. Same as Figure 1 but for GRB 000911, GRB 010222, and GRB 010921.
Download figure:
Standard image High-resolution image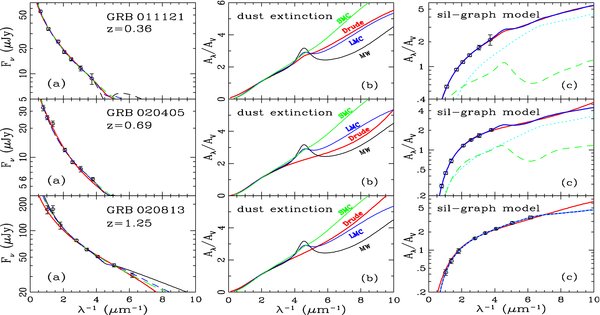
Figure 4. Same as Figure 1 but for GRB 011121, GRB 020405, and GRB 020813.
Download figure:
Standard image High-resolution image
Figure 5. Same as Figure 1 but for GRB 030226, GRB 030328, and GRB 030329.
Download figure:
Standard image High-resolution image
Figure 6. Same as Figure 1 but for GRB 040924, GRB 041006, and GRB 050318. Also shown in the upper panel (b) is the so-called "Calzetti" attenuation law of starburst galaxies (cyan line).
Download figure:
Standard image High-resolution image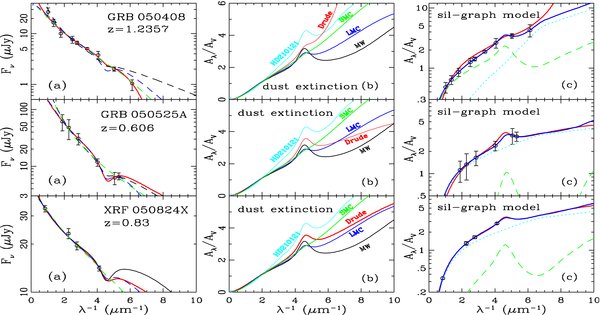
Figure 7. Same as Figure 1 but for GRB 050408, GRB 050525A, and XRF 050824X. Also shown in the upper panel (b), the middle panel (b), and the bottom panel (b) is the extinction curve of the high latitude translucent cloud toward HD 210121 (thin cyan line), which has the steepest far-UV rise ever observed in the Galaxy.
Download figure:
Standard image High-resolution image
Figure 8. Same as Figure 1 but for GRB 051111, GRB 060614, and GRB 060729. Also shown in the middle panel (b) is the "Calzetti" law (cyan line).
Download figure:
Standard image High-resolution image
Figure 9. Same as Figure 1 but for GRB 061121, GRB 061126, and GRB 070125. Also shown in the bottom panel (b) is the "Calzetti" law (cyan line).
Download figure:
Standard image High-resolution image
Figure 10. Same as Figure 1 but for GRB 070306, GRB 071003, and GRB 080319B. Also shown in the upper panel (b) is the "Calzetti" law (cyan line).
Download figure:
Standard image High-resolution image
Figure 11. Same as Figure 1 but for GRB 080330, GRB 080514B, and GRB 081008.
Download figure:
Standard image High-resolution imageGRB 970508. We constructed the afterglow SED (ICRCVBU) of GRB 970508 at redshift z ≈ 0.835 (Metzger et al. 1997a, 1997b), the second GRB for which an optical afterglow has been detected, with data from Galama et al. (1998) and Chary et al. (1998). The extinction in its host galaxy has been discussed by Reichart (1998), Wijers & Galama (1999), Stratta et al. (2004), Kann et al. (2006), Starling et al. (2007), and others. Stratta et al. (2004) favored a MW-type extinction with AV ≈ 0.27 ± 0.16 mag. Kann et al. (2006) found AV ≈ 0.38 ± 0.11 mag for the preferred MW-type extinction. Starling et al. (2007) argued against any significant extinction (and as a result they cannot distinguish between different extinction laws). In this work, the best-fit model is provided by a MW-type extinction of AV ≈ 0.15 ± 0.04 mag but with a more prominent 2175 Å bump (see Figure 1). If we neglect the U band photometry, the Drude model would result in an extinction law similar to that of the SMC with AV ≈ 0.49 ± 0.11 mag.
GRB 980703. We constructed the SED (KHJICRCVB) of GRB 980703 at z ≈ 0.966 (Djorgovski et al. 1998) with data from Vreeswijk et al. (1999a) at ∼1.2 days after the burst. Kann et al. (2006) derived AV ≈ 1.32 ± 0.59 mag for the preferred SMC-type extinction. In this work, the Drude model results in AV ≈ 1.25 ± 0.45 mag and an extinction law similar to that of the MW with RV = 3.5 (i.e., the extinction curve has a weaker 2175 Å bump and flatter far-UV rise than that of the Galactic diffuse interstellar medium (ISM) of RV ≈ 3.1; see Cardelli et al. 1989) characteristics of denser regions (see Figure 1). The extinction appears to decrease with time (which was regarded as an indication of dust destruction by the burst; e.g., see Waxman & Draine 2000; Draine & Hao 2002; Perna et al. 2003): while Castro-Tirado et al. (1999) estimated AV ≈ 2.2 mag at ∼0.9 days postburst, Vreeswijk et al. (1999a) estimated AV ≈ 1.5 ± 0.11 mag at ∼1.2 days and Bloom et al. (1998) derived AV ≈ 0.9 ± 0.2 mag at ∼5.3 days, all assuming a MW-type extinction law. However, using the SMC extinction as a template, Starling (2008) examined this burst in detail and did not find any evidence of variable extinction.
GRB 990123. We constructed the SED (KHICRCVBU) of GRB 990123 at z ≈ 1.60 (Akerlof et al. 1999) with data from Galama et al. (1999). Kann et al. (2006) argued for a SMC-type extinction law with very little extinction AV ≈ 0.04 ± 0.05 mag, while Savaglio et al. (2003) estimated AV ≈ 1.1 mag from metal column abundances. We found AV ≈ 0.30 ± 0.06 mag with an extinction law similar to that of the MW but lacking the 2175 Å extinction bump (see Figure 1).8
GRB 990510. We constructed the SED (ICRCVB) of GRB 990510 at z ≈ 1.619 (Vreeswijk et al. 1999b) with data from Stanek et al. (1999) and Beuermann et al. (1999). Stanek et al. (1999) suggested that the deviation of the B-band flux from the Fν ∝ ν−0.46 ± 0.08 power law fitted to the VRCIC fluxes may indicate an extinction of AV ≈ 0.45 mag of the host galaxy or an intervening galaxy at z ≈ 1.62. Kann et al. (2006) derived AV ≈ 0.18 ± 0.24 mag and a SMC-type extinction law. The Drude model also suggests a featureless extinction curve (with AV ≈ 0.37 ± 0.12 mag) like that of the SMC, but not as steep (see Figure 2).
GRB 991208. We constructed the SED (KICRCVB) of GRB 991208 at z ≈ 0.706 (Dodonov et al. 1999; Djorgovski et al. 1999) with data from Castro-Tirado et al. (2001) and Chary et al. (2002). Kann et al. (2006) found that the MW-type extinction with AV ≈ 0.80 ± 0.29 mag provides a better fit to the observed afterglow SED than the LMC and SMC models. The Drude approach derives an extinction law with a weak 2175 Å bump and a far-UV rise even steeper than that of the SMC (see Figure 2), similar to the extinction curve of the high latitude translucent cloud toward HD 210121 (Larson et al. 1996; Li & Greenberg 1998), which has the steepest far-UV rise in the Galaxy. This model requires AV ≈ 0.47 ± 0.15 mag.
GRB 991216. We constructed the SED (KHJICRCVB) of GRB 991216 at z ≈ 1.02 (Vreeswijk et al. 1999c) with data from Garnavich et al. (2000) and Halpern et al. (2000). The Drude approach derives AV ≈ 0.14 ± 0.05 mag and an extinction curve very similar to that of the MW (see Figure 2). The presence of the 2175 Å bump in its extinction curve was supported by the detection of the broad absorption feature centered at ∼2360 Å (Vreeswijk et al. 2006). Kann et al. (2006) also found that the MW-type extinction (with AV ≈ 0.13 ± 0.08 mag) is preferred.
GRB 000911. We constructed the SED (KSJICRCVB) of GRB 000911 at z ≈ 1.058 (Price et al. 2002a) with data from Lazzati et al. (2001) and Price et al. (2002a). Masetti et al. (2005) found a SMC-type extinction of AV ≈ 0.32 mag, while Kann et al. (2006) found the MW-type extinction of AV ≈ 0.27 ± 0.32 mag provides a slightly better fit than the LMC and SMC models. The Drude approach results in AV ≈ 0.32 ± 0.10 mag and an extinction curve very similar to that of the MW (see Figure 3). If we ignore the B-band photometry, a SMC-type extinction would be preferred.
GRB 010222. We constructed the SED (KJICRCVBU) of GRB 010222 at z ≈ 1.477 (Jha et al. 2001) with data from Masetti et al. (2001). The Drude approach derives AV ≈ 0.29 ± 0.08 mag with an extinction curve similar to that of the MW but with the 2175 Å bump removed (see Figure 3). In literature, both low and high AV values were suggested: (1) using the extinction curve model of Reichart (2001),9 Lee et al. (2001) found AV < 0.06 mag (with β = 0.75 fixed) and Galama et al. (2003) found AV ≈ 0.11 ± 0.02 mag; (2) Kann et al. (2006) were in favor of a SMC-type extinction with AV ≈ 0.14 ± 0.08 mag; and (3) Savaglio et al. (2003) argued for a much higher extinction of AV ≈ 0.7 mag from a study based on the depletions of the dust-forming elements Fe and Si.
GRB 010921. We constructed the SED (i*r*RCVBU) of GRB 010921 at z ≈ 0.45 (Bloom et al. 2001) with data from Price et al. (2002b). Kann et al. (2006) preferred a MW-type extinction with AV ≈ 0.81 ± 1.21 mag. Price et al. (2003) inferred a LMC-type extinction of AV ≈ 1 mag. The Drude approach results in an extinction curve very similar to that of the SMC (see Figure 3) with AV ≈ 1.02 ± 0.33 mag.
GRB 011121. We constructed the SED (KJICRCVBU) of GRB 011121 at z ≈ 0.36 (Infante et al. 2001) with data from Garnavich et al. (2003) and Greiner et al. (2003c). While Kann et al. (2006) preferred a SMC-type extinction with AV = 0.39 ± 0.14 mag, the Drude approach derives AV ≈ 0.56 ± 0.17 mag and an extinction curve very similar to that of the LMC but with a much weaker 2175 Å bump (see Figure 4).10
GRB 020405. We constructed the SED (KSHJICRCVB) of GRB 020405 at z ≈ 0.69 (Masetti et al. 2002) with data from Masetti et al. (2003). While Stratta et al. (2005) argued for a flat, gray extinction curve with AV ≈ 2.3 mag based on a comparison of the X-ray and the optical data, Kann et al. (2006) found a moderate extinction of AV ≈ 0.25 mag for the SMC, LMC, and MW template extinction laws. The Drude approach infers a featureless extinction curve steeply rising toward the far-UV with AV ≈ 0.72 ± 0.14 mag (see Figure 4).
GRB 020813. We constructed the SED (KHJICRCVBU) of GRB 020813 at z ≈ 1.25 (Price et al. 2002c) with data from Barth et al. (2003). The Drude approach infers an extinction law just like that of the LMC but with the 2175 Å bump removed (see Figure 4). The inferred extinction AV ≈ 0.34 ± 0.12 mag is higher than that derived by Kann et al. (2006; AV ≈ 0.12 ± 0.07 mag for SMC-type extinction), by Covino et al. (2003; AV ≈ 0.12 ± 0.04 mag for MW-type extinction), and by Savaglio & Fall (2004; AV < 0.19 mag from an analysis of the metal column densities).
GRB 030226. We constructed the SED (KHJICRCVB) of GRB 030226 at z ≈ 1.98 (Greiner et al. 2003a) with data from Klose et al. (2004). Kann et al. (2006) found negligible extinction (AV ≈ 0.06 ± 0.06 mag for SMC-type extinction), in consistent with Klose et al. (2004). The Drude approach infers AV ≈ 0.24 ± 0.04 mag and an extinction law resembling that of the LMC but with the 2175 Å bump removed and a steeper far-UV rise at λ−1 > 8 μm−1 (see Figure 5).
GRB 030328. We constructed the SED (ICRCVBU) of GRB 030328 at z ≈ 1.52 (Martini et al. 2003) with data from Maiorano et al. (2006). From the Fe ii column density derived from the VLT optical spectrum of its afterglow, Maiorano et al. (2006) estimated AV < 0.1 mag. Kann et al. (2006) fitted the afterglow SED with a SMC-type extinction of AV ≈ 0.05 ± 0.15 mag. The Drude approach derives AV ≈ 0.20 ± 0.06 mag with an extinction curve just like that of the MW but with the 2175 Å bump removed (see Figure 5).
GRB 030329. We constructed the SED (HJICRCVBU) of GRB 030329 at z ≈ 0.168 (Greiner et al. 2003b) with data from Gorosabel et al. (2005). Bloom et al. (2004) found AV ≈ 0.30 ± 0.03 mag (with β = 0.5 fixed; AV ≈ 0.94 ± 0.24 mag if β was treated as a free parameter) assuming a MW-type extinction. Kann et al. (2006) derived AV ≈ 0.54 ± 0.22 mag (β ≈ 0.30 ± 0.22) with a SMC-type extinction. The Drude approach results in AV ≈ 0.30 ± 0.12 mag (β ≈ 0.60 ± 0.23) with a featureless extinction curve which is steeper than the MW curve but not as steep as that of the LMC and the SMC (see Figure 5).
GRB 040924. We constructed the SED (KICRCV) of GRB 040924 at z ≈ 0.859 (Wiersema et al. 2004) with data from Silvey et al. (2004). Due to the lack of data at wavelengths bluer than the V band, Kann et al. (2006) found that the MW, LMC, and SMC extinction laws all provide excellent fits to the afterglow SED with AV ≈ 0.21 ± 0.62 mag and β ≈ 0.59 ± 0.61 (MW), AV ≈ 0.22 ± 0.62 mag and β ≈ 0.58 ± 0.64 (LMC), and AV ≈ 0.16 ± 0.44 mag and β ≈ 0.63 ± 0.48 (SMC). The Drude approach yields a featureless, relatively flat extinction curve with AV ≈ 0.36 ± 0.10 mag and β ≈ 0.40 ± 0.14 (see Figure 6). The derived extinction curve is almost identical to that of the so-called "Calzetti" attenuation law of starburst galaxies. This also provides another piece of evidence for the advantage of the Drude approach: if the "true" extinction curve of a GRB host happens to resemble the "Calzetti" law which is also widely used as a template, the "Drude" approach will allow us to restore it.
GRB 041006. We constructed the SED (HICRCVB) of GRB 041006 at z ≈ 0.716 (Price et al. 2004) with data from Soderberg et al. (2006). As shown in Figure 6, both the Drude approach and the approach assuming a template extinction law (MW, LMC, and SMC) closely fit the afterglow SED (as due to the lack of data at wavelengths bluer than the B band). The Drude approach infers an extinction curve similar to that of the LMC but with a steeper far-UV rise at λ>7.5 μm−1 and without the 2175 Å bump. This model yields AV ≈ 0.15 ± 0.04 mag and β ≈ 0.32 ± 0.12, in comparison with that of Kann et al. (2006): AV ≈ 0.11 ± 0.23 mag and β ≈ 0.36 ± 0.27 (MW), AV ≈ 0.14 ± 0.28 mag and β ≈ 0.32 ± 0.33 (LMC), and AV ≈ 0.12 ± 0.23 mag and β ≈ 0.34 ± 0.30 (SMC).
GRB 050318. We constructed the SED (VBU, UVW1, UVM2, UVW2) of GRB 050318 at z ≈ 1.44 (Berger & Mulchaey 2005) with data from Still et al. (2005) and Perri et al. (2005). Perri et al. (2005) and Still et al. (2005) both derived β ≈ 1.1 ± 0.1. The Drude approach yields AV ≈ 1.51 ± 0.54 mag and β ≈ 1.17 ± 0.42, with an extinction curve similar to that of the SMC (see Figure 6).
GRB 050408. We constructed the SED (KHJIRVBU) of GRB 050408 at z ≈ 1.2357 (Prochaska et al. 2005) with data from Wiersema et al. (2005), Milne et al. (2005), Kahharov et al. (2005), Flasher et al. (2005a), Foley et al. (2006), and de Ugarte Postigo et al. (2007). The Drude approach yields AV ≈ 0.47 ± 0.08 mag (and β ≈ 0.62 ± 0.10) and an extinction curve even steeper than that of the SMC and exhibiting a weak 2175 Å bump, as probably revealed by the curvature in the UBV fluxes (see Figure 7). In contrast, de Ugarte Postigo et al. (2007) and Kann et al. (2007) were in favor of a SMC-type extinction with AV ≈ 0.74 ± 0.15 mag and β ≈ 0.28 ± 0.33. The extinction curve derived here is steeper than that of the MW with RV = 2.5 but not as steep as that of HD 210121.
GRB 050525A. We constructed the SED (VBU, UVW1, UVM2, UVW2) of GRB 050525A at z ≈ 0.606 (Foley et al. 2005) with data from Cobb & Bailyn (2005), Yanagisawa et al. (2005), Kaplan et al. (2005), Flasher et al. (2005b), Klotz et al. (2005), Blustin et al. (2006), and Della Valle et al. (2006a). The Drude approach yields AV ≈ 0.85 ± 0.23 mag and β ≈ 0.63 ± 0.18 at ∼200 s postburst and an extinction curve lying in between that of HD 210121 and that of the MW with RV = 2.5 (see Figure 7). The derived extinction is much higher than that of Schady et al. (2007; AV ≈ 0.16 ± 0.03 mag), Kann et al. (2007; AV ≈ 0.32 ± 0.20 mag), and Blustin et al. (2006; AV ≈ 0.23 ± 0.15 mag).
XRF 050824X. We constructed the SED (KIRB) of XRF 050824X at z ≈ 0.83 (Fynbo et al. 2005) with data from Schady et al. (2007a) and Sollerman et al. (2007). The Drude approach deduces AV ≈ 0.23 ± 0.07 mag and β ≈ 0.21 ± 0.04 with an extinction curve lying in between that of HD 210121 and that of the MW with RV = 2.5 (see Figure 7), similar to GRB 050525A. Assuming a SMC-type extinction, Kann et al. (2007) found AV ≈ 0.14 ± 0.13 mag and β ≈ 0.45 ± 0.18 (but Sollerman et al. 2007 derived AV ≈ 0.4 ± 0.2 mag and β ≈ 0.56 ± 0.04). We note that the limited wavelength coverage of these data does not really allow one to discern the SMC, LMC, MW, and Drude extinction.
GRB 051111. We constructed the SED (KSHJIRVBU, UVW1, UVM2, UVW2) of GRB 051111 at z ≈ 1.55 (Hill et al. 2005) with data from Bloom (2005) and Yost et al. (2007). Butler et al. (2006) and Kann et al. (2007) were both in favor of a SMC-type extinction, with AV ≈ 0.23 ± 0.07 mag and AV ≈ 0.19 ± 0.02 mag, respectively. The Drude approach deduces AV ≈ 0.38 ± 0.10 mag and β ≈ 0.37 ± 0.10 with an extinction curve resembling that of the SMC but with a very weak 2175 Å bump (see Figure 8). If we ignore the curvature of the RVB photometry, we would obtain a SMC-type extinction law.
GRB 060614. We constructed the SED (RVBU, UVW1, UVM2, UVW2) of GRB 060614 at z ≈ 0.125 (Price et al. 2006) with data from Della Valle et al. (2006b) and Mangano et al. (2007). While Mangano et al. (2007) derived AV ≈ 0.05 mag with a SMC-like extinction law, the Drude approach infers AV ≈ 0.42 ± 0.18 mag and β ≈ 0.46 ± 0.22 with a featureless, relatively flat extinction curve, similar to that of the "Calzetti" law (see Figure 8).
GRB 060729. We constructed the SED (VBU, UVW1, UVM2, UVW2) of GRB 060729 at z ≈ 0.54 (Thoene et al. 2006) with data from Grupe et al. (2006, 2007). The Drude approach fits the afterglow SED at ∼100 ks postburst with an extinction curve resembling that of the LMC but with a steeper far-UV rise at λ−1 > 7 μm−1 (see Figure 8). This model requires AV ≈ 0.45 ± 0.26 mag (and β ≈ 0.49 ± 0.17).
GRB 061121. We constructed the SED (Ri'VBU, UVW1, UVM2, UVW2) of GRB 061121 at z ≈ 1.314 (Bloom et al. 2006) with data from Yost et al. (2006), Melandri et al. (2006), and Page et al. (2007). The Drude approach infers AV ≈ 1.10 ± 0.44 mag with an extinction curve resembling that of the MW but with a stronger 2175  bump (see Figure 9).11 The MW-type extinction model fits the 2175 Å bump region very well, but fails at λ−1 < 3.7 μm−1. If we ignore both the U and B bands, we would then prefer a SMC-type extinction curve.
GRB 061126. We constructed the SED (KHJIRVBU, UVW1, UVM2) of GRB 061126 at z ≈ 1.1588 with data from Perley et al. (2008a). With a priori assumption of template extinction laws with a fixed wavelength dependence, Kann et al. (2007) found that the SMC-type extinction provides the best fit with AV ≈ 0.095 ± 0.055 mag, while Perley et al. (2008a) argued that a strong gray extinction may be responsible for the difference between the faint optical subluminosity and the bright X-ray afterglow of this burst. The Drude approach infers AV ≈ 0.03 ± 0.01 mag with an extinction curve just like that of the MW but with the 2175 Å bump removed (see Figure 9).
GRB 070125. We constructed the SED (KSJHIRVBU) of GRB 070125 at z ≈ 1.547 (Fox et al. 2007) with data from Updike et al. (2008). Due to the lack of the 2175 Å bump, Updike et al. (2008) argued for a SMC-type extinction with AV ≈ 0.11 mag. The Drude approach infers AV ≈ 0.45 ± 0.13 mag with a featureless, relatively flat extinction curve resembling that of the "Calzetti" law (see Figure 9).
GRB 070306. We constructed the afterglow SED (RJHK) of GRB 070306 at z ≈ 1.4959 (Jaunsen et al. 2008) with data from Jaunsen et al. (2008). Jaunsen et al. (2008) explored the overall extinction of the host galaxy by reddening a starburst galaxy template SED (Kinney et al. 1996) with various extinction laws. They found the upper limit of AV in the range ∼0.1–0.5 mag, with the best fit given by a MW-type extinction (AV ≈ 0.17 mag). However, the afterglow of this burst seems to be highly extinguished: while it was not detected in the optical wavelengths, a near-IR afterglow was clearly detected. Jaunsen et al. (2008) fitted the HK fluxes and the RJ upper limits of the afterglow of this burst, by requiring the intrinsic spectral slope of the near-IR afterglow βo to relate to that of the X-ray afterglow βx through βo = βx − 0.5 (i.e., assuming a broken power law with the cooling break occurring between the near-IR and X-ray bands). They found AV ≈ 5.5 ± 0.6 mag and a SMC-type extinction. The Drude approach infers AV ≈ 1.40 ± 0.32 mag (and β ≈ 2.60 ± 0.43) and a flat extinction law (see Figure 10). The major reason why we obtain a much lower AV is that our β value is higher than that of Jaunsen et al. (2008) who fixed it to be β = 0.7. We do not want to overinterpret our results since we only have four data points among which two of them are just upper limits. We will investigate this burst in a separate paper, with special attention paid to the "true" β value.
GRB 071003. We constructed the SED (ugVrRiIz) of GRB 071003 at z ≈ 1.60435 with data from Perley et al. (2008b). While Perley et al. (2008b) found a SMC-type extinction and AV ≈ 0.21 mag, the Drude approach infers AV ≈ 0.51 ± 0.14 mag and an extinction law resembling that of the MW but with a much weaker 2175 Å bump and a steeper far-UV rise at λ−1 > 8.5 μm−1 (see Figure 10).
GRB 080319B. We constructed the SED (KHJIRVBU, UVW1, UVM2, UVW2) of GRB 080319B at z ≈ 0.937 (Vreeswijk et al. 2008) with data from Bloom et al. (2009). While Bloom et al. (2009) were in favor of a SMC-type extinction law with AV ≈ 0.07 ± 0.02 mag, the Drude approach deduces AV ≈ 0.05 mag and a featureless extinction law even steeper than that of the SMC (see Figure 10).
GRB 080330. We constructed the SED (KHJIRVB) of GRB 080330 at z ≈ 1.51 (Malesani et al. 2008) with data from Cobb (2008a). The Drude approach derives AV ≈ 0.41 ± 0.12 mag and an extinction law closely resembling that of the MW but lacking the 2175 Å bump (see Figure 11).
GRB 080514B. We constructed the SED (NEWFIRM J, GROND J, GROND z', IC, Gemini i, GROND i, RC, GROND r', GROND g', B, and U) of GRB 080514B at z ≈ 1.80 (Rossi et al. 2008) with data from Rossi et al. (2008). While Rossi et al. (2008) found no evidence for dust in the host galaxy, the Drude approach infers AV ≈ 0.24 ± 0.06 mag and an extinction law resembling that of the MW but with a much weaker 2175 Å bump and a steeper far-UV rise at λ−1 > 9 μm−1 (see Figure 11).
GRB 081008. We constructed the SED (KHJIRB) of GRB 081008 at z ≈ 1.9685 (D'Avanzo et al. 2008) with data from Cobb (2008b). The Drude approach infers AV ≈ 0.31 ± 0.23 mag and an extinction law resembling that of the LMC but lacking the 2175 Å bump and with a steeper far-UV rise at λ−1 > 6.5 μm−1 (see Figure 11).
4. DISCUSSION
Unlike the models based on a pre-assumption of a specific extinction law (which as a result restricts the derived extinction laws to one of the adopted templates), the Drude approach is more flexible in determining the true wavelength dependence of the host extinction. As shown in Section 3, the Drude approach reveals a wide diversity of extinction laws for the sample of 33 GRBs.
- 1.Some bursts exhibit an extinction law more or less like that of the MW (RV ≈ 3.1 for GRB 991216 and 000911, and RV > 3.5 for GRB 980703), LMC (GRB 011121 but with a weaker 2175 Å bump), and SMC (GRB 010921, 050318 and 051111)—this demonstrates that if the extinction law of a GRB host happens to resemble one of the widely adopted template extinction laws (e.g., the MW, LMC, and SMC laws), the Drude approach is able to restore the template-like true extinction law.
- 2.Some bursts exhibit an extinction law just like that of the MW (with RV ≈ 3.1) but (1) with a stronger 2175 Å bump (GRB 970508 and 061121), (2) with a much weaker 2175 Å bump (GRB 071003 and 080514B), or (3) simply with the 2175 Å bump completely removed (GRB 990123, 010222, 030328, 061126, and 080330).
- 3.Some bursts exhibit an extinction law like that of the high Galactic latitude translucent cloud HD 210121 (Larson et al. 1996; Li & Greenberg 1998) or lying in between that of HD 210121 and that of the MW with RV = 2.5, which is characteristics of a weak 2175 Å bump and a steep far-UV rise (GRB 991208, 050408, 050525A, and XRF 050824X).
- 4.Some bursts exhibit a featureless extinction law which steeply rises toward the far-UV (GRB 990510, 020405, 020813, 030226, 030329, 041006, 060729, 080319B, and 081008), with a varying degree of steepness.
- 5.Some bursts exhibit a featureless, flat extinction law (GRB 040924, 060614, 070125, and 070306). Some of them are similar to the so-called "Calzetti" attenuation law of starburst galaxies (GRB 040924, 060614, and 070125).
The extinction quantities (see Figure 12), the shapes of the deduced extinction curves, and the presence or absence of the 2175 Å bump do not seem to correlate with redshifts (more details will be presented in S. L. Liang & A. Li 2010, in preparation).
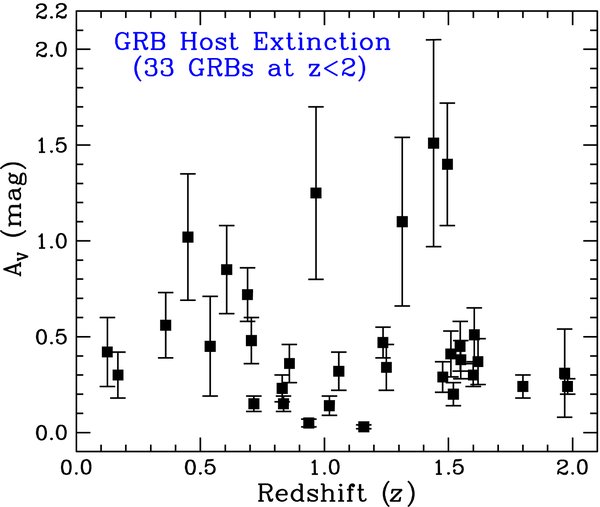
Figure 12. Derived host galaxy visual extinction AV (in the source frame) as a function of redshift z. For the 33 bursts at z < 2 discussed in this work, we do not see any strong evidence for the dependence of AV on z.
Download figure:
Standard image High-resolution imageFor bursts lacking the 2175 Å bump, models based on a priori assumption of specific template extinction laws often infer a SMC-type extinction with a small AV. As demonstrated in this work, among the 19 GRBs (of the entire sample of 33 bursts) which lack the 2175 Å bump, only three bursts (GRB 010921, 050318, and 051111) have an extinction curve similar to that of the SMC. The extinction curves of the other 16 bursts display a wide range of shapes, ranging from being relatively flat to very steep. The AV values derived from the Drude approach is generally ∼2–5 times larger than that derived from assuming a SMC template extinction law provided that the "true" extinction law inferred from the Drude approach is not as steep as that of the SMC.
In Figure 13(a), we plot the distribution of AV. We see that the distribution of AV peaks at ∼0.4 mag, with a strong clustering toward relative low extinction (AV < 0.6 mag), which is higher than that of Kann et al. (2006; AV < 0.2 mag) who were in favor of a SMC-type extinction. This also indicates that if the "true" extinction law of a GRB host galaxy is not like that of the SMC, one would underestimate AV by taking the SMC extinction law to be the template. We should note that the distribution of AV inferred here may not reflect the "true" extinction distribution as the sample selected here is biased to bursts with bright optical afterglows and high-quality photometry data (so highly extinguished bursts like dark bursts are unlikely included in this sample).
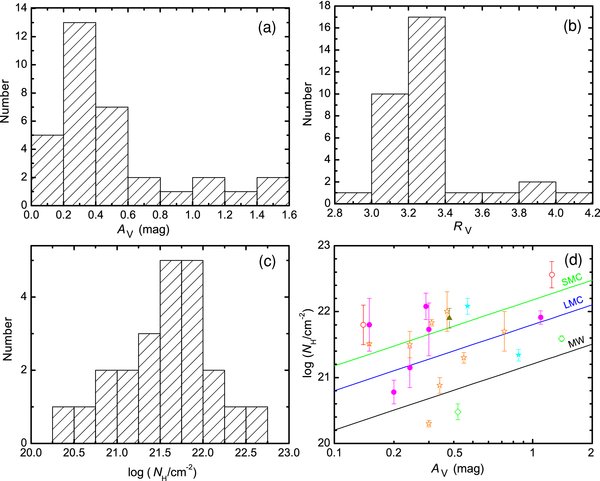
Figure 13. (a) Distribution of the derived host galaxy visual extinction AV. (b) Distribution of the total-to-selective extinction ratio RV ≡ AV/E(B − V). (c) Distribution of the hydrogen column densities NH along the lines of sight toward the bursts in their host galaxies. (d) Dust-to-gas ratios in the host galaxies along the lines of sight toward 25 GRBs. Also plotted are that of the MW, LMC, and SMC. Open circles: those bursts with a MW-type extinction; open triangles: those with a LMC-type extinction; filled triangles: those with a SMC-type extinction; filled circles: those with a MW-type extinction but with a very weak (or lacking) 2175 Å bump; open stars: those with a featureless, steep extinction curve; filled stars: those with a steep far-UV rise and a weak 2175 Å bump; open diamonds: those with a flat curve.
Download figure:
Standard image High-resolution imageIn Figure 13(b), we show the distribution of RV calculated from the deduced extinction curves. We see that most of these bursts have RV in the range of ∼3.0–3.4. But the actual extinction curves differ substantially from predicted from the CCM formula using these RV values (needless to mention the absence of the 2175 Å bump of which the presence is predicted from the CCM formula). Even the very steep extinction curve of GRB 080319B (see Figure 10) has RV ≈ 3.06. This is not surprising since the CCM formula is known to be valid only for the Galactic sightlines (e.g., see Gordon et al. 2003).
We select a sample of 25 GRBs having known hydrogen column densities  which range from 1.0 × 1019 cm−2 to 1.0 × 1023 cm−2 (see Kann et al. 2006 for references). In Figure 13(c), we show the distribution of NH for these bursts. We see that the majority of these bursts have NH in the range of ∼1.0 × 10²¹–1.5 × 1022 cm−2. To explore the dust-to-gas ratios of these bursts, we compare AV with NH in Figure 13(d). Also plotted in Figure 13(d) are the extinction-to-gas ratios of the MW, LMC, and SMC.12 We see that the majority of these bursts have a dust-to-gas ratio smaller than that of the MW, consistent with previous studies (e.g., see Galama & Wijers 2001; Stratta et al. 2004; Kann et al. 2006).13 But ∼40% of the bursts have a dust-to-gas ratio comparable to or higher than that of the LMC. In general, the dust-to-gas ratio derived here is higher than deduced from previous studies which estimated AV from fitting the GRB afterglow SEDs with a SMC-type extinction law. Finally, the dust-to-gas ratio does not seem to correlate with the shape of the extinction curve inferred from the Drude approach.
We fit the inferred extinction curves using a mixture of spherical amorphous silicate and graphite dust each with an exponential-cutoff power-law size distribution (e.g., see Kim et al. 1994)
where the lower (upper) cutoff size amin (amax) is taken to be 50 Å (1 μm) for both silicate and graphite dust; the power-law indices αsil and αgra, and the exponential-cutoff sizes ac,sil and ac,gra are treated as free parameters; Asil and Agra are related to the abundance of each species; and Csilext (Cgraext) is the extinction cross section of silicate (graphite) dust. As shown in Figures 1–11, this simple dust model closely fits the extinction curves of all 33 bursts. In Table 3, we present the model parameters.
Table 3. Dust Size Distributions for the Extinction Curves Derived from the "Drude" Approach and Modeled as a Mixture of Silicate and Graphite Grains
| GRB | Asil | αsil | ac,sil (μm) | Agra | αgra | ac,gra (μm) | χ2/Nobs |
|---|---|---|---|---|---|---|---|
| 970508 | 1.56E4 | 2.07 | 0.09 | 7.64 | 2.89 | 0.01 | 0.97 |
| 980703 | 6.17E3 | 2.13 | 0.11 | 9.73E−6 | 3.67 | 0.03 | 0.02 |
| 990123 | 4.50E−4 | 3.44 | 0.73 | 3.83E8 | 1.34 | 0.02 | 1.23 |
| 990510 | 0.03 | 3.26 | 0.04 | 0.10 | 3.00 | 0.95 | 4.20 |
| 991208 | 2.50E−4 | 3.63 | 0.04 | 1.00E−3 | 3.39 | 0.16 | 1.41 |
| 991216 | 0.03 | 3.12 | 0.27 | 1.93 | 2.86 | 0.02 | 1.95 |
| 000911 | 509.19 | 2.33 | 0.12 | 1.20E−3 | 3.40 | 0.02 | 0.04 |
| 010222 | 1.60E−4 | 3.52 | 0.72 | 2.87E9 | 1.10 | 0.03 | 2.11 |
| 010921 | 0.14 | 3.07 | 0.09 | 7.54E−4 | 3.46 | 0.79 | 2.53 |
| 011121 | 0.01 | 3.30 | 0.14 | 2.00E−3 | 3.24 | 0.68 | 0.07 |
| 020405 | 1.39E−4 | 3.55 | 0.41 | 1.97E8 | 1.34 | 0.03 | 0.56 |
| 020813 | 0.11 | 3.09 | 0.20 | 1.22E3 | 2.65 | 0.02 | 3.50 |
| 030226 | 8.85E−5 | 3.63 | 0.10 | 2.05E5 | 1.85 | 0.06 | 2.54 |
| 030328 | 0.03 | 3.19 | 0.07 | 0.08 | 3.00 | 0.83 | 2.89 |
| 030329 | 5.60E−5 | 3.62 | 0.17 | 1.99E3 | 2.24 | 0.06 | 1.25 |
| 040924 | 0.05 | 3.06 | 0.22 | 3.50E8 | 1.29 | 0.03 | 0.45 |
| 041006 | 2.40E−4 | 3.43 | 0.03 | 167.7 | 2.47 | 0.06 | 4.13 |
| 050318 | 3.55E−3 | 3.62 | 0.89 | 108.9 | 2.50 | 0.02 | 3.05 |
| 050408 | 4.04E−7 | 3.96 | 0.08 | 5.42E−6 | 3.42 | 0.84 | 4.60 |
| 050525A | 0.01 | 3.20 | 0.39 | 176.0 | 3.16 | 0.02 | 0.23 |
| 050824X | 0.01 | 3.24 | 0.27 | 0.17 | 3.03 | 0.02 | 0.08 |
| 051111 | 9.42E−4 | 3.44 | 0.35 | 5.01E8 | 1.45 | 0.01 | 0.23 |
| 060614 | 33.61 | 2.55 | 0.14 | 3.56E7 | 1.42 | 0.03 | 0.06 |
| 060729 | 5.38E−9 | 4.16 | 0.72 | 1.46 | 2.81 | 0.18 | 3.88 |
| 061121 | 0.06 | 3.05 | 0.33 | 0.01 | 3.34 | 0.02 | 0.09 |
| 061126 | 0.10 | 3.02 | 0.19 | 5.27 | 2.65 | 0.08 | 2.22 |
| 070125 | 0.07 | 3.06 | 0.29 | 145.7 | 2.35 | 0.03 | 0.05 |
| 070306 | 9.42E−3 | 3.17 | 1.00 | 0.045 | 2.94 | 0.10 | 4.73 |
| 071003 | 7.08E−4 | 3.40 | 0.64 | 181.7 | 2.44 | 0.04 | 0.75 |
| 080319B | 9.86E−5 | 3.76 | 0.02 | 5.79E−4 | 3.43 | 0.22 | 2.36 |
| 080330 | 0.02 | 3.14 | 0.21 | 1.35E11 | 0.80 | 0.03 | 1.00 |
| 080514B | 3.69E−3 | 3.27 | 0.47 | 0.81 | 2.80 | 0.08 | 0.80 |
| 081008 | 0.01 | 3.22 | 0.03 | 2.40E−3 | 3.13 | 0.91 | 0.90 |
Download table as: ASCIITypeset image
In Figure 14, we plot the mass fractions of graphite dust of all 33 bursts as a function of redshift. It appears that the relative abundances of graphite to silicate are in general lower than that of the MW diffuse ISM14 and do not seem to correlate with the redshifts of GRB hosts. In Figure 15, we plot the mean dust sizes of all 33 bursts as a function of redshift.15 Again, there is no clear evidence for the dependence of 〈a〉 on z. These issues will be explored in more detail in a subsequent paper (S. L. Liang & A. Li 2010, in preparation).
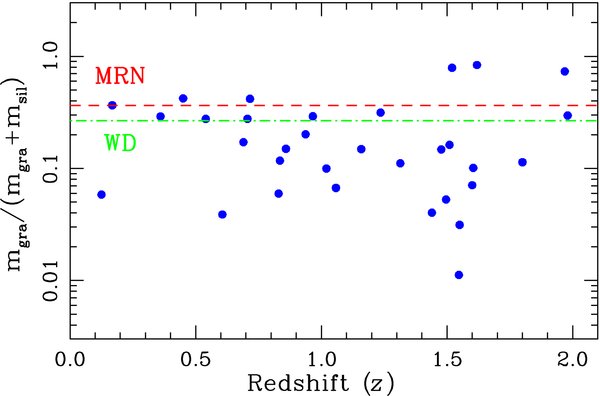
Figure 14. Mass fractions of graphite dust as a function of redshift z for all 33 bursts at z < 2. Also shown are the mass fractions of graphite of the MRN silicate–graphite model (red dashed line; Mathis et al. 1977) and the WD silicate–graphite–polycyclic aromatic hydrocarbon model (green dot-dashed line; Weingartner & Draine 2001).
Download figure:
Standard image High-resolution image
Figure 15. Mass-weighted mean dust sizes as a function of redshift z. Also shown are the mean dust sizes of the MRN silicate–graphite model (red dashed line; Mathis et al. 1977) and the WD silicate–graphite–polycyclic aromatic hydrocarbon model (green dot-dashed line; Weingartner & Draine 2001).
Download figure:
Standard image High-resolution image5. CONCLUSION
We have derived the quantities and wavelength dependencies of the dust extinction along the lines of sight toward 33 nearby GRBs (with z < 2). This is achieved through fitting their afterglow SEDs using the Drude approach. This method does not require a priori assumption of a specific extinction law and therefore allows us to possibly reveal the "true" extinction. The deduced extinction curves display a wide diversity of shapes, ranging from relatively flat curves to curves which are featureless and steeply rise toward the far-UV, and from curves just like that of the MW, LMC, and SMC (which are widely used as extinction templates) to curves resembling that of the MW and the LMC but lacking the 2175 Å bump. The visual extinction AV derived from the Drude approach is generally larger by a factor of ∼2–5 than that inferred by assuming a SMC-type extinction law. The standard silicate–graphite interstellar grain model closely reproduces the extinction curves of all 33 GRBs host galaxies, irrespective of their redshifts. No evidence is found for the evolution of the dust extinction, dust sizes, and relative abundances of silicate to graphite on redshifts.
We thank the anonymous referee for his/her very helpful comments and suggestions. We are supported in part by a NASA/Swift Theory Program, a NASA/Chandra Theory Program, and the NSFC Outstanding Oversea Young Scholarship.
Footnotes
- 3
Dark bursts are those events with no detected optical afterglow or with detected optical flux significantly suppressed compared with that expected from the observed X-ray afterglow (Groot et al. 1998; Jakobsson et al. 2004; van der Horst et al. 2009). Even in the Swift era, despite deep and prompt searches, an appreciable fraction (∼50%) of the bursts are identified as dark (e.g., see Melandri et al. 2008; Cenko et al. 2009; Perley et al. 2009; Zheng et al. 2009). The optical darkness of GRB afterglows is largely attributed to the extinction of dust local to the GRB host galaxies (Cenko et al. 2009; Perley et al. 2009).
- 4
- 5
Due to the sparsity of their photometric data, for some bursts the number of model parameters Npara exceeds the number of data points Nobs. For this reason, we measure the goodness of a model fit in terms of χ2/Nobs (see Tables 1 and 2). Future studies with the seven-band GROND imaging instrument and other photometric (Greiner et al. 2008) and even spectroscopic instruments (e.g., the FORS2 spectrograph on the Very Large Telescope (VLT); see Fynbo et al. 2007) will allow us to place better constraints on model parameters.
- 6
RV ≡ AV/E(B − V) is the total-to-selective extinction ratio, where E(B − V) ≡ AB − AV, the color excess, is the difference between the extinction in B- and V bands.
- 7
The total-to-selective extinction ratio of the SMC bar is RV ≈ 2.87 (Gordon & Clayton 1998). The extinction curve of the SMC bar differs substantially from that predicted from the CCM formula with RV = 2.87: while the CCM RV = 2.87 curve has a moderately strong 2175
 bump and a slightly steeper far-UV extinction rise than the MW average (with RV ≈ 3.1), the SMC extinction is featureless and steeply rises toward the far-UV. The LMC extinction law is also substantially different from that predicted from the CCM formula with RV ≈ 2.6, a value obtained by averaging over 10 LMC regions (Misselt et al. 1999).
 - 8
While it is true that the extinction curve derived here from the Drude model deviates from the MW extinction law at λ−1 > 9 μm−1, we note that the uncertainty of the far-UV part of the MW extinction curve (i.e., the observed dispersion of the curve) is not small (e.g., at λ−1 = 10 μm−1 the uncertainty exceeds 30%; see Figure 1 of Zubko et al. 2004). The Galactic average extinction curve is based on the Astronomical Netherlands Satellite work by Savage et al. (1985) covering about 1000 sightlines. On the other hand, the extinction curve of the GRB host at λ−1 > 9 μm−1 would indeed be better constrained if the afterglow data at λ−1 > 9 μm−1 are available.
- 9
The seven-parameter analytical formula proposed by Reichart (2001) for the extinction curve Aλ/AV of GRB hosts was based on the expressions of Cardelli et al. (1989) for λ>0.3 μm and of Fitzpatrick & Massa (1990) for 0.1 μm < λ < 0.3 μm. The problem with the Reichart (2001) formula (see his Equations (61) and (66)) is that, as mentioned earlier, the CCM expression is only valid for the Galactic extinction curves, it is not suitable for the SMC or LMC extinctions (Gordon et al. 2003). Therefore, if a GRB host happens to have a SMC- or a LMC-type extinction law, models based on the Reichart (2001) formula will not be able to restore the true extinction (while the Drude approach does).
- 10
The c4 parameter in Equation (2) which measures the strength of the 2175
bump is only ≈0.01 for GRB 011121, while c4 ≈ 0.022, 0.052 for the LMC and MW extinction laws, respectively. - 11
The c4 parameter of Equation (2) which measures the strength of the 2175
bump is ≈0.10 for GRB 061121, while c4 ≈ 0.052 for the MW extinction law. - 12
- 13
Why these GRB hosts have, in general, a lower dust-to-gas ratio than that of the MW? First, these hosts could be metal-poor compared with the MW so that there are fewer heavy elements to make the dust. Second, the bulk of the dust may be really "gray" (a > 1 μm) so that its presence cannot be revealed by the near-IR–visible–UV extinction curve derived from modeling the afterglow SEDs. The latter explanation is not unreasonable: in the dense dusty circumburst environment, the dust can grow through coagulation to large sizes. Therefore, a lower AV/NH ratio does not necessarily mean a lower dust-to-gas ratio.
- 14
The silicate–graphite model of Mathis et al. (1977), who assumed a simple power law for the dust size distribution (dn/da ∼ a−3.5 with
for both silicate dust and graphite dust), gives mgra/(mgra + msil) ≈ 0.36. The latest silicate–graphite–polycyclic aromatic hydrocarbon model gives mgra/(mgra + msil) ≈ 0.27 (Weingartner & Draine 2001). The latter model assumes two different size distributions which smoothly extend from a few angstroms to a few micrometers for silicate dust and graphitic dust. - 15
The mean dust sizes are derived by first averaging over the silicate (graphite) size distributions weighted by mass to obtain 〈a〉sil (〈a〉gra) and then taking the mass-weighted average of 〈a〉sil and 〈a〉gra: 〈a〉 = msil/(mgra + msil) × 〈a〉sil + mgra/(mgra + msil) × 〈a〉gra.


