


ABSTRACT
We present the results of unbiased 22 GHz H2O water and 44 GHz class I CH3OH methanol maser surveys in the central 7' × 10' area of NGC 1333 and two additional mapping observations of a 22 GHz water maser in a ∼3' × 3' area of the IRAS4A region. In the 22 GHz water maser survey of NGC 1333 with a sensitivity of σ ∼ 0.3 Jy, we confirmed the detection of masers toward H2O(B) in the region of HH 7–11 and IRAS4B. We also detected new water masers located ∼20'' away in the western direction of IRAS4B or ∼25'' away in the southern direction of IRAS4A. We could not, however, find young stellar objects or molecular outflows associated with them. They showed two different velocity components of ∼0 and ∼16 km s−1, which are blue- and redshifted relative to the adopted systemic velocity of ∼7 km s−1 for NGC 1333. They also showed time variabilities in both intensity and velocity from multi-epoch observations and an anti-correlation between the intensities of the blue- and redshifted velocity components. We suggest that the unidentified power source of these masers might be found in the earliest evolutionary stage of star formation, before the onset of molecular outflows. Finding this kind of water maser is only possible through an unbiased blind survey. In the 44 GHz methanol maser survey with a sensitivity of σ ∼ 0.5 Jy, we confirmed masers toward IRAS4A2 and the eastern shock region of IRAS2A. Both sources are also detected in 95 and 132 GHz methanol maser lines. In addition, we had new detections of methanol masers at 95 and 132 GHz toward IRAS4B. In terms of the isotropic luminosity, we detected methanol maser sources brighter than ∼5 × 1025 erg s−1 from our unbiased survey.
Export citation and abstract BibTeX RIS
1. INTRODUCTION
Outflows/jets are the most powerful products generated during the star formation process and they are the best indirect indicator of the accretion process in the circumstellar disks of low- to high-mass star formations (see Arce et al. 2007 for reviews). This energetic mass-loss process not only has a constructive effect on star formation, removing excess angular momentum, but also has a destructive effect, changing the parent molecular cloud structures which eventually regulate star formation efficiency in the stellar clusters (Matzner & McKee 2000; Hartmann et al. 2001). Therefore, it is important to have macroscopic as well as microscopic studies of the outflow to fully understand the star formation process in molecular clouds. To accomplish this, it is necessary to build a full census of the outflows in the clouds and to interpret their activities in terms of evolutionary stages and the central stellar masses.
NGC 1333 is the most representative laboratory to study the outflow activities of low- to intermediate-mass stars, thanks to its wide range of outflow evolutionary stages and close distance of 235 pc (Hirota et al. 2008). Around 300 young stellar objects (YSOs) have been discovered which cover the evolutionary stages from Class 0 to Class III (Lada et al. 1996; Rebull et al. 2007; Gutermuth et al. 2008). Given these advantages, many outflow survey studies have been conducted at different wavelengths, tracing different physical processes caused by outflows. These include Hα and [S ii] optical observations as good tracers of shock-excited features in the molecular outflows (Bally et al. 1996); 2.12 μm H2 near-infrared observations also act as a shock tracer in the molecular outflows (Davis et al. 2008); 12CO (J = 3–2) molecular line observations act as a molecular outflow tracer (Knee & Sandell 2000; Hatchell & Dunham 2009; Curtis et al. 2010); and 12CO (J = 1–0) and 13CO (J = 1–0) molecular line observations trace molecular outflows (Arce et al. 2010; Plunkett et al. 2013). However, each tracer only provides limited information about the physical conditions of outflows. For example, the shock-excited optical Hα and near-infrared 2.12 μm H2 features trace recently shocked gas produced by the primary jets/winds with a cooling time of only a few years, while other molecular emissions at submillimeter to centimeter wavelengths are produced by gas entrained and accelerated by the secondary shocks (Bally et al. 2007). Clearly, we need to obtain every detail on outflows/jets using all of the available tracers to obtain a complete picture of them.
22 GHz H2O masers (616–523 transition) together with H2 emission are expected to arise from shocked regions excited by young, high-density molecular outflows/jets, while Hα emission is mostly due to atomic or ionized jets from older objects (Bally et al. 2007). Numerous studies (e.g., Haschick et al. 1980; Claussen et al. 1996) have detailed the short lifetime of H2O masers which trace shocks and usually have lifetime measured in days for specific shock features. In particular, the Very Large Baseline Interferometry (VLBI) techniques measuring the proper motions together with the radial velocities of masers in a region as close as NGC 1333 enable us to observe the three-dimensional motions of shocked regions. For example, H2O masers have been clearly shown to trace the bow shocks and inner part of the cavity walls of outflows in the massive star-forming regions of AFGL 2591 and Cepheus-A based on the morphologies and proper motions revealed by the VLBI multi-epoch observations (Claussen et al. 1998; Sanna et al. 2012; Torrelles et al. 2001a, 2001b, 2011, 2014; Trinidad et al. 2013). Furthermore, the 22 GHz water maser is a better tracer for the very early stage of young outflows than the near-infrared H2 emission, because most early star-forming regions are deeply embedded in molecular clouds.
Class I 44 GHz CH3OH methanol masers (70–61 A+ transition) are also a good tracer of shocked regions caused by the interaction of the outflows with the ambient molecular clouds. 22 GHz water masers are detected from low- to high-mass YSOs (Honma et al. 2005; Moscadelli et al. 2005, 2006; Goddi & Moscadelli 2006), while class I 44 GHz methanol masers are mainly detected from the intermediate- to high-mass YSOs (Kurtz et al. 2004; Fontani et al. 2010). Only four 44 GHz methanol masers in low-mass star-forming regions were previously known: NGC 1333–IRAS4A, NGC 1333–IRAS2A, HH25MMS, and L1157 (Kalenskii et al. 2010).
We executed 22 GHz H2O water and 44 GHz CH3OH methanol maser surveys in the central 7'×10' area of NGC 1333 at the center position of R.A. =  , decl. = 31°16'30'' (J2000) using the Korean VLBI network (KVN) 21 m telescopes. From these unbiased survey observations, we will provide a full census of the water and methanol masers observed at 22 and 44 GHz frequencies within sensitivity limits of 0.3 Jy and 0.5 Jy, respectively. We also provide possible connections between the observed masers and the known outflows in the NGC 1333.
In Section 2, we describe 22 GHz H2O water maser observations and 44, 95, and 132 GHz class I CH3OH methanol maser observations using the KVN 21 m telescopes. In Section 3, we present the observational results. In the last section, we identify each detected maser source and briefly summarize our main results.
2. OBSERVATIONS AND DATA REDUCTION
We carried out observations of the H2O water maser line at 22.23508 GHz (616–523) and class I CH3OH methanol maser lines at 44.06943 GHz (70–61 A+), 95.16946 GHz (80–71 A+), and 132.89080 GHz (6−1–50 E) using the KVN 21 m telescopes over a period of 1.5 yr from 2011 October to 2013 May. KVN consists of three stations, at Yonsei, Ulsan, and Tamna, each of which is equipped with a multi-frequency receiver system. That enabled us to simultaneously observe four frequency bands at 22, 43, 86, and 129 GHz with half-power beam widths of 120'', 62'', 32'', and 23'', respectively. All observations were done with a single-dish observational mode.
In 2012, the 22 GHz water maser and 44 GHz methanol maser maps of the central 7' × 10' area at the center of R.A. =  (J2000), decl. = 31°16'30'' (J2000) were obtained with 60'' and 30'' grid spacings, respectively. We carried out 22 GHz surveys in the ∼3' × 3' region of IRAS4A at two more epochs in 2011 and 2013 with 30'' and 15'' grid spacings, respectively. These multi-epoch observations toward IRAS4A enabled us to increase the detectability of water masers due to their time variability. We also took single-point observations of the 22 GHz water maser toward the H2O(B) source in the HH 7–11 region at multiple epochs, and the 44, 95, and 132 GHz class I methanol maser toward IRAS4A, IRAS4B, and the eastern bow-shock region of IRAS2A. The pointing positions are as follows: H2O(B)—R.A. =
  , decl. = 31°15'38
 0 (Haschick et al. 1980; Rodríguez et al. 1997), IRAS4A1 (and 2)—R.A. =
  (
( ), decl. = 31°13'310 (31°13'322) (Looney et al. 2000), IRAS4B—R.A. =
  , decl. = 31°13'100 (Sandell et al. 1991), and the eastern shock of IRAS2A—R.A. =
  , decl. = 31°14'244 (Sandell & Knee 2001). All positions are in the J2000 epoch.
We used a 4096 channel digital spectrometer for each frequency with a 32 MHz bandwidth. This gives a velocity coverage of 436 km s−1 with 0.1 km s−1 velocity resolution at 22 GHz. Pointing and focus checks were performed every 1–2 hr using the strong 22 GHz H2O and 43 GHz SiO maser lines of IK Tau (R.A. =  (J2000), decl. = 11°24'217 (J2000)). The pointing accuracies of both bands were ≲5'' during observations for all antennas. The data were calibrated using a standard chopper wheel method and line intensities were obtained on the
  scale. The conversion factors between
  and the flux density were 12.2/12.8/13.5 Jy K−1 for 65%/62%/59% (Yonsei/Ulsan/Tamna stations) aperture efficiencies at 22 GHz, 12.6/12.8/12.8 Jy K−1 for 63%/62%/62% at 44 GHz, 26.5/19.9/18.5 Jy K−1 for 39%/40%/43% at 95 GHz, and 33.1/38.8/24.8 Jy K−1 for 30%/32%/40% at 132 GHz, respectively (see the details at http://kvn.kasi.re.kr/status_report/).
Table 1 shows the details of the mapping observational logs; observational dates, antenna stations, the exposure integration time of each grid point, system temperatures Tsys, and rms noise levels at 0.4 km s−1 velocity resolution.
Table 1. Observational Logs
| Map | Figure 1 | Figure 3(a) | Figure 3(b) | Figure 4 |
|---|---|---|---|---|
| Frequency (GHz) | 22.23508 | 22.23508 | 22.23508 | 44.06943 |
| Date of observation | 2012 Feb 19–21 | 2011 Oct 13 | 2013 May 7 | 2012 Jan 7–11 |
| Antenna station | Ulsan | Yonsei | Yonsei | Ulsan |
| Integration time (minutes) | 42 | 30 | 10 | 19 |
| Tsys (K) | 73 | 120 | 100 | 140 |
| rms noise levela (K) | 0.01 | 0.02 | 0.03 | 0.03 |
Note. aAt 0.4 km s−1 velocity resolution.
Download table as: ASCIITypeset image
3. RESULTS
We performed a 22 GHz H2O water maser survey covering the central 7' × 10' area of NGC 1333. Figure 1(a) shows a spectral map of the water maser lines observed in 2012 with a 60'' grid spacing at a center position of R.A. =  (J2000), decl. = 31°16'300 (J2000), which is overlaid on the 2.12 μm H2 image observed by Davis et al. (2008). The detected water maser lines are plotted in red. Their positions (see Table 2) are near the H2O(B) and IRAS4B sources, which are marked with `` +" and
  " signs in the map, respectively. Figures 1(b) and (c) show the strongest, zoom-in spectra of these detected water maser lines in each source region.

Figure 1. (a) 22 GHz H2O water maser map observed in 2012 covers the central 7' × 10' area of the NGC 1333 with a 60'' grid spacing at the center position of R.A. =  (J2000), decl. = 31°16'30'' (J2000), which is overlaid on the 2.12 μm H2 image observed by Davis et al. (2008). Spectra are smoothed to have a 0.4 km s−1 velocity resolution and the rms noise level is 0.014 K. The symbols `` +," `` ×," ``▵,"
  ," and
  " mark the positions of H2O(B), IRAS4A1, IRAS4A2, IRAS4B, and the eastern shock region of IRAS2A, respectively. The detected spectra are highlighted with red, except the side-lobe spectra due to the strong emission from H2O(B). A label for each spectrum is marked in the bottom left panel. The x-axis shows the velocity in units of km s−1 and the y-axis is the flux in units of Jy. The blue dotted and solid line boxes represent survey areas of water maser performed in two different epochs in 2011 (Figure 3(a)) and in 2013 (Figure 3(c)), respectively. (b) The enlarged spectrum toward the H2O(B)(`` +"). (c) The enlarged spectrum toward the IRAS4B(
 ").
").
Download figure:
Standard image High-resolution imageTable 2. Fitting Parameters from GAUSSCLUMPS
| Map | Frequency | R.A. | Decl. | VLSR | δv | Fpeak | Possible Identified |
|---|---|---|---|---|---|---|---|
| (GHz) | (J2000) | (J2000) | (km s−1) | (km s−1) | (Jy) | Source | |
| Figure 1 | 22.23508 | 03 29 02.80 | 31 15 38.4 | 1.05 | 1.38 | 3.0 | H2O(B) (HH 7–11 region) |
| 03 29 02.96 | 31 15 33.6 | 3.37 | 0.95 | 21.2 | H2O(B) (HH 7–11 region) | ||
| 03 29 11.72 | 31 13 07.8 | 14.50 | 0.49 | 3.2 | IRAS4B | ||
| Figure 3(a) | 22.23508 | 03 29 10.92 | 31 13 23.4 | 7.04 | 1.08 | 1.4 | IRAS4A2 |
| Figure 3(b) | 22.23508 | 03 29 10.48 | 31 13 10.8 | −0.01 | 0.63 | 5.0 | Unidentified source |
| 03 29 10.84 | 31 13 06.6 | 16.32 | 0.64 | 5.0 | Unidentified source | ||
| Figure 4 | 44.06943 | 03 29 09.68 | 31 13 21.6 | 6.65 | 1.90 | 4.0 | IRAS4A2 |
| 03 29 01.40 | 31 14 18.6 | 9.37 | 4.59 | 2.2 | IRAS2A eastern shock |
Download table as: ASCIITypeset image
We derived the positions of detected masers using the GAUSSCLUMPS decomposition algorithm developed by Stutzki & Güsten (1990) and listed them in Table 2. The first two columns of Table 2 list the maps and observed frequencies, the third and fourth columns list the positions of line intensity peaks, the fifth column lists the velocity of each line component in the frame of the local standard of rest (LSR), the sixth and seventh columns list the width and the peak flux of each line component, and the last column lists the possible maser powering source associated with each line component. Since the fitting accuracy of the peak positions determined by GAUSSCLUMPS is far smaller than the antenna pointing accuracy, the peak position accuracy depends only on the antenna pointing accuracy, which is ≲5'' for both the 22 GHz water and 44 GHz methanol maser maps. In total, three water maser line components were found at velocities of 1.05, 3.37, and 14.50 km s−1. The derived positions of both the 1.05 and 3.37 km s−1 water maser components are ∼15'' east of H2O(B) in the HH 7–11 region. They are both blueshifted relative to the systemic velocity of 7.8 km s−1 derived by the NH3 molecular line observation (Ho & Barrett 1979). The 14.50 km s−1 water maser component comes from the nearby region of IRAS4B. It is redshifted relative to the systemic velocity of 7.5 km s−1 of IRAS4B (Hatchell & Dunham 2009).
We also conducted a monitoring observation toward the position of H2O(B). Figure 2 shows multi-epoch 22 GHz water maser spectra of H2O(B). It covers about 1 yr from 2011 October to 2012 November. The Gaussian fitting parameters of the spectra are listed in Table 3. These blueshifted water masers show large variability in both velocity and intensity. There was a flaring event from 2012 January to 2012 February. During the interval, the peak flux of the spectral line increased from 1.43 Jy to 22.02 Jy. The highest peak flux is 131.33 Jy, observed in May. After May, the peak flux decreased (see Table 3). On May 28, two strong velocity components of 1.91 km s−1 and 3.33 km s−1 appeared with peak fluxes of 131.33 Jy and 86.55 Jy, respectively. In June, the more blueshifted component accelerated further, while the less blueshifted one decelerated relative to the systemic velocity, 7.8 km s−1. If we looked at the LSR velocities at peaks of line profiles over the whole observation interval, the LSR velocity is 2.36 km s−1 on 2011 October 11, keeps increasing (deceleration relative to the systemic velocity) up to 3.82 km s−1 on 2012 March 24, and then decreases (acceleration relative to the systemic velocity) to 2.82 km s−1 at the end of our observations. It seems that the change from deceleration to acceleration is related to the occurrence of multiple strong masers on 2012 May 28.
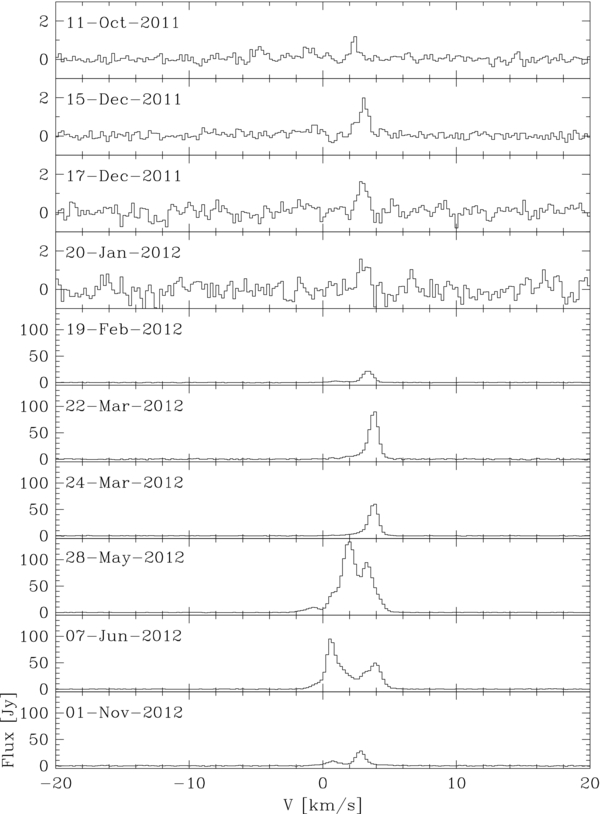
Figure 2. Multi-epoch 22 GHz water maser spectra of H2O(B) in the HH 7–11 region. Please note that the vertical scale has been changed from 2012 January 20 to 2012 February 19.
Download figure:
Standard image High-resolution imageTable 3. Gaussian Fitting Parameters of H2O(B) Water Maser Lines Shown in Figure 2
| Date (JD) | ∫Fνdv | vLSR | δv | Fpeak |
|---|---|---|---|---|
| (Jy km s−1) | (km s−1) | (km s−1) | (Jy) | |
| 2011 Oct 12 (2455847.45065) | 0.66 ± 0.10 | 2.36 ± 0.04 | 0.55 ± 0.12 | 1.13 |
| 2011 Dec 15 (2455911.27931) | 1.68 ± 0.14 | 3.05 ± 0.04 | 0.94 ± 0.11 | 1.68 |
| 2011 Dec 17 (2455913.27969) | 1.43 ± 0.18 | 2.97 ± 0.06 | 0.81 ± 0.11 | 1.66 |
| 2012 Jan 20 (2455947.12510) | 1.28 ± 0.20 | 3.03 ± 0.07 | 0.84 ± 0.13 | 1.43 |
| 2012 Feb 19 (2455977.07182) | 4.71 ± 0.23 | 1.18 ± 0.04 | 1.79 ± 0.10 | 2.47 |
| 21.07 ± 0.17 | 3.37 ± 0.00 | 0.90 ± 0.01 | 22.02 | |
| 2012 Mar 22 (2456008.84657) | 25.53 ± 1.04 | 3.10 ± 0.05 | 2.28 ± 0.07 | 10.51 |
| 66.66 ± 0.88 | 3.82 ± 0.00 | 0.76 ± 0.01 | 82.64 | |
| 2012 Mar 24 (2456010.87586) | 17.64 ± 0.74 | 3.28 ± 0.04 | 1.93 ± 0.06 | 8.59 |
| 43.06 ± 0.70 | 3.82 ± 0.00 | 0.75 ± 0.01 | 54.32 | |
| 2012 May 28 (2456075.64072) | 12.74 ± 0.24 | −0.80 ± 0.01 | 1.32 ± 0.03 | 9.07 |
| 30.99 ± 0.30 | 0.76 ± 0.00 | 0.85 ± 0.01 | 34.07 | |
| 140.16 ± 0.42 | 1.91 ± 0.00 | 1.00 ± 0.00 | 131.33 | |
| 126.05 ± 0.39 | 3.33 ± 0.00 | 1.37 ± 0.01 | 86.55 | |
| 2012 Jun 7 (2456085.69998) | 40.01 ± 0.36 | 0.59 ± 0.00 | 0.61 ± 0.00 | 61.76 |
| 98.15 ± 0.42 | 1.14 ± 0.01 | 2.24 ± 0.01 | 41.10 | |
| 67.39 ± 0.32 | 3.80 ± 0.00 | 1.38 ± 0.01 | 45.96 | |
| 2012 Nov 1 (2456233.10977) | 1.05 ± 0.35 | −0.49 ± 0.13 | 0.82 ± 0.23 | 1.20 |
| 7.64 ± 0.78 | 0.72 ± 0.02 | 1.00 ± 0.08 | 7.16 | |
| 20.23 ± 0.54 | 2.82 ± 0.00 | 0.78 ± 0.02 | 24.47 | |
| 13.18 ± 1.23 | 2.83 ± 0.16 | 3.75 ± 0.33 | 3.31 |
Download table as: ASCIITypeset image
In 2011, before the main surveys, we mapped a small 2' × 3' area of IRAS4A with a 30'' grid spacing. Figures 3(a) and (b) show a water maser spectral map and a zoom-in spectrum, respectively. One maser component was found at a velocity of 7.04 km s−1 close to IRAS4A at the southeast part with a separation of ∼10''. It is slightly blueshifted compared to the systemic velocity of 7.6 km s−1 (Hatchell & Dunham 2009). Since the derived position of the 7.04 km s−1 component is coincident with those of water masers observed using the Very Long Baseline Array, its driving source might be the IRAS4A2. However the distribution of water maser features is nearby perpendicular to the CO outflow direction; due to this fact, the origin of the component requires further investigation (Marvel et al. 2008).
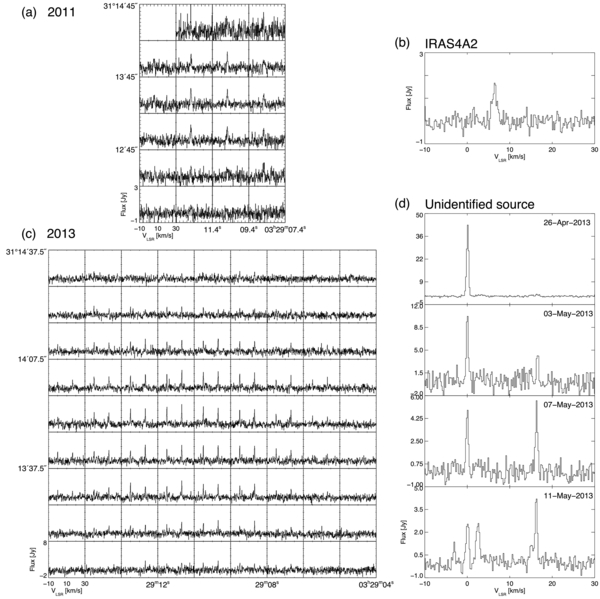
Figure 3. (a) 22 GHz H2O water maser map observed in 2011 covers a 2' × 3' area (blue dotted-line box in Figure 1(a)) of the IRAS4A region with a 30'' grid spacing. The rms noise level is 0.03 K at 0.2 km s−1 velocity resolution. (b) The enlarged spectrum shown in the map (panel (a)), which is identified as IRAS4A2. (c) 22 GHz H2O water maser map observed in 2013 covers a 3' × 3' area (blue solid-line box in Figure 1(a)) of the IRAS4A region with a 20'' grid spacing. The rms noise level is 0.04 K at 0.2 km s−1 velocity resolution. (d) The multi-epoch spectra of the maser shown in the map (panel (c)).
Download figure:
Standard image High-resolution imageIn 2013, we observed again the 3' × 3' area of IRAS4A with a 20'' grid spacing and found new water maser components with velocities at −0.01 km s−1 and 16.32 km s−1 (Figure 3(c)). These newly discovered components are located in the western part of IRAS4B with ∼20'' separation, or ∼25'' away in the southern direction of IRAS4A based on their positions determined using GAUSSCLUMPS (see Table 2). We also carried out multi-epoch observations on this source during the less than two month period from April to May in 2013. Figure 3(d) showed variabilities in both the velocity and intensity. It also showed an anti-correlation between blue- and redshifted velocity components in their intensities. In other words, the blueshifted maser is getting weaker while the redshifted one becomes stronger.
In Figure 4, we showed the 44 GHz CH3OH methanol maser map with a 30'' grid spacing covering the same area as the water maser map of Figure 1(a). Again, the detected line profiles in the nearby regions of IRAS4A1, IRAS4A2 (marked with `` ×" and ``▵" signs), and IRAS2A (marked with  " sign) are plotted in red. We found two maser components at velocities of 6.65 and 9.37 km s−1, and their positions derived using the GAUSSCLUMPS are listed in Table 2. The slightly blueshifted 6.65 km s−1 velocity component with respect to the systemic velocity is from ∼14'' separation in the southwest direction of IRAS4A. The direction is consistent with that of the blueshifted CO (J = 3–2) outflow of IRAS4A2 (Knee & Sandell 2000). The maser emission of 9.37 km s−1 comes from the east bow-shock region of IRAS2A at a separation of ∼15'' to the east. It is redshifted relative to the systemic velocity 7.7 km s−1 of IRAS2A (Hatchell & Dunham 2009).
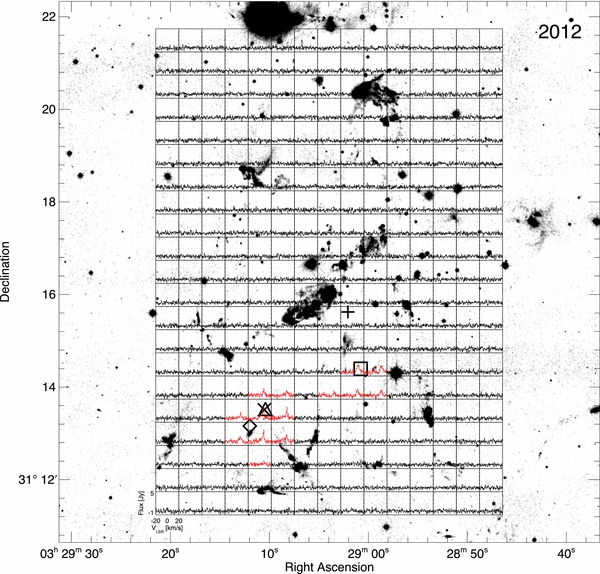
Figure 4. 44 GHz CH3OH methanol maser map observed in 2012 covers the same area as Figure 1(a) and it is also overlaid on 2.12 μm H2 image observed by Davis et al. (2008). All the labels and signs are same as Figure 1(a). The rms noise level is 0.028 K at 0.4 km s−1 velocity resolution. The line-detected spectra are highlighted with red in the IRAS4A region and the eastern shock region of the IRAS2A.
Download figure:
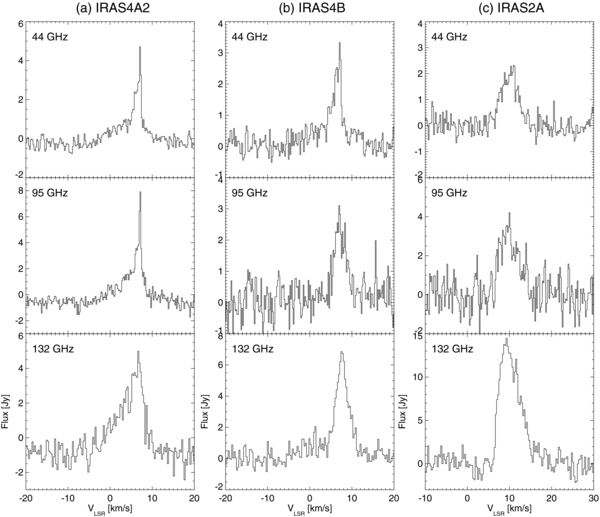
Standard image High-resolution imageWe confirmed that all of the 44, 95, and 132 GHz methanol masers are from the nearby region of IRAS4A at ∼10''–19'' separation in the southwest direction based on the mappings of a 2' × 2' IRAS4A area with 15'' grid spacing (we do not present all these maps here). The positions of all these maser components derived using GAUSSCLUMPS are consistent with that of the blueshifted southwest outflow of IRAS4A2. The representative spectra of all the bands are shown in Figure 5(a). We found two Gaussian components for each frequency; one 4.52 km s−1 velocity component with a broad line width of δv ∼ 9.42 km s−1 and another 6.97 km s−1 component with a narrow line width of δv ∼ 1.54 km s−1 at 44 GHz; a broad line of 5.28 km s−1 with δv ∼ 7.90 km s−1 and a narrow line of 7.08 km s−1 with δv ∼ 0.62 km s−1 at 95 GHz; a broad line of 3.98 km s−1 with δv ∼ 9.38 km s−1 and a narrow line of 6.69 km s−1 with δv ∼ 2.32 km s−1 in the 132 GHz band. The line parameters of all the Gaussian components of IRAS4A2 are listed in Table 4. This was the first detection of a 132 GHz class I methanol maser for this source, while 44 and 95 GHz masers were detected by Kalenskii et al. (2010). We also clearly found broad wing features of δv ≳ 8 km s−1 at all frequencies, which might be thermal components due to the molecular outflow itself.
Figure 5. (a) IRAS4A2 spectra of 44, 95, and 132 GHz methanol masers. (b) IRAS4B spectra of 44, 95, and 132 GHz methanol masers. (c) The spectra of the IRAS2A eastern shock region of 44, 95, and 132 GHz methanol masers.
Download figure:
Standard image High-resolution image
Table 4. Gaussian Fitting Parameters of Detected Lines Shown in Figures 3 and 5
| Source | Frequency | Date | ∫Fνdv | vLSR | δv | Fpeak |  |
 |
|---|---|---|---|---|---|---|---|---|
| (GHz) | of Observation | (Jy km s−1) | (km s−1) | (km s−1) | (Jy) | (L☉) | (L☉) | |
| Unidentified | 22.23508 | 2013 Apr 26 | 26.400.20 | 0.09 ± 0.00 | 0.56 ± 0.01 | 44.64 | 3.92E-8 | 3.92E-8 |
| source | 22.23508 | 2013 May 3 | 6.50 ± 0.60 | 0.01 ± 0.02 | 0.54 ± 0.06 | 11.24 | 9.65E-9 | |
| 2.95 ± 0.54 | 16.55 ± 0.05 | 0.55 ± 0.10 | 5.07 | 4.38E-9 | 1.40E-8 | |||
| 22.23508 | 2013 May 7 | 3.33 ± 0.28 | −0.01 ± 0.03 | 0.63 ± 0.06 | 4.96 | 4.95E-9 | ||
| 3.41 ± 0.29 | 16.32 ± 0.03 | 0.64 ± 0.07 | 5.02 | 5.06E-9 | 1.00E-8 | |||
| 22.23508 | 2013 May 11 | 0.61 ± 0.13 | −3.05 ± 0.05 | 0.42 ± 0.10 | 1.37 | 9.06E-10 | ||
| 2.13 ± 0.17 | 0.07 ± 0.03 | 0.72 ± 0.06 | 2.79 | 3.16E-9 | ||||
| 2.66 ± 0.21 | 2.51 ± 0.04 | 0.95 ± 0.09 | 2.62 | 3.95E-9 | ||||
| 1.20 ± 0.23 | 15.16 ± 0.10 | 0.95 ± 0.22 | 1.19 | 1.78E-9 | ||||
| 2.63 ± 0.20 | 16.24 ± 0.02 | 0.55 ± 0.05 | 4.48 | 3.91E-9 | 1.37E-8 | |||
| IRAS4A1 | 22.23508 | 2011 Oct 13 | 1.61 ± 0.21 | 7.04 ± 0.05 | 1.08 ± 0.21 | 1.40 | 2.39E-9 | 2.39E-9 |
| IRAS4A2 | 44.06943 | 2012 Mar 11 | 10.89 ± 0.63 | 4.52 ± 0.29 | 9.42 ± 0.58 | 1.09 | 3.08E-8 | |
| 4.41 ± 0.35 | 6.79 ± 0.04 | 1.54 ± 0.12 | 2.69 | 1.25E-8 | 4.33E-8 | |||
| 95.16946 | 2012 Mar 11 | 20.95 ± 0.82 | 5.28 ± 0.16 | 7.90 ± 0.49 | 2.49 | 2.08E-7 | ||
| 3.80 ± 0.46 | 7.08 ± 0.02 | 0.62 ± 0.11 | 5.73 | 3.78E-8 | 2.46E-7 | |||
| 132.89080 | 2012 Mar 11 | 29.68 ± 2.02 | 3.98 ± 0.33 | 9.38 ± 0.63 | 2.97 | 5.12E-7 | ||
| 7.85 ± 1.44 | 6.69 ± 0.08 | 2.32 ± 0.33 | 3.18 | 1.35E-7 | 6.47E-7 | |||
| IRAS4B | 22.23508 | 2012 Feb 20 | 0.64 ± 0.20 | 9.83 ± 0.08 | 0.52 ± 0.20 | 1.17 | 9.51E-10 | |
| 0.65 ± 0.20 | 10.96 ± 0.13 | 0.69 ± 0.24 | 0.89 | 9.65E-10 | ||||
| 0.37 ± 0.17 | 13.29 ± 0.07 | 0.41 ± 0.19 | 0.84 | 5.50E-10 | ||||
| 1.65 ± 0.18 | 14.51 ± 0.03 | 0.49 ± 0.06 | 3.18 | 2.45E-9 | 4.92E-9 | |||
| 44.06943c | 2012 Apr 26 | 7.79 ± 0.72 | 4.84 ± 0.46 | 10.39 ± 1.07 | 0.70 | 2.20E-8 | ||
| 3.96 ± 0.44 | 6.67 ± 0.07 | 1.82 ± 0.18 | 2.04 | 1.12E-8 | 3.32E-8 | |||
| 95.16946 | 2012 Apr 26 | 7.36 ± 2.17 | 6.66 ± 0.59 | 24.57 ± 10.69 | 0.28 | 7.32E-8 | ||
| 7.23 ± 0.86 | 7.17 ± 0.13 | 3.06 ± 0.32 | 2.22 | 7.19E-8 | 1.45E-7 | |||
| 132.89080 | 2012 Apr 26 | 15.00 ± 1.55 | 5.45 ± 0.71 | 14.90 ± 1.37 | 0.95 | 2.59E-7 | ||
| 18.29 ± 1.05 | 7.69 ± 0.05 | 3.16 ± 0.15 | 5.44 | 3.15E-7 | 5.74E-7 | |||
| Eastern shocked | 44.06943 | 2012 Mar 20 | 6.02 ± 0.42 | 10.03 ± 0.17 | 4.66 ± 0.27 | 1.21 | 1.70E-8 | |
| region of IRAS2A | 4.11 ± 0.15 | 10.03 ± 0.27 | 4.77 ± 0.62 | 0.81 | 1.16E-8 | 2.86E-8 | ||
| 95.16946 | 2012 Mar 20 | 13.75 ± 3.34 | 9.25 ± 0.44 | 3.85 ± 0.78 | 3.36 | 1.37E-7 | ||
| 4.03 ± 2.97 | 12.83 ± 0.96 | 2.94 ± 1.20 | 1.29 | 4.01E-8 | 1.77E-7 | |||
| 132.89080 | 2012 Mar 20 | 27.94 ± 5.74 | 8.56 ± 0.10 | 2.87 ± 0.22 | 9.14 | 4.82E-7 | ||
| 52.16 ± 6.29 | 11.24 ± 0.29 | 5.14 ± 0.36 | 9.54 | 9.00E-7 | 1.38E-6 |
Notes. aIsotropic maser luminosity of each velocity component estimated by adopting the distance of 235 pc to NGC 1333. bSummed luminosity of all the velocity components. cIt could have contamination from IRAS4A.
Download table as: ASCIITypeset image
With position-switching mode observations, we also detected all of the 44, 95, and 132 GHz methanol maser lines toward IRAS4B, which are shown in Figure 5(b). Since the separation angle of ∼30'' between IRAS4B and IRAS4A is larger than the half-beam sizes of ∼16'' at 95 GHz and ∼12'' at 132 GHz, respectively, we resolved each region at 95 and 132 GHz observations. In fact, the 95 and 132 GHz methanol maser line profiles from IRAS4B are different from those of IRAS4A2. We detected for the first time class I methanol masers at 95 and 132 GHz toward IRAS4B. However, we could not resolve each region in the 44 GHz observation since the half-beam size of the 44 GHz observation is similar to the angular separation. The 44 GHz line profiles of IRAS4B and IRAS4A2 shown in Figures 5(a) and (b) are similar and there is very little difference in their LSR velocities listed in Table 4. We again found two Gaussian components toward IRAS4B for each frequency; a broad line of 4.84 km s−1 with δv ∼ 10.39 km s−1 and a narrow line of 6.67 km s−1 with δv ∼ 1.82 km s−1 at 44 GHz; a broad line of 6.66 km s−1 with δv ∼ 24.57 km s−1 and a narrow line of 7.17 km s−1 with δv ∼ 3.06 km s−1 at 95 GHz; a broad line of 5.45 km s−1 with δv ∼ 14.90 km s−1 and a narrow line of 7.69 km s−1 with δv ∼ 3.16 km s−1 at 132 GHz band. The line parameters of all the Gaussian components of IRAS4B are listed in Table 4. We suggest that all these broad wing features at all frequencies might also be due to the molecular outflow itself.
Figure 5(c) show all methanol maser lines toward the eastern shocked region of IRAS2A, whose central velocities around 10 km s−1 (see Table 4) are consistent with those in Kalenskii et al. (2010). We found two Gaussian components for each frequency; a 10.03 km s−1 with δv ∼ 1.21 km s−1 and a 10.03 km s−1 with δv ∼ 0.81 km s−1 at 44 GHz, a 3.85 km s−1 with δv ∼ 3.36 km s−1 and a 2.94 km s−1 with δv ∼1.29 km s−1 at 95 GHz, and two broad components of 2.87 and 5.14 km s−1 with δv > 9 km s−1 at 132 GHz band. The line parameters of the Gaussian components of IRAS2A are listed in Table 4. We also newly detected a 132 GHz methanol maser that is much stronger than those of 44 and 95 GHz. For example, the integrated maser luminosity of 132 GHz is almost 10 times stronger than that of 95 GHz, while IRAS4A2 and IRAS4B showed only 3 times stronger at 132 GHz than at 95 GHz.
4. SUMMARY AND DISCUSSIONS
Detections of 22 GHz water masers and 44 GHz class I methanol masers are good indicators of the current ongoing star formation process because they are closely related with outflow/jet activity (Furuya et al. 2003; Kalenskii et al. 2006, 2010). In particular, the short time variabilities of the water masers in both intensity and velocity support the idea that observations of masers are the best way to watch the vivid live show of outflow activities.
In 2012, we carried out the unbiased 22 GHz H2O water and 44 GHz class I CH3OH methanol maser surveys in the central 7' × 10' area of NGC 1333 in 2012 using the KVN telescopes with sensitivities of σ ∼ 0.3 Jy in the 22 GHz map and σ ∼ 0.5 Jy in the 44 GHz map (see Figures 1(a) and 4). In addition, we carried out mapping observations of a 22 GHz water maser in the area of IRAS4A in two more epochs in 2011 and 2013 to see the variability in velocity and intensity. We also made 44, 95, and 132 GHz methanol maser observations toward IRAS4A, IRAS4B, and IRAS2A regions with the position-switching mode of observations.
We summarize our results as follows. First, in the 22 GHz water maser survey conducted in 2012, we confirmed the well-known 22 GHz water masers of H2O(B) in the HH 7–11 region shown in Figure 1 (Haschick et al. 1980; Claussen et al. 1996; Rodríguez et al. 1997; Wootten et al. 2002). The monitoring observations of the 22 GHz water masers of H2O(B) show high variability in both intensity and velocity. The LSR velocities of the peak of water maser line profiles initially decelerate with respect to the systemic velocity, and then accelerate when multiple strong masers occur (Figure 2). In particular, during the 10 day intervals of the two epochs, 2012 May and June, the more blueshifted component was accelerated further while the less blueshifted one was decelerated relative to the systemic velocity. The line parameters of 10 epoch observations are listed in Table 3. We also confirmed the water maser of IRAS4B with a velocity of 14.50 km s−1 during the 2012 survey observation (Figure 1(c)).
Second, in the 2011 survey map shown in Figure 3(a), we confirmed the slightly blueshifted 7.04 km s−1 water maser of IRAS4A2 which was first reported by Claussen et al. (1996). The derived position measured using GAUSSCLUMPS is consistent with those of water masers observed by Marvel et al. (2008). However, the distribution of water maser features is nearby perpendicular to the CO outflow direction; due to this fact, further investigation of the origin of the component is still required.
Third, in the 2013 unbiased spectral survey shown in Figure 3(c), we discovered two new water masers at positions ∼20'' away to the west of IRAS4B (∼25'' away to the south of IRAS4A; see also Table 2 of the estimated positions measured using GAUSSCLUMPS). From multi-epoch observations, the new water masers show time variabilities in both intensity and velocity. In addition, it seems that there is an anti-correlation in their intensities between blue- and redshifted velocity components (Figure 3(d)). This indicates that both velocity components are genuinely related to each other. However, we could not find any clear candidate for the powering source for these water masers from (sub)millimeter continuum observations and no sign of outflows/jets from the previous molecular line survey studies. We found only one possible continuum candidate with only 5σ level in the 96.7 GHz band observed by Sakai et al. (2012; see Figure 1 in their paper), which is around 5''–10'' away to the north of these maser components. We need further deep (sub)millimeter observations to confirm whether or not this weak continuum emission is real. It will provide information whether it is indeed a deeply embedded earliest stage of YSO before the onset of other molecular outflows.
Fourth, in the 44 GHz methanol maser survey shown in Figure 4, we confirmed the known maser sources of IRAS4A and the eastern shock region of IRAS2A (Kalenskii et al. 2006, 2010). We also detected 95 and 132 GHz methanol masers toward both sources (Figure 5). In particular, we found that the derived positions of all blueshifted methanol masers with velocity ranges of ∼3–7 km s−1 at 44, 95, and 132 GHz in the IRAS4A region are consistent with that of the southwest blueshifted outflow of IRAS4A2. This is the first detection of 132 GHz class I methanol masers of both objects from our observation. We found that the newly detected 132 GHz methanol maser luminosity on IRAS2A is almost 10 times stronger than that of 95 GHz, while IRAS4A2 was only 3 times stronger in its luminosity at 132 GHz than 95 GHz. In both sources, the broad wing features shown in all frequencies might be the thermal emissions from the molecular outflow itself.
Finally, we have a possible new detection of methanol masers of IRAS4B by the position-switching observational mode at 44, 95, and 132 GHz (see Figure 5(b) and Table 4 for the line fitting parameters). We suggested that 95 and 132 GHz methanol maser emissions originated from IRAS4B based on their different line profiles compared to those of IRAS4A2, despite their close distance of ∼30''; the half-beam sizes of these bands are less than their separation angle.
Through our 44 GHz methanol maser survey toward the central region of NGC 1333, we detected maser sources brighter than ∼5 × 1025 erg s−1 of the isotropic maser luminosity. The 1σ sensitivity of our 44 GHz mapping observations is about 0.5 Jy. The peak fluxes of detected masers are above around 2 Jy, which is at about the 4σ level. We listed the integrated flux over the velocity of each Gaussian component in Table 4. The isotropic luminosity of each component was calculated by adopting a distance of 235 pc to NGC 1333. The minimum isotropic luminosity of the detected methanol masers in our survey is 2.86 × 10⁻⁸ L☉, which is from the eastern shock region of IRAS2A (see also Table 4).
We are grateful to all staff members at the KVN who helped to operate. The KVN is a facility operated by the Korea Astronomy and Space Science Institute.