


ABSTRACT
Oxygen has been proposed to be a superior tracer, compared to iron, for studying galactic chemical evolution. In the context of improving our understanding of the evolution of Galactic oxygen using open clusters, we present a spectroscopic analysis of oxygen and iron abundances in the 650 Myr old Hyades cluster and in the 1.45 Gyr old cluster NGC 752, using high-dispersion 7774 Å O i triplet region spectra of dwarfs in these clusters acquired with the Hydra MOS on the WIYN 3.5 m telescope. Motivated by recent improvements in analysis of the triplet, we use a strictly differential analysis in solar-type stars to obtain reliable O abundances. Using stars whose radial velocities and spectral cross-correlation analyses are consistent with single-star membership, we report Hyades cluster averages of [O/H] = 0.195 ± 0.010 and [Fe/H] = 0.130 ± 0.009 based on 22 stars, and NGC 752 cluster averages of [O/H] = −0.077 ± 0.02 and [Fe/H] = −0.063 ± 0.013 based on 36 stars (where the errors are σμ; we discuss possible additional systematic errors). These cluster abundance averages are in very good agreement with most previous determinations. Whereas the [O/H] cluster averages utilize only stars found in the "prime" Teff range straddling the solar Teff, the [Fe/H] cluster averages come from stars exhibiting a flat [Fe/H]–Teff relation of over 1000 K for the Hyades and nearly 2000 K for NGC 752. Previous studies of open clusters younger than NGC 752 have reported oxygen triplet over abundances in cool dwarfs, as compared to oxygen abundances of the prime-Teff range. We report that NGC 752 also shows such overabundances, at a higher level than the Hyades overabundances, and thus contradicts the idea of a decline of such overabundances with increasing age. We discuss evidence for and against correlations of the oxygen overabundances with rotation, X-ray luminosity, chromospheric activity, and metallicity.
Export citation and abstract BibTeX RIS
1. INTRODUCTION
This paper initiates a series of works on O abundances of open cluster dwarfs. To establish the background and motivation for these works, we review the age–metallicity relationship in our Galaxy, our current understanding of the chemical evolution of O, and the issues which affect determination of stellar O abundances.
1.1. Is Iron an Appropriate Chronometer?
The expectation of an age–metallicity relation in the Galatic disk is an important component of our understanding of Galactic chemical evolution. It has often been convenient to assume that Fe exhibits a clear correlation with age and thus can be used as a chronometer for chemical enrichment. However, the arguments against Fe being a suitable chronometer have been acknowledged for over two decades, and were first notably raised by Wheeler et al. (1989). Fe has two production sources, Type Ia supernovae (SNe) which arise via white dwarfs from low-mass stars with lifetimes ∼109 yr, and Type II SNe which are the end result of high-mass stars with lifetimes ∼107 yr. While these two sources thus contribute Fe on very different timescales, comparison of theoretical SN elemental yields with observed SN rates indicates that each SN type has contributed roughly equally to Galactic Fe over the history of the disk (Nomoto et al. 1997) suggesting that Fe should not be expected to exhibit a robust correlation with age. In addition the yield of Fe is sensitive to the details and parameters of the explosion for both SN types. The Fe ejected by Type II SNe is produced both by Si burning prior to the explosion and by O burning during the explosion; models indicate that the amount of Fe ejected is sensitive both to the amount of fallback onto the core and to the explosion energy (Woosley & Weaver 1995; Nomoto et al. 2006). Fe production by Type Ia SNe results from radioactive decay of 56Ni synthesized during the explosion (e.g., Kuchner et al. 1994), and thus is sensitive to details of the explosion as well as to the progenitor system (Woosley 2001), the latter not yet being fully understood (e.g., Kobayashi & Nomoto 2009). Indeed, since Type Ia luminosity is driven by the decay of 56Ni, Howell et al. (2009) argue that the observed scatter in Type Ia luminosities is difficult to explain if most Type Ia SNe explode near the Chandrasekhar mass.
In addition to the theoretical arguments against Fe as a robust age indicator, the lack of a strong Fe versus age relationship in the Galactic disk during the past ∼10 Gyr has been made clear by observational studies for over 30 years. The seminal work of Twarog (1980) investigated the age–metallicity relationship in the solar neighborhood via derivation of [Fe/H] from Hβ and uvby photometry for over 900 field F dwarfs. The results, when binned by age, clearly demonstrate a substantial rise, ∼1 dex, in mean metallicity over the history of the Galaxy, although with a rise of only ∼0.1 dex occurring in the past ∼5 Gyr. However, the high-resolution spectroscopic study of 189 field F and G dwarfs by Edvardsson et al. (1993) casts serious doubt on the reality of a well-defined age–metallicity relationship. Edvardsson et al. (1993) found that while the oldest and youngest groups of stars exhibited the "expected" low and high average [Fe/H], respectively, the intermediate group, roughly 2–10 Gyr, had large scatter and populated the [Fe/H] range equally across all ages. These field star results are corroborated by the low-resolution spectroscopic study of 39 open clusters by Friel et al. (2002). Open clusters (OC) can provide well-constrained abundances and are also more reliably dated than field stars; they are an ideal tool for examining Galactic chemical evolution. Friel et al. (2002) derived [Fe/H] from Fe and Fe-peak element spectral features by using the ratio of the average flux in a bandpass centered on each feature to the average flux of the local spectral continuum. The Friel et al. (2002) sample exhibits a uniform spread in [Fe/H] across the entire age range, and this result holds even when their cluster averages are adjusted for the [Fe/H] versus RG gradient exhibited by their cluster sample; regarding their use of such a gradient, Friel et al. (2002) acknowledge that, while the gradient exhibited by their sample is consistent with previous determinations in the literature, it is possible that the assumption of a simple gradient is not correct, as argued by Twarog et al. (1997). More recently, Friel et al. (2010) again found no Fe versus age correlation using high-resolution spectroscopic abundances of 11 open clusters.
It is important to note that the roughly flat [Fe/H] versus age relationship found by these studies is actually predicted by chemical evolution models which incorporate the in-fall of unenriched gas onto the Galactic disk (e.g., Pilyugin & Edmunds 1996; Chiappini et al. 1997; Kobayashi et al. 2006). Such in-fall effectively "resets" the chemical clock, from which Fe would not easily recover due to its long production timescale, undermining its utility as an age indicator.
1.2. Oxygen's Potential Value for Chemical Evolution Studies
Given the poor theoretical and observational prospects for using Fe as a reliable age indicator, other elements should be more thoroughly explored. Wheeler et al. (1989) suggested the potentially excellent alternative that oxygen may be a superior chronometer for Galactic chemical evolution. In contrast to Fe, O has the advantage of having primarily one dominant source, namely, production by He burning in the cores of massive stars and ejection by the subsequent Type II SNe. Since O is produced by hydrostatic burning prior to the explosion, its yield is well-described by nucleosynthesis models alone, the results of which depend primarily on the progenitor properties rather than the hydrodynamical details of the explosion (Kobayashi et al. 2006). In addition to having a single production source, the yield of O from Type II SNe is independent of metallicity (Woosley & Weaver 1995), and the 107 yr timescale of Type II SNe in principle allows stellar O abundances in the Galaxy to respond quickly to enrichment, and thus O has the potential to exhibit a robust correlation with stellar age. A possible caveat is that Type II progenitors do not fully disburse into the Galaxy before exploding, possibly leading to self-enrichment of star-forming regions and creating scatter in the [O/H] versus age relationship (Pilyugin & Edmunds 1996). Nonetheless, there is compelling observational evidence for a strong O versus age correlation, as demonstrated by King (1993, hereafter K93), using low-resolution 7774 Å O i triplet data of mostly solar-type dwarfs in 8 open clusters. One of the principal aims of our current study is to further test this encouraging endorsement of O as an age indicator.
In addition to its potential as an age indicator, O is frequently used as a tracer of Galactic chemical evolution via the [O/Fe] versus [Fe/H] relationship; this relationship reflects the relative contributions of Type Ia and Type II SNe to chemical enrichment. For [Fe/H] > −1 there is universal consensus for an approximately linear trend where [O/Fe] decreases with increasing metallicity with slope ∼ − 0.5, as shown by both field star data and chemical evolution models. A possible break in slope near [Fe/H] ∼ −1, the existence of which is debated (see below), would indicate the point at which Type Ia production of Fe reaches its maximum rate (Chiappini et al. 2003). However, the form of this relationship for [Fe/H] < −1 remains uncertain despite being the focus of many investigations; at least two possible slopes have been demonstrated, each having distinct implications for enrichment in the early Galaxy. Some studies (e.g., Carretta et al. 2000) suggest that, at low [Fe/H], the [O/Fe] ratio plateaus at values near ∼0.5, indicating dominant Type II enrichment, in agreement with recent chemical evolution models (Kobayashi et al. 2006). In contrast, a number of investigations (e.g., Boesgaard et al. 1999; Israelian et al. 2001) have found linear trends with slope ∼ − 0.3 (i.e., [O/Fe] increasing with decreasing metallicity), as predicted by chemical evolution models that incorporate a possible early contribution of Type Ia SNe to Fe production at Galactic age ⩽1 Gyr (Chiappini et al. 1999). Alternatively, values of [O/Fe] ∼ 1 at [Fe/H] ∼ −3 (e.g., Boesgaard et al. 1999; Israelian et al. 2001), higher than the pure Type II value of [O/Fe] ∼ 0.4, may suggest that O production was higher in the early galaxy (Israelian et al. 2001) and/or at very low metallicity. This finding is supported by the chemical evolution models of Kobayashi et al. (1998) and Kobayashi et al. (2006), which include metallicity-dependent SN yields, and show a roughly flat relationship for −3 ≲ [Fe/H] ≲ −1 that subsequently changes slope for [Fe/H] ≲ −3 [O/Fe], rising to [Fe/H] ≳ 0.7 near [Fe/H] ∼ −4.
The debate about the constancy of [O/Fe] at low metallicity arises from apparent discrepancies between O abundance indicators in different stellar types. Studies utilizing the 6300 Å [O i] line in giants frequently find an [O/Fe] plateau below [Fe/H] ∼ −1 (though see Figures 1 and 8 of King 2000, and associated discussion), while studies based upon the 7774 Å O i indicate a non-zero slope. Studies using the temperature sensitive near-UV OH lines (located between 3100 Å and 3300 Å) have variously yielded both results depending on the atmospheric parameters used (see Boesgaard et al. 1999; Israelian et al. 2001; Shchukina et al. 2005, for detailed discussions of these results; issues affecting the abundance indicators will be discussed in detail below). There have been various attempts to reanalyze and reconcile these findings using revised atmospheric parameters, non-LTE (NLTE) effects, and three-dimensional model atmospheres (Boesgaard et al. 1999; King 2000; Israelian et al. 2001; Shchukina et al. 2005; Gonzalez Hernandez et al. 2010). These studies appear to have achieved agreement in favor of a non-zero slope for [Fe/H] < −1, or even a single, constant slope over the entire metallicity range. Nonetheless, the overall picture remains unclear, as do the implications for Galactic chemical evolution.
1.3. Reliability of Stellar Oxygen Abundances
Further progress in understanding the chemical evolution of O has been impeded by debate over the reliability of the principle O abundance indicators, namely: (1) the 6300 Å and 6363 Å [O i] lines, the latter being less commonly used, (2) the near-IR 7774 Å O i triplet, (3) the near-UV, electronic OH lines in the 3100 Å to 3300 Å region, and (4) the near-IR, vibrational-rotational OH lines in the 1.5μ to 1.7μ region, which are used only rarely, despite being regarded as potentially very reliable (e.g., Balachandran & Carney 1996; Melendez & Barbuy 2002). Both sets of OH lines are temperature sensitive, although it has been argued that the near-UV set can produce abundances in agreement with other indicators when appropriate atmospheric parameters are used (e.g., Boesgaard et al. 1999). In addition, the near-UV OH lines suffer from blends, thus requiring high-resolution spectra for accurate analysis, and furthermore have been found to be sensitive to temperature inhomogeneities (Gonzalez Hernandez et al. 2010, and references therein), thus indicating that abundance analyses using three-dimensional model atmospheres may be required.
The most widely trusted feature is the [O i] line at 6300 Å which is free of NLTE effects (Kiselman 1991; Takeda 2003). However, this line is very weak even in metal-rich dwarfs, and is blended with a Ni i feature, thus requiring synthesis and an accurate Ni abundance. As a result, the forbidden line is most reliably used in giants, where the gravity-sensitive feature is enhanced. However, possible modification of surface CNO abundances by evolutionary effects in evolved stars raises possible concerns about using such stars to trace Galactic chemical evolution. It is established that convective dredge-up on the red giant branch should have a negligible effect on the surface oxygen abundance, but effects by other forms of mixing (such as rotationally induced mixing) and processing have not been ruled out (Boesgaard et al. 1999; Schuler et al. 2006a). In addition, recent asymptotic giant branch models suggest that rotationally induced mixing could indeed dilute the surface O abundance with CNO-processed material (Stasin¨ska et al. 2010). Even in the seemingly simpler case of dwarfs, Garcia Lopez et al. (1993) found that Hyades and Ursa Majoris group F dwarfs exhibit a possible surface depletion of ∼0.1 dex in [O/H] for 6500 K < Teff < 6900 K, perhaps related to microscopic diffusion. Beyond these concerns over possible evolutionary effects, concerns regarding abundance analyses of the [O i] lines have also been raised. Takeda (2003) and Israelian et al. (2004) each found substantial discrepancies (as much as ∼1 dex in the latter work) in metal-poor giants between the abundances derived from the forbidden lines and those derived from the near-IR O i triplet, and both studies also found that these discrepancies are not resolved using NLTE corrections. Israelian et al. (2004) argued that these discrepancies could be due to unreliable model atmospheres. In addition, Shchukina et al. (2005) have reported that the 6300 Å [O i] shows granulation inhomogeneity effects as large as 0.2 dex, and thus requires three-dimensional model atmospheres for proper analysis.
Unlike the forbidden lines, the near-IR O i triplet at 7772, 7774, and 7775 Å (hereafter simply "the triplet") has easily observed line strengths of tens of mÅ in solar-type dwarfs; in such stars, the feature is also free of any known significant blending effects. Furthermore, the O abundances of dwarfs should be free of evolutionary effects. These high excitation potential (9 eV) lines arise from a transition from the 3s to 3p orbitals with three possible values of the total angular momentum in the final state. Models of the triplet indicate that it suffers from NLTE effects (e.g., Kiselman 1991; Takeda 2003; Shchukina et al. 2005), which result from a sub-Plankian source function thus leading to over-excitation and overpopulation of the lower state, ultimately causing an increasing trend in LTE abundances with increasing temperature for Teff ≳ 6200 K (Takeda 2003; Schuler et al. 2006b). Fortunately, the work of Shchukina et al. (2005), who used using three-dimensional model atmospheres, has indicated that the triplet is not significantly affected by granulation inhomogeneities.
In addition to the predicted NLTE effects, Schuler et al. (2004) discovered an increasing rise in LTE abundances with decreasing temperature for Teff ≲ 5500 K in Pleiades dwarfs, with analogous trends subsequently found by King & Schuler (2005) and Schuler et al. (2006b) for Ursa Major Group dwarfs and Hyades dwarfs, respectively; this behavior is not predicted by NLTE calculations. Schuler et al. (2006b) found no strong correlation between [O/H] and Ca ii HK emission indicators, but noted that while this perhaps pointed to photospheric magneto-rotational activity (starspots, etc.), the chromospheric emission data was not contemporaneous with the abundance data, leaving the matter unclear. Schuler et al. (2006b) also showed that the low temperature trend could indeed be emulated using synthetic spectra generated from a linear combination of model atmospheres representing a base photospheric temperature with contributions from hot and cool spots, but this encouraging result could not firmly establish stellar spots as the source of the trend. The triplet abundance trend at low Teff was further investigated by Shen et al. (2007) who found some correlation between triplet abundances and contemporaneous Hα and Ca ii data for IC 4665, as well as finding a strong correlation (albeit based on only three stars) with coronal X-ray emission. Although they suggested these results favor age-related chromospheric activity as a possible source of anomalous triplet-based O abundances at low Teff, they could not rule out contributions from starspots; at present this puzzle remains unsolved.
While the above works have established the complications present in using the triplet to derive reliable abundances, they have also provided guidance in how to derive abundances effectively. The NLTE calculations by Takeda (2003) indicate that the triplet NLTE corrections in dwarfs are approximately constant over the near-solar temperature range (5500–6000 K), with no significant dependence on metallicity. This has been verified by Schuler et al. (2006b), who found constant Hyades dwarf triplet abundances in the range 6200 K ≳ Teff ≳ 5500 K. These results imply that triplet NLTE departures can be nulled by a purely differential analysis of solar-type dwarfs in this Teff with respect to the Sun. In addition, such a differential analysis is arguably more robust than applying any particular set of triplet NLTE corrections directly, given that the NLTE corrections from various sources agree only tolerably well at best, as discussed by Takeda (2003); Figure 4 of Takeda (2003), which compares their NLTE corrections to those from other groups, indicates that the discrepancy is typically >0.05 dex. Furthermore, a differential analysis eliminates other complications, e.g., the discrepancy between the traditional value (∼8.90) of the absolute solar oxygen abundance supported by models of the solar interior derived from helioseismology, and the lower value (∼8.70) derived using recent three-dimensional model atmospheres (see the discussion in Pereira et al. 2009). In short, this differential approach should produce trustworthy relative abundances, thus allowing reliable study of the chemical evolution of O.
1.4. Oxygen in Open Clusters
A promising means to explore O evolution is by using open clusters, which can provide accurate ages and large sample sizes capable of yielding precise abundances. Two important, unresolved questions exist for open clusters (hereafter OCs), namely, (1) do they exhibit the same linear trend in [O/Fe] versus [Fe/H] evinced by field star data and chemical evolution models, and (2) can the [O/H] versus age relation found by K93 be verified? Answering these questions requires large, uniform samples of OCs spanning a wide range in both age and metallicity. K93's sample was limited by a small range in [Fe/H] (≲ 0.25 dex) and showed no trend in [O/Fe] versus [Fe/H].
More recently, Friel et al. (2010) produced O abundances for giants in 11 OCs, spanning a range of ∼0.4 dex in [Fe/H]. This sample exhibits a linear trend in [O/Fe] versus [Fe/H], but seemingly offset ∼0.15 dex below the trend typically seen in field star samples, as seen in their Figure 6, which also includes the field star data of Bensby et al. (2005). Friel et al. acknowledge the possibility of a systematic offset between their and other studies, but we reiterate the concerns over the use of the 6300 Å [O i] line discussed above, and note their limited sample statistics of ⩽4 stars per cluster.
Uniform studies of OC dwarf triplet abundances, which would allow testing of the [O/H] versus age relationship, have been particularly sparse. K93 remains the largest such survey to date (eight clusters), and while his stars are primarily in the required temperature range (6200 K ≳ Teff ≳ 5500 K) his data are low resolution (1.2–2.3 Å). As noted above, Schuler et al. (2004), King & Schuler (2005), and Schuler et al. (2006b) have produced dwarf triplet abundances for four OCs from high-resolution data, but all having ages ≲ 600 Myr, and these works do not focus on the "prime" Teff range. Additional OC dwarf triplet-based abundances were determined by Shen et al. (2007) in IC 4665, by Ford et al. (2005) in Blanco 1, and by Garcia Lopez et al. (1993) in the Hyades and the Ursa Major Group. Each of these studies included some prime Teff stars, though Garcia Lopez et al. (1993) focused mostly on hotter stars in vicinity of the Li Gap (Boesgaard & Tripco 1986), with stars near the warm end of the prime Teff range included. To our knowledge, these represent all OC dwarf triplet abundances reported in the literature. None of these studies provides an appropriate sample for investigating the outstanding questions discussed above, making plain the need for a new study of OC dwarf abundances.
This paper presents the first results of our ongoing study of oxygen abundances in OC dwarfs. This and future papers will establish a large sample of self-consistent oxygen abundances in OCs having a range in age and metallicity, with the objective of examining the [O/H] versus age and [O/Fe] versus [Fe/H] relationships, thereby testing oxygen's potential as a chemical tracer. Here we present our analysis of (1) the Hyades, a fundamental and extensively studied cluster that will provide a reference point for our metallicity and Teff scales, and (2) NGC 752, a moderately old (∼1.5 Gyr), slightly metal-poor cluster ([Fe/H] ∼ −0.05), which is also reasonably nearby (m − M = 8.4; Anthony-Twarog et al. 2009). Photometric and membership information for NGC 752 has been compiled by Daniel et al. (1994). Despite its relative proximity, it is arguably an understudied cluster; few spectroscopic metallicity determinations exist, and only one for oxygen (see the Discussion). This paper is organized as follows: in Section 2 we describe our data and reductions, and present our radial velocity and membership determinations; Section 3 describes our abundance analysis; in Section 4 we discuss the interpretation of our results, including comparison to previous works; Section 5 summarizes our conclusions.
2. DATA
2.1. Observations and Reductions
All data were acquired using the Hydra multi-object spectrograph on the WIYN6 3.5 m telescope. The spectra cover the range 7645–7985 Å, at a dispersion of 0.2 Å per pixel, a resolution of 0.5 Å (R ∼ 16, 000 at 7774 Å), and include 11 unblended Fe i lines in addition to the O i triplet. Spectra of Hyades stars were acquired on three separate runs: 8 stars in two configurations, 1996 November 1; 7 stars in six configurations, 1997 February 13–17; and 11 stars, using a single fiber at field center, 2008 January 3. The processed Hyades spectra have S/N in the range 100–340 pixel−1, with median ∼140. Spectra of 45 single stars in the field of NGC 752 were acquired 1996 September 23; 2.0 hr of total exposure were taken using one fiber configuration. The processed spectra have typical S/N in the range 60–140 pixel−1, for V = 15.5–11.8. Examples of our co-added, continuum-fitted master spectra are shown in Figure 1, which includes both the 1997 and 2008 daytime-sky solar spectra, and one star of near-solar Teff from each cluster.
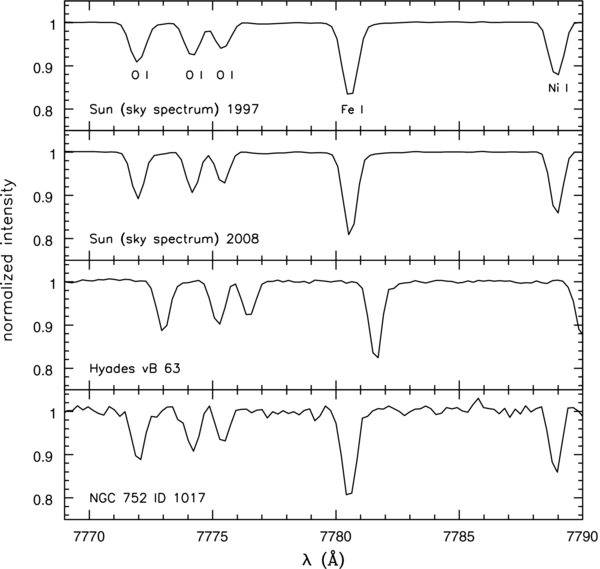
Figure 1. Examples of co-added, continuum-fitted spectra.
Download figure:
Standard image High-resolution imageData reduction employed standard IRAF7 techniques. Flat-fielding and aperture tracing used well exposed dome flats. Object spectra (only) were cleaned using the Laplacian Cosmic Ray removal routine of van Dokkum (2001). Spectra were wavelength calibrated with Th–Ar comparison spectra. Solar sky spectra were used for fiber-to-fiber throughput correction to facilitate night sky subtraction; however, we deemed sky subtraction unnecessary for our Hyads, given their brightness and the short exposure times used. All apertures of a single solar sky exposure from the 2008 January run were co-added to create a master solar spectrum, with S/N > 1400 near 7774 Å, to be used in deriving solar log gf values for the concurrent Hyades spectra. Appropriate solar spectra were not available for the other runs, and in those cases we employed an analogous master spectrum with S/N > 1300 from a 1997 November WIYN 3.5 m run. Equivalent widths were measured using the IRAF routine splot.
In this paper, we use the ID system of Van Bueren (1952) for the Hyades, and the ID system of Daniel et al. (1994) for NGC 752.
2.2. Radial Velocities and Membership Selection
Our targets were selected based on proper motions, as summarized in Perryman et al. (1998) for the Hyades, and as measured by Platais (1991) for NGC 752. All Hyads are highly probable proper motion members according to Perryman et al. (1998), whereas NGC 752 targets are either probable or possible proper motion members, all but two of which have Platais (1991) membership probabilities ⩾77%. For the interpretation of our abundances, we wished to consider only member stars that had no convincing evidence of binarity; we thus refined our samples using previous photometry (for the Hyades), our own radial velocities, and Fourier cross-correlation tests for binarity.
Radial velocities were calculated via direct wavelength measurements of up to 36 spectral lines per star. This method allowed us greater discrimination in choosing appropriate spectral features compared to determining radial velocities via Fourier cross-correlation, and produced smaller errors, typically <0.5 km s−1 (radial velocity errors are σμ, i.e., the standard error of the mean, unless otherwise stated), in almost all cases. Results for the Hyades are reported in Table 1, and a histogram is given in Figure 2. We see that three Hyads, vB 1, 2, and 110, are outliers from the primary envelope of the distribution, and so are inconsistent with radial velocity single-star membership; vB 1 and 2 were previously noted as possible multiple systems by Van Bueren (1952), and also have somewhat discrepant radial velocities in Perryman et al. (1998). Excluding these three, the mean radial velocity of the Hyads consistent with single-star membership is 39.4 ± 0.6 km s−1. All of our Hyads are designated as members by Perryman et al. (1998), who used radial velocities, proper motions, and Hipparcos parallaxes to determine membership from six-dimensional position and radial velocity information. The radial velocities reported by Perryman et al. (1998) for the single star member Hyads in our sample yield an average of 39.9 ± 0.4 km s−1; our values are thus on an identical scale, although it is important to note that Perryman et al. (1998) used proper motions and parallaxes to define radial velocities with respect to the cluster center. Thus, while our values are on a nearly identical scale on average, the individual values differ slightly from those reported by Perryman et al. (1998); the median difference between our values and those of Perryman et al. (1998) is −0.5 km s−1, with the majority of our values within ±1 km s−1 of theirs. We used the IRAF routine fxcor to calculate Fourier cross-correlation functions for all stars, in order to test for the possible contribution of a second set of spectral lines, and thus reveal otherwise undetected binarity; all Hyads in our sample were found to be single stars by this method.
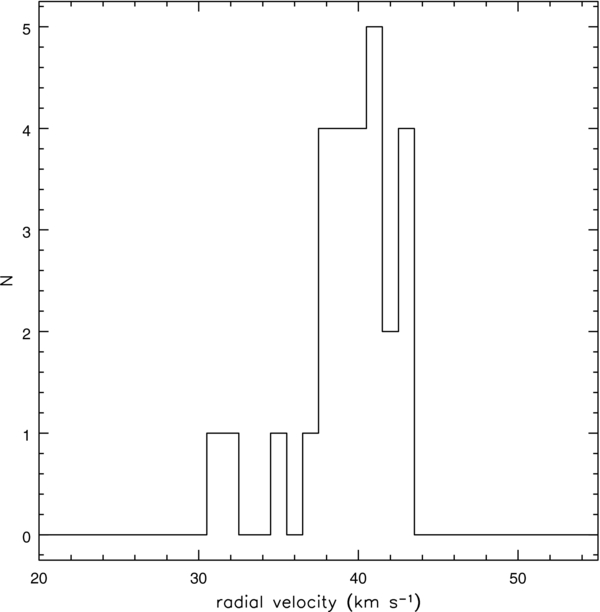
Figure 2. Histogram of radial velocity data for the Hyades.
Download figure:
Standard image High-resolution imageTable 1. Hyades Data and Atmospheric Parameters
| vB ID | vrad | σμ | N | vrad a | fxcor | phot. b | Single | (B − V) | σμ | Teff | δTeff | log g | vturb |
|---|---|---|---|---|---|---|---|---|---|---|---|---|---|
| (km s−1) | Lines | Member | Single | Single | Member | (K) | (K) | (km s−1) | |||||
| 1 | 30.66 | 0.34 | 22 | 0 | 1 | 1 | 0 | 0.570 | 0.005 | 6046 | 18 | 4.43 | 1.38 |
| 2 | 32.18 | 0.41 | 24 | 0 | 1 | 1 | 0 | 0.619 | 0.002 | 5871 | 7 | 4.47 | 1.19 |
| 10 | 37.75 | 0.25 | 20 | 1 | 1 | 1 | 1 | 0.577 | 0.006 | 6021 | 22 | 4.44 | 1.35 |
| 15 | 40.57 | 0.29 | 32 | 1 | 1 | 1 | 1 | 0.665 | 0.005 | 5712 | 17 | 4.50 | 1.02 |
| 17 | 41.98 | 0.23 | 35 | 1 | 1 | 1 | 1 | 0.694 | 0.005 | 5615 | 17 | 4.52 | 0.92 |
| 18 | 38.83 | 0.22 | 31 | 1 | 1 | 1 | 1 | 0.640 | 0.002 | 5798 | 7 | 4.48 | 1.11 |
| 27 | 38.03 | 0.28 | 25 | 1 | 1 | 1 | 1 | 0.728 | 0.002 | 5504 | 6 | 4.54 | 0.81 |
| 39 | 39.96 | 0.23 | 25 | 1 | 1 | 1 | 1 | 0.683 | 0.005 | 5652 | 17 | 4.51 | 0.96 |
| 49 | 39.24 | 0.24 | 28 | 1 | 1 | 0 | 0 | ||||||
| 52 | 38.35 | 0.30 | 29 | 1 | 1 | 1 | 1 | 0.611 | 0.004 | 5899 | 14 | 4.46 | 1.22 |
| 63 | 40.47 | 0.19 | 25 | 1 | 1 | 1 | 1 | 0.643 | 0.003 | 5787 | 10 | 4.49 | 1.10 |
| 64 | 42.64 | 0.39 | 28 | 1 | 1 | 1 | 1 | 0.666 | 0.003 | 5709 | 10 | 4.50 | 1.02 |
| 66 | 39.76 | 0.20 | 24 | 1 | 1 | 1 | 1 | 0.551 | 0.003 | 6116 | 11 | 4.41 | 1.46 |
| 73 | 39.59 | 0.29 | 34 | 1 | 1 | 1 | 1 | 0.605 | 0.003 | 5920 | 11 | 4.46 | 1.24 |
| 76 | 38.28 | 0.25 | 25 | 1 | 1 | 1 | 1 | 0.752 | 0.005 | 5428 | 16 | 4.55 | 0.80 |
| 79 | 39.06 | 0.28 | 22 | 1 | 1 | 1 | 1 | 0.820 | 0.003 | 5220 | 9 | 4.58 | 0.80 |
| 97 | 41.45 | 0.28 | 30 | 1 | 1 | 1 | 1 | 0.624 | 0.003 | 5853 | 11 | 4.47 | 1.17 |
| 99 | 41.45 | 0.36 | 28 | 1 | 1 | 1 | 1 | 0.861 | 0.002 | 5101 | 6 | 4.60 | 0.80 |
| 102 | 40.89 | 0.35 | 30 | 1 | 1 | 1 | 1 | 0.595 | 0.004 | 5956 | 14 | 4.45 | 1.28 |
| 105 | 39.08 | 0.21 | 24 | 1 | 1 | 1 | 1 | 0.569 | 0.003 | 6050 | 11 | 4.43 | 1.38 |
| 106 | 40.72 | 0.20 | 35 | 1 | 1 | 1 | 1 | 0.647 | 0.007 | 5773 | 24 | 4.49 | 1.08 |
| 110 | 35.30 | 0.22 | 24 | 0 | 1 | 1 | 0 | 0.687 | 0.004 | 5638 | 13 | 4.51 | 0.94 |
| 114 | 42.36 | 0.21 | 29 | 1 | 1 | 1 | 1 | 0.724 | 0.002 | 5517 | 6 | 4.53 | 0.82 |
| 127 | 42.69 | 0.34 | 19 | 1 | 1 | 1 | 1 | 0.726 | 0.007 | 5511 | 23 | 4.54 | 0.81 |
| 149 | 36.96 | 0.34 | 14 | 1 | 1 | 0 | 0 | ||||||
| 187 | 43.13 | 0.29 | 18 | 1 | 1 | 1 | 1 | 0.762 | 0.001 | 5397 | 3 | 4.55 | 0.80 |
Notes. aIn each of the membership evaluation columns, 1 = yes, and 0 = no. bBased on the standard deviation of the average (B − V), as described in the text.
Download table as: ASCIITypeset image
To provide an additional criterion for evaluating the membership of our Hyades stars, we employ the UBV photometry of Johnson & Knuckles (1955) and UBVRI photometry of Medoza (1967). Colors from these studies will also be used to determine our stellar Teff, as described below in Section 2.3. The difference between the two systems is dominated by the number of digits reported by each study (i.e., by discrepancies in the third decimal place); thus, we adopt the average of the two for UBV and Medoza (1967) only for RI. Empirical relations were derived between (B − V) and each of the nine other unique color combinations from these five filters, using a fiducial main sequence selected from the entire photometry set (i.e., not restricted to stars in the current sample). Each color was thereby transformed to an effective (B − V), and the values averaged (up to 10 per star). The mean transformed colors and the associated standard deviation of the mean (σμ) for each star are included in Table 1. The standard deviation on such a mean can also measure the relative contribution of any binary companion. On this basis we exclude from further analysis stars with standard deviations greater than a few times the median value for all stars, namely vB 49 and 149; previous evidence of multiplicity for vB 149 was noted by Perryman et al. (1998). However, we include several stars classified as spectroscopic binaries by Perryman et al. (1998) which nonetheless have standard deviations comparable to the known singles, namely vB 39, 63, 102, 106, and 114. Our final evaluation of single-star cluster membership is presented in Table 1: a "1" indicates consistency with single-star membership, and a "0" indicates that there is at least some evidence to the contrary. To ensure the robustness of our cluster average abundances, stars that are to be included in our cluster averages are required to fulfill all three single-star member criteria (radial velocity, fxcor, and photometry). However, we also retain vB 1, 2, and 110 in the abundance analysis, and report abundance values for these stars, even though they will not be included in the cluster averages.
In the case of NGC 752, an instrumental wavelength shift of uncertain origin occurred during the night, which could not be resolved via our available calibration data, making it impossible for us to define an independent absolute radial velocity scale. We thus shifted the average of our radial velocity values to match the average from Daniel et al. (1994) of the 25 stars in common for which they report radial velocities; this adjustment results in an error in our zero point of ∼0.2 km s−1. We report our full set of shifted NGC 752 radial velocities in Table 2, and present a histogram in Figure 3. The primary peak of the radial velocity distribution has a mean of 5.4 ± 0.1 km s−1; Daniel et al. (1994) reports 5.5 ± 0.6 km s−1 (standard deviation), for a slightly different set of stars. Pilachowski et al. (1988) report a mean of 4.9 ± 0.7 km s−1 (standard deviation), in reasonably good agreement with both our and the Daniel et al. (1994) values. Thirty-seven stars are included within ±3σ (σ = 0.81 km s−1) of our cluster average, and thus are consistent with single-star membership. We again used fxcor to test for binarity, and found no evidence for binarity in any of these 37 stars. Table 2 also includes the proper motion membership probabilities of Platais (1991) of these 37 stars: 25 have proper motion membership probabilities >95%, and the remaining 12 have membership probabilities from 77% to 89%. All of these 37 stars have also been designated as probable members or possible members by Daniel et al. (1994), based on proper motions and radial velocity criteria. Column 8 of Table 2 indicates our final evaluations of single-star cluster membership. One single-star member, 300, had a low S/N spectrum, which was unsuitable for the abundance analysis.

Figure 3. Histogram of radial velocity data for NGC 752.
Download figure:
Standard image High-resolution imageTable 2. NGC 752 Data and Atmospheric Parameters
| Star IDa | vrad | σμ | N | vradb | fxcor | Pμc | Single | (B − V)a | σa | Teff | δTeff | log g | vturb |
|---|---|---|---|---|---|---|---|---|---|---|---|---|---|
| (km s−1) | Lines | Member | Single | Member | (K) | (K) | (km s−1) | ||||||
| 300 | 7.17 | 0.71 | 29 | 1 | 1 | 82 | 1 | ||||||
| 361 | 5.33 | 0.41 | 21 | 1 | 1 | 85 | 1 | 0.724 | ... | 5537 | ... | 4.55 | 0.82 |
| 391 | 5.00 | 0.56 | 33 | 1 | 1 | 83 | 1 | 0.73 | ... | 5517 | ... | 4.55 | 0.80 |
| 413 | 4.67 | 0.41 | 29 | 1 | 1 | 99 | 1 | 0.517 | 0.022 | 6312 | 89 | 4.37 | 1.67 |
| 429 | 5.95 | 0.45 | 30 | 1 | 1 | 85 | 1 | 0.85 | ... | 5124 | ... | 4.62 | 0.80 |
| 517 | 5.55 | 0.28 | 28 | 1 | 1 | 86 | 1 | 0.83 | ... | 5186 | ... | 4.61 | 0.80 |
| 520 | 6.03 | 0.70 | 26 | 1 | 1 | 99 | 1 | 0.57 | ... | 6102 | ... | 4.43 | 1.42 |
| 552 | 15.89 | 0.49 | 30 | 0 | 1 | 99 | 0 | ||||||
| 563 | −2.82 | 0.79 | 31 | 0 | 1 | 23 | 0 | ||||||
| 575 | 5.86 | 0.77 | 30 | 1 | 1 | 84 | 1 | 0.76 | ... | 5415 | ... | 4.57 | 0.80 |
| 684 | 4.24 | 0.51 | 25 | 1 | 1 | 97 | 1 | 0.50 | ... | 6381 | ... | 4.35 | 1.75 |
| 699 | 8.10 | 0.58 | 28 | 0 | 1 | 99 | 0 | ||||||
| 701 | 5.03 | 0.33 | 31 | 1 | 1 | 98 | 1 | 0.69 | ... | 5656 | ... | 4.53 | 0.94 |
| 720 | 4.78 | 0.52 | 28 | 1 | 1 | 99 | 1 | 0.494 | 0.034 | 6405 | 139 | 4.34 | 1.78 |
| 722 | −32.60 | 0.40 | 34 | 0 | 1 | 66 | 0 | ||||||
| 723 | −5.87 | 0.70 | 28 | 0 | 1 | 87 | 0 | ||||||
| 748 | 4.44 | 0.39 | 33 | 1 | 1 | 83 | 1 | 1.198 | 0.007 | 4209 | 15 | 4.75 | 0.80 |
| 768 | 3.50 | 0.75 | 20 | 1 | 1 | 99 | 1 | 0.490 | ... | 6422 | ... | 4.34 | 1.80 |
| 783 | 5.31 | 0.32 | 32 | 1 | 1 | 99 | 1 | 0.61 | ... | 5949 | ... | 4.47 | 1.25 |
| 786 | 5.40 | 0.35 | 29 | 1 | 1 | 99 | 1 | 0.73 | ... | 5517 | ... | 4.55 | 0.80 |
| 790 | 4.61 | 0.64 | 30 | 1 | 1 | 90 | 1 | 0.529 | 0.018 | 6264 | 72 | 4.38 | 1.61 |
| 791 | 4.36 | 0.40 | 30 | 1 | 1 | 99 | 1 | 0.543 | 0.017 | 6208 | 67 | 4.40 | 1.55 |
| 828 | 9.69 | 0.35 | 31 | 0 | 1 | 90 | 0 | ||||||
| 847 | 6.24 | 0.73 | 27 | 1 | 1 | 78 | 1 | 1.03 | ... | 4609 | ... | 4.69 | 0.80 |
| 859 | 5.08 | 0.26 | 30 | 1 | 1 | 79 | 1 | 0.67 | ... | 5728 | ... | 4.52 | 1.01 |
| 864 | 5.51 | 0.32 | 27 | 1 | 1 | 99 | 1 | 0.578 | 0.017 | 6071 | 66 | 4.44 | 1.39 |
| 889 | 4.24 | 0.41 | 26 | 1 | 1 | 99 | 1 | 0.551 | 0.018 | 6177 | 71 | 4.41 | 1.51 |
| 917 | 5.70 | 0.57 | 27 | 1 | 1 | 82 | 1 | 0.93 | ... | 4884 | ... | 4.65 | 0.80 |
| 921 | 5.54 | 0.33 | 34 | 1 | 1 | 98 | 1 | 0.553 | 0.007 | 6169 | 27 | 4.41 | 1.50 |
| 952 | 4.92 | 0.45 | 29 | 1 | 1 | 99 | 1 | 0.54 | ... | 6220 | ... | 4.40 | 1.56 |
| 953 | 7.19 | 0.68 | 32 | 1 | 1 | 99 | 1 | 0.600 | 0.008 | 5987 | 30 | 4.46 | 1.29 |
| 964 | 2.56 | 0.34 | 29 | 0 | 1 | 98 | 0 | ||||||
| 983 | 5.43 | 0.21 | 28 | 1 | 1 | 99 | 1 | 0.61 | ... | 5949 | ... | 4.47 | 1.25 |
| 993 | 5.65 | 0.53 | 34 | 1 | 1 | 89 | 1 | 0.708 | ... | 5593 | ... | 4.54 | 0.87 |
| 999 | 5.53 | 0.59 | 32 | 1 | 1 | 87 | 1 | 0.67 | ... | 5728 | ... | 4.52 | 1.01 |
| 1007 | 6.36 | 0.63 | 33 | 1 | 1 | 97 | 1 | 0.556 | 0.042 | 6157 | 165 | 4.41 | 1.49 |
| 1017 | 5.88 | 0.45 | 32 | 1 | 1 | 99 | 1 | 0.66 | ... | 5764 | ... | 4.51 | 1.05 |
| 1027 | 5.11 | 0.34 | 32 | 1 | 1 | 96 | 1 | 0.541 | 0.036 | 6216 | 143 | 4.40 | 1.56 |
| 1083 | 6.18 | 0.65 | 26 | 1 | 1 | 99 | 1 | 0.484 | 0.007 | 6446 | 29 | 4.33 | 1.82 |
| 1107 | 4.20 | 0.36 | 26 | 1 | 1 | 84 | 1 | 0.66 | ... | 5764 | ... | 4.51 | 1.05 |
| 1129 | 6.55 | 0.51 | 24 | 1 | 1 | 99 | 1 | 0.481 | 0.007 | 6459 | 29 | 4.33 | 1.84 |
| 1161 | −2.09 | 0.62 | 28 | 0 | 1 | 86 | 0 | ||||||
| 1196 | 5.83 | 0.55 | 28 | 1 | 1 | 87 | 1 | 0.91 | ... | 4942 | ... | 4.65 | 0.80 |
| 1270 | 5.25 | 0.46 | 34 | 1 | 1 | 77 | 1 | 0.70 | ... | 5621 | ... | 4.54 | 0.90 |
| 1365 | 4.53 | 0.55 | 33 | 1 | 1 | 98 | 1 | 0.71 | ... | 5586 | ... | 4.54 | 0.86 |
Notes. aDaniel et al. (1994). bIn each of the membership evaluation columns, 1 = yes, and 0 = no. cPlatais (1991).
Download table as: ASCIITypeset image
2.3. Atmospheric Parameters
To derive abundances from our equivalent widths, we employ model atmospheres, which require knowledge of the stellar parameters Teff, log g, and vturb. Teff is derived using a color–Teff relation and knowledge of the cluster reddenings, while log g comes from matching a star's Teff to a suitable isochrone (see below for vturb). The reddening of the Hyades is very small: Taylor (1980) was unable to detect any, and reported a formal limit of 0.003 ± 0.002(σ) mag. Any unsuspected reddening at the few mmag level would be negligible for our purposes. For NGC 752, we adopt E(B − V) = 0.035 ± 0.005 mag from Daniel et al. (1994). From turnoff isochrone fitting, the Hyades age is generally found to be between 600 and 700 Myr (see, for example, Perryman et al. 1998; Pinsonneault et al. 2003); we adopt an age of 650 Myr. For NGC 752, we adopt an age of 1.45 Gyr as derived by Anthony-Twarog et al. (2009). The dwarfs of interest in this study are of substantially lower mass than the turnoff, and thus are presently evolving very slowly, and thus uncertainties in the cluster ages effect negligible changes in the isochrone-derived values for log g (and vturb). Finally, the metallicities assumed in the choices of isochrones are [Fe/H] = +0.13 and −0.06 for the Hyades and NGC 752, respectively (see Sections 3 and 4.1).
We use Kurucz (1979) model atmospheres (1993 distribution). Teff is calculated from (B − V), using the color–temperature relation of Deliyannis et al. (2002), who employ the Carney (1983) Teff–(B − V) relation, with the Cayrel et al. (1985) Hyades zero point and the Saxner & Hammarbach (1985) metallicity dependence (see also Thorburn et al. 1993; Deliyannis et al. 1994). For the Hyades, we use the mean (B − V) values derived as described above (and found in Table 1). We note for the Hyades that using the average (B − V) yields an identical Teff compared to the average derived from the individual color translations, except in the case of large scatter (i.e., strong evidence for binarity). As a measure of the error in Teff, Table 1 also shows change in Teff resulting from changing the mean (B − V) by one σμ. For NGC 752, we use the photometry of Daniel et al. (1994), who combine data from numerous studies and transform the data onto a common system; their photometry and errors (standard deviation; if reported by them) are given in Table 2, along with the implied errors in Teff. An initial [Fe/H] value is input, then iterated through the abundance analysis (see below) to consistency with the resulting cluster average. Log g is taken from the Yale-Yonsei (Y2) isochrones (Demarque et al. 2004) of appropriate age and metallicity, and is subsequently used with Teff to get vturb via Edvardsson et al. (1993). Atmospheric parameters are given in Tables 1 and 2.
3. ABUNDANCE ANALYSIS
We select our line list from the Moore et al. (1966) solar atlas, visually cross-checked using the Delbouille et al. (1989) photometric solar atlas, with the conditions that the lines were relatively isolated at the resolution of our data, and that they subsequently yielded abundances in reasonable agreement with the other lines of their respective species. The MOOG driver abfind (Sneden 1973, 2002 version) is used for our abundance analysis. We derive solar log gf values by requiring our measured solar equivalent widths to match the adopted abundances A(O) = 8.93 and A(Fe) = 7.45 for each of the respective lines. Our line list is shown in Table 3, together with measured solar equivalent widths and derived log gf values for both the 11/97 and 01/08 solar spectra. Our measured equivalent widths for our Hyads and NGC 752 stars are given in Tables 4 and 5, respectively.
Table 3. Line List and Solar Values
| Red Cable 11/97 | Blue Cable 12/07 | ||||||
|---|---|---|---|---|---|---|---|
| Species | λ | EP (eV) | Abund. | EW (mÅ) | log gf | EW (mÅ) | log gf |
| O i | 7771.944 | 9.15 | 8.93 | 73.0 | 0.384 | 72.0 | 0.374 |
| 7774.166 | 9.15 | 62.9 | 0.224 | 61.4 | 0.194 | ||
| 7775.388 | 9.15 | 49.4 | −0.026 | 47.3 | −0.064 | ||
| Fe i | 7719.038 | 5.03 | 7.45 | 24.6 | −1.131 | 24.9 | −1.131 |
| 7733.727 | 5.06 | 22.4 | −1.158 | 20.4 | −1.218 | ||
| 7745.500 | 5.09 | 26.3 | −1.049 | 26.3 | −1.05 | ||
| 7746.587 | 5.06 | 16.7 | −1.326 | 16.8 | −1.326 | ||
| 7751.137 | 4.99 | 47.0 | −0.725 | 46.1 | −0.735 | ||
| 7780.552 | 4.47 | 138.2 | 0.139 | 131.8 | 0.074 | ||
| 7802.473 | 5.09 | 17.2 | −1.294 | 16.8 | −1.304 | ||
| 7807.952 | 4.99 | 62.6 | −0.457 | 60.1 | −0.497 | ||
| 7844.555 | 4.84 | 12.2 | −1.71 | 11.3 | −1.75 | ||
| 7937.131 | 4.31 | 175.4 | 0.312 | 170.3 | 0.272 | ||
| 7941.094 | 3.27 | 44.1 | −2.45 | 47.3 | −2.39 | ||
Download table as: ASCIITypeset image
Table 4. Hyades Equivalent Width Data
| O i | Fe i | |||||||||||||
|---|---|---|---|---|---|---|---|---|---|---|---|---|---|---|
| vB ID | 7771 | 7774 | 7775 | 7719 | 7733 | 7745 | 7746 | 7751 | 7780 | 7802 | 7807 | 7844 | 7937 | 7941 |
| 1 | 120.9 | ... | 82.7 | 36.9 | ... | ... | ... | 57.9 | 161.6 | ... | 71.8 | ... | 169.2 | 44.1 |
| 2 | 96.5 | 85.7 | 77.0 | 37.5 | ... | 22.2 | 29.3 | 67.7 | 149.1 | 24.6 | 87.0 | ... | 176.9 | 51.6 |
| 10 | 98.5 | 85.3 | 70.6 | ... | ... | ... | 20.7 | 51.9 | 129.2 | ... | 68.9 | ... | 165.2 | 42.6 |
| 15 | 75.9 | 69.4 | 60.1 | 32.6 | ... | 31.9 | 29.3 | 60.7 | 149.5 | 24.9 | 80.6 | ... | 179.3 | 41.4 |
| 17 | 71.2 | 67.5 | 42.4 | ... | 28.1 | 35.1 | 28.5 | 53.4 | 164.9 | 21.8 | 69.4 | 21.3 | 194.5 | 50.4 |
| 18 | 89.0 | 82.4 | 58.1 | 31.8 | ... | 25.6 | 19.8 | 60.6 | 152.5 | 17.0 | 70.3 | 18.4 | 168.7 | 42.4 |
| 27 | 68.1 | ... | 47.1 | 42.6 | ... | ... | ... | 66.2 | 168.3 | 25.0 | 89.5 | 25.6 | 218.1 | 57.1 |
| 39 | 70.9 | 62.4 | 49.3 | 40.4 | 25.1 | 26.7 | 25.3 | 48.2 | ... | 17.2 | 66.4 | 18.3 | ... | 48.4 |
| 52 | 85.6 | 83.3 | 69.5 | 32.9 | ... | 21.2 | 16.9 | 46.0 | 117.8 | 16.1 | 64.8 | 12.7 | ... | 43.0 |
| 63 | 75.1 | 68.3 | 54.5 | 32.7 | 19.2 | 23.3 | 21.4 | 48.4 | ... | 20.1 | 65.8 | 17.6 | ... | 48.7 |
| 64 | 81.8 | 68.4 | 53.0 | 41.1 | 21.5 | 32.8 | 27.3 | 61.4 | 136.2 | 23.0 | 79.6 | 17.4 | 155.6 | 52.6 |
| 66 | 114.4 | 104.4 | 79.3 | 26.6 | ... | 23.1 | ... | 44.4 | 127.0 | 15.2 | 62.3 | 12.6 | 157.5 | 35.7 |
| 73 | 102.8 | 89.3 | 66.7 | 36.8 | 17.6 | 23.4 | 20.9 | 47.0 | 139.1 | 16.6 | 71.5 | 14.0 | 156.5 | 38.7 |
| 76 | 53.9 | 43.9 | 38.9 | 48.5 | ... | 38.3 | 34.5 | 68.2 | 185.5 | 23.0 | 81.7 | ... | 234.0 | 54.4 |
| 79 | ... | ... | ... | 56.8 | ... | 50.0 | 37.4 | 64.6 | 189.0 | 27.1 | 76.4 | ... | 242.5 | 58.5 |
| 97 | 93.6 | 76.8 | 64.5 | 35.4 | ... | 26.3 | 24.2 | 47.9 | 136.1 | 17.7 | 73.7 | 16.1 | 173.0 | 44.9 |
| 99 | ... | ... | ... | 37.0 | ... | 34.7 | 34.0 | 66.8 | 201.9 | 26.5 | 84.8 | 16.5 | 247.4 | 62.2 |
| 102 | 100.8 | 84.9 | 69.9 | 33.4 | 15.7 | 25.9 | 21.4 | 48.0 | 123.5 | 17.5 | 68.5 | 16.3 | 145.9 | 44.7 |
| 105 | 118.7 | 92.6 | 77.0 | 34.1 | ... | 24.3 | ... | 48.8 | 133.7 | ... | 66.7 | ... | 165.9 | 38.3 |
| 106 | 87.0 | 70.9 | 53.6 | 42.8 | 17.4 | 25.2 | 21.9 | 53.9 | 126.4 | 21.5 | 74.2 | 19.4 | ... | 54.5 |
| 110 | 65.1 | 58.1 | 46.7 | 37.2 | ... | 29.8 | ... | 53.2 | 135.8 | 16.8 | 67.1 | ... | 175.4 | ... |
| 114 | 70.0 | 60.3 | 39.9 | ... | 23.0 | 42.5 | 27.6 | 68.0 | 164.7 | 24.3 | 72.2 | ... | 189.8 | 57.6 |
| 127 | 57.4 | ... | 37.2 | ... | ... | 37.9 | ... | 59.0 | 171.8 | 24.2 | 75.3 | ... | 218.5 | 59.8 |
| 187 | 59.9 | 55.1 | ... | ... | ... | ... | ... | 71.8 | 188.6 | ... | 86.1 | ... | 224.2 | 55.2 |
Download table as: ASCIITypeset image
Table 5. NGC 752 Equivalent Width Data
| O i | Fe i | |||||||||||
|---|---|---|---|---|---|---|---|---|---|---|---|---|
| Star IDa | 7771 | 7774 | 7775 | 7719 | 7733 | 7745 | 7751 | 7780 | 7802 | 7807 | 7937 | 7941 |
| 361 | 49.3 | ... | ... | 33.6 | ... | 27.4 | ... | 149.9 | ... | 92.2 | 235.6 | 48.0 |
| 391 | 57.9 | 52.9 | 44.6 | 26.4 | ... | 21.9 | 53.1 | 158.8 | 18.7 | 70.6 | 174.3 | 48.6 |
| 413 | 105.3 | 93.3 | 73.0 | 15.1 | ... | 16.8 | 50.0 | 100.6 | ... | 43.8 | 109.3 | 29.6 |
| 429 | 38.6 | 34.0 | ... | ... | ... | ... | 44.8 | 190.3 | 16.3 | 68.3 | 232.2 | 63.5 |
| 517 | ... | ... | 33.8 | 26.0 | ... | 23.0 | ... | 162.4 | 18.8 | 58.7 | 233.2 | 40.2 |
| 520 | 89.5 | 80.1 | 73.1 | 18.1 | ... | ... | 23.9 | 122.6 | 14.3 | 53.9 | 147.8 | ... |
| 575 | 37.0 | 64.0 | ... | 50.2 | ... | ... | 66.2 | 132.9 | ... | 79.7 | 164.1 | 35.8 |
| 684 | 107.1 | 95.6 | ... | ... | ... | 20.1 | ... | 106.5 | ... | 48.3 | 125.4 | 29.8 |
| 701 | 58.9 | 52.0 | 36.8 | 29.4 | ... | 32.2 | 42.1 | 142.1 | ... | 67.8 | 165.2 | 43.3 |
| 720 | 117.3 | 105.3 | 76.2 | 17.5 | ... | 22.7 | 26.3 | 88.6 | ... | 43.9 | 114.5 | 13.4 |
| 748 | 72.0 | 58.3 | 40.9 | ... | ... | 17.4 | ... | 119.7 | ... | 54.7 | 169.2 | 33.2 |
| 768 | 129.2 | 101.8 | ... | ... | ... | ... | ... | ... | ... | ... | 113.4 | ... |
| 783 | 104.4 | 99.1 | 73.6 | 25.7 | ... | 14.8 | 58.7 | 98.5 | ... | 53.4 | 113.3 | 29.1 |
| 786 | 66.0 | ... | ... | ... | ... | 25.2 | 38.5 | 158.1 | ... | 57.9 | 180.3 | 35.1 |
| 790 | 114.4 | 107.3 | 70.9 | ... | ... | 13.4 | ... | 94.3 | ... | 57.4 | 114.5 | 19.6 |
| 791 | 99.9 | 82.9 | 74.2 | 17.6 | ... | 14.6 | ... | 101.0 | ... | 50.6 | 126.9 | 15.4 |
| 847 | 25.8 | ... | ... | 48.6 | ... | 36.9 | ... | 176.9 | ... | 66.3 | 231.3 | 59.0 |
| 859 | ... | 47.3 | 34.6 | 23.3 | ... | 28.8 | ... | 169.1 | 18.8 | 76.3 | 208.6 | 40.5 |
| 864 | 100.9 | 74.0 | 54.9 | ... | ... | 21.3 | ... | 106.5 | ... | 52.1 | 123.2 | 21.4 |
| 889 | 78.1 | 71.4 | 49.5 | 15.6 | ... | 20.0 | ... | 87.3 | ... | ... | 143.5 | 24.4 |
| 917 | ... | ... | 31.4 | 54.4 | ... | 43.2 | ... | 166.2 | ... | 76.7 | 233.1 | 55.8 |
| 921 | 95.6 | 76.8 | 68.6 | ... | 17.7 | 26.3 | ... | 97.6 | 18.7 | 49.7 | 129.5 | 26.8 |
| 952 | 109.3 | 81.6 | 69.4 | 19.4 | ... | 18.0 | 21.0 | 97.4 | 8.5 | 33.1 | 119.0 | 20.8 |
| 953 | 90.4 | 83.2 | 62.5 | 18.4 | 10.1 | 19.4 | 47.4 | 118.1 | 8.8 | 50.4 | 145.9 | 34.9 |
| 983 | 65.1 | ... | 48.9 | 24.4 | ... | 20.0 | ... | 117.2 | 14.8 | 60.1 | 155.9 | 30.9 |
| 993 | 54.2 | 50.1 | 40.1 | 46.7 | ... | 35.9 | ... | 127.5 | ... | 61.1 | 177.9 | 36.3 |
| 999 | 72.8 | 48.4 | 40.8 | 30.6 | ... | 25.3 | ... | 142.7 | ... | ... | 177.3 | 34.0 |
| 1007 | 93.0 | 70.8 | ... | 22.6 | ... | ... | ... | 121.2 | ... | 63.7 | 126.2 | 34.0 |
| 1017 | 71.6 | 57.4 | 42.1 | 43.8 | 16.8 | 30.8 | 28.6 | 140.9 | ... | 60.8 | 173.6 | 45.8 |
| 1027 | 95.8 | ... | 68.7 | 27.9 | ... | 25.3 | ... | 107.5 | ... | 49.3 | 131.5 | ... |
| 1083 | 139.4 | 119.2 | 90.4 | ... | ... | 8.8 | 19.7 | 79.9 | ... | 38.0 | ... | 12.9 |
| 1107 | 65.7 | 49.5 | ... | ... | ... | ... | ... | 134.1 | ... | 66.3 | 198.2 | 51.8 |
| 1129 | 131.1 | 113.5 | 95.4 | ... | ... | ... | ... | 91.0 | ... | ... | 104.4 | ... |
| 1196 | 41.3 | ... | ... | ... | ... | ... | ... | 174.2 | 24.9 | 84.0 | 211.1 | 51.5 |
| 1270 | 47.8 | 36.3 | ... | 28.2 | ... | ... | ... | 159.2 | ... | 52.5 | 203.1 | 50.3 |
| 1365 | 69.5 | ... | 49.4 | 36.8 | 20.2 | 22.2 | 26.9 | 143.7 | ... | 53.4 | 168.6 | 41.3 |
Note. aDaniel et al. (1994).
Download table as: ASCIITypeset image
For each star, average [O/H] and [Fe/H] were computed in linear space; that is, for each line, the logarithmic abundances were first converted to absolute linear-scale abundances, and only then was a stellar average computed using all lines for that star. The result was then converted back to a logarithmic abundance. The errors (standard deviation of the mean) were computed in linear space, and are thus double-valued in logarithmic space. The average [O/H] and [Fe/H] for each star are presented in Tables 6 and 7 for the Hyades and NGC 752, respectively, and Figures 4 and 5 show the (average) [O/H] and [Fe/H] for each star versus Teff; star 748 of NGC 752, the coolest star in our sample, is not shown in the top panel of Figure 5 due to its unusually high [O/H], which is elevated well above even the other cool NGC 752 dwarfs, as is discussed below. While NLTE is not a concern for Fe, Schuler et al. (2006a) have suggested and Schuler et al. (2009) have demonstrated that Fe lines with excitation potential ≳ 4.5 eV exhibit an increasing trend in stars with Teff ≲ 5500 K, similar to but not as substantial as the prominent trend seen for the O triplet lines. As with oxygen, this is suspected to be the result of chromospheric or rotation-related activity. In the bottom panels of Figures 4 and 5, the black, solid squares for stars with Teff < 5500 K are [Fe/H] averages that include only lines with excitation potential <4.5eV. By contrast, the red, empty squares in the bottom panel of Figure 4 are [Fe/H] averages for Hyades stars with all lines included, which demonstrate clearly the overabundance trend suggested by Schuler et al. (2009). Based on these considerations, we omit lines with excitation potential (EP) > 4.5 eV for Teff < 5500 K from our cluster average abundances derived below, and from the stellar averages listed in Tables 6 and 7. Note that including the high-EP lines in stars with Teff > 5500 K does not affect those stars' [Fe/H] significantly. Note also that vB 1 and 2 (open triangles) exhibit anomalously high abundances of both O and Fe compared to Hyads of similar Teff. Our high [Fe/H] for these stars confirm (to better than 0.01 dex for each star) a similar finding first reported by Paulson et al. (2003), strengthening the case that these stars are truly anomalous in some way. Three proper motion studies of vB 1 and two out of three proper motion studies of vB 2 listed in Perryman et al. (1998) designate these stars as proper motion members. However, de Bruijne et al. (2001) disagree. As discussed above, these stars have just slightly discrepant radial velocities compared to the single-star radial velocity peak, but they do not exhibit aberrant values of the transformed colors described above. They also have Hipparcos distances consistent with cluster membership Perryman et al. (1998). We refer the reader also to the more detailed discussion of vB 1 and 2 in Paulson et al. (2003). In view of these mysteries, they are excluded from the cluster averages; as noted above, vB 110 is also omitted from the cluster averages, as it does not fulfill all three of our single star membership criteria. Finally, the triplet lines in our spectra of the Hyads vB 79 and 99 were deemed unreliable due to unidentified irregularities in the line profiles, and our spectrum of the star 575 in NGC 752 had S/N too low for confident identification of the triplet lines, so only Fe abundances are reported for these three stars.

Figure 4. [O/H] vs. Teff (top panel) and [Fe/H] vs. Teff (bottom panel) for the Hyades. Dashed lines show the cluster mean, and dotted lines indicate the standard deviation of the mean (σμ). Stars included in the average (see text) are shown as solid black squares. vB 1, vB 2, and vB 110 (discussed in text) are shown as open blue triangles. Other stars are shown as open magenta circles. For [Fe/H], the empty red squares for Teff < 5500 K show the star averages including all lines, whereas the corresponding black squares show the average with only EP < 4.5 eV lines included.
Download figure:
Standard image High-resolution image
Figure 5. [O/H] vs. Teff (top panel) and [Fe/H] vs. Teff (bottom panel) for NGC 752. Dashed lines show the cluster mean, and dotted lines indicate the standard deviation of the mean (σμ). Stars included in the cluster averages are shown as solid black squares, and the others as open magenta circles (see text).
Download figure:
Standard image High-resolution imageTable 6. Abundance Averages for Each Star for the Hyades
| vB ID | [O/H] | σμ ± | N | [Fe/H] | σμ ± | N |
|---|---|---|---|---|---|---|
| Lines | Lines | |||||
| 1 | 0.361 |  |
2 | 0.297 |  |
6 |
| 2 | 0.349 |  |
3 | 0.292 |  |
9 |
| 10 | 0.140 |  |
3 | 0.166 |  |
6 |
| 15 | 0.214 |  |
3 | 0.185 |  |
9 |
| 17 | 0.210 |  |
3 | 0.155 |  |
10 |
| 18 | 0.241 |  |
3 | 0.133 |  |
10 |
| 27 | 0.326 |  |
2 | 0.173 |  |
3 |
| 39 | 0.163 |  |
3 | 0.111 |  |
9 |
| 52 | 0.186 |  |
3 | 0.059 |  |
9 |
| 63 | 0.084 |  |
3 | 0.102 |  |
9 |
| 64 | 0.198 |  |
3 | 0.171 |  |
11 |
| 66 | 0.255 |  |
3 | 0.120 |  |
9 |
| 73 | 0.249 |  |
3 | 0.109 |  |
11 |
| 76 | 0.198 |  |
3 | 0.189 |  |
3 |
| 79 | ... | ... | ... | 0.105 |  |
3 |
| 97 | 0.212 |  |
3 | 0.144 |  |
10 |
| 99 | ... | ... | ... | 0.112 |  |
3 |
| 102 | 0.191 |  |
3 | 0.110 |  |
11 |
| 105 | 0.275 |  |
3 | 0.167 |  |
7 |
| 106 | 0.167 |  |
3 | 0.159 |  |
10 |
| 110 | 0.132 |  |
3 | 0.089 |  |
7 |
| 114 | 0.254 |  |
3 | 0.176 |  |
9 |
| 127 | 0.115 |  |
2 | 0.201 |  |
7 |
| 187 | 0.367 |  |
2 | 0.169 |  |
3 |
Download table as: ASCIITypeset image
Table 7. Abundance Averages for Each Star for NGC 752
| Star IDa | [O/H] | σμ ± | N | [Fe/H] | σμ ± | N |
|---|---|---|---|---|---|---|
| Lines | Lines | |||||
| 361 | −0.100 | ... | 1 | 0.132 |  |
6 |
| 391 | 0.162 |  |
3 | −0.023 |  |
8 |
| 413 | −0.093 |  |
3 | −0.024 |  |
7 |
| 429 | 0.286 |  |
2 | −0.006 |  |
3 |
| 517 | 0.450 | ... | 1 | −0.178 |  |
3 |
| 520 | −0.010 |  |
3 | −0.046 |  |
6 |
| 575 | ... | ... | ... | −0.301 |  |
3 |
| 684 | −0.115 |  |
2 | −0.002 |  |
5 |
| 701 | −0.062 |  |
3 | 0.000 |  |
7 |
| 720 | −0.054 |  |
3 | −0.093 |  |
7 |
| 748 | 2.85 |  |
3 | −0.347 |  |
3 |
| 768 | 0.035 |  |
2 | −0.330 | ... | 1 |
| 783 | 0.289 |  |
3 | −0.064 |  |
7 |
| 786 | 0.220 | ... | 1 | −0.133 |  |
6 |
| 790 | 0.046 |  |
3 | −0.159 |  |
5 |
| 791 | −0.061 |  |
3 | −0.152 |  |
6 |
| 847 | 0.850 | ... | 1 | −0.146 |  |
3 |
| 859 | −0.230 |  |
2 | 0.099 |  |
7 |
| 864 | −0.049 |  |
3 | −0.154 |  |
5 |
| 889 | −0.314 |  |
3 | −0.114 |  |
5 |
| 917 | 0.890 | ... | 1 | −0.171 |  |
3 |
| 921 | −0.094 |  |
3 | 0.002 |  |
7 |
| 952 | −0.058 |  |
3 | −0.182 |  |
8 |
| 953 | 0.048 |  |
3 | −0.094 |  |
9 |
| 983 | −0.230 |  |
2 | −0.034 |  |
7 |
| 993 | 0.003 |  |
3 | 0.068 |  |
6 |
| 999 | −0.060 |  |
3 | −0.013 |  |
5 |
| 1007 | −0.163 |  |
2 | 0.040 |  |
5 |
| 1017 | −0.061 |  |
3 | 0.054 |  |
8 |
| 1027 | −0.110 |  |
2 | 0.043 |  |
5 |
| 1083 | 0.122 |  |
3 | −0.30 |  |
5 |
| 1107 | −0.150 |  |
2 | 0.087 |  |
4 |
| 1129 | 0.071 |  |
3 | −0.392 |  |
2 |
| 1196 | 0.620 | ... | 1 | −0.203 |  |
3 |
| 1270 | −0.263 |  |
2 | 0.023 |  |
5 |
| 1365 | 0.231 |  |
2 | −0.093 |  |
8 |
Note. aDaniel et al. (1994).
Download table as: ASCIITypeset image
Our average cluster abundances are computed using all individual line measurements of a given species from all stars (with some exceptions, as noted below), weighted linearly by the inverse abundance error for each line; we choose linear weighting as opposed to quadratic to moderate the contribution of stronger lines, which have small fractional errors. The standard error of the mean of each cluster average is the formal value for a linearly weighted mean. The abundance error for each line is computed using MOOG, by taking the difference between the base abundance value for a line and the abundance yielded by EW + σEW, so that the abundance errors are robust and proper over all regimes of the curve of growth (COG). This allows lines that may be slightly off the linear portion of the COG to contribute to the average, but with less weighting. However, we do not use lines with EW > 175 mÅ, which are too strong to give accurate abundances inasmuch as such lines are highly sensitive to the treatment of damping. We find that inclusion of lines above this limit increases the uncertainty in the mean, indicating that such lines no longer contribute additional useful information to the average.
For the Hyades, we find a cluster average [Fe/H] = 0.131 ± 0.009, based on 24 stars (the error is the weighted σμ, as noted above). If we were to include the high-EP lines for stars with Teff < 5500 K, the cluster average would have increased by ∼0.02 dex (to [Fe/H] ∼ 0.15), which is ∼2 times the standard deviation of the mean, providing a slight statistical support to the idea that these lines cause an overabundance trend in the cooler dwarfs. (If vB 1 and 2 had been included, the cluster average would have been even higher.) In the case of NGC 752, the three hottest stars of our sample (768, 1083, and 1129) have Fe abundances ∼0.3 dex lower than is typical for the sample, even compared to stars of immediately lower Teff, and we thus omit these stars from our cluster average. For NGC 752, we find a cluster average [Fe/H] = −0.063 ± 0.014 (standard deviation of the weighted mean). If we were to include the high-EP lines for stars with Teff < 5500 K, the cluster average would have increased by only ∼0.014 dex, equal to the standard deviation of the mean. However, in the case of NGC 752, including the high-EP lines in the cool star averages would not reveal an overabundance trend, and in fact, one could argue that without the high-EP lines (shown as black squares in Figure 5) the cool stars might appear as very slightly underabundant compared to the rest of the cluster; nonetheless, we omit the high-EP lines in these stars to be self-consistent.
Given the uncertainty in the behavior of the low-Teff triplet overabundance trend, we must evaluate the precise limits of the prime-Teff range for each cluster, in order to maximize the sample which is suitably reliable for inclusion in the cluster [O/H] average. The range 5400 K ≲ Teff ≲ 6100 K covered by our Hyades data is limited to that for which we expect constant triplet abundances, and indeed the data exhibit no trend with Teff; a least-squares fit to the data confirms an insignificant slope of (2 ± 8) × 10−5 dex K−1. The Schuler et al. (2006b) Hyades sample covers a greater range in Teff; they also discern no trend in [O/H] with Teff over the range 5450 K ≲ Teff ≲ 6100 K. Therefore, we include all stars in the range 5400 K < Teff < 6100 K (except vB 1, vB 2, and vB 110 as noted above), and find a Hyades cluster mean of [O/H] = 0.197 ± 0.010 (Nstars = 17). Note that vB 110 has [O/H] and [Fe/H] values that are, in fact, typical of the Hyads in our sample. Including vB 110 in the cluster averages would increase [O/H] and [Fe/H] by only 0.002 dex and 0.001 dex, respectively, and so its inclusion or exclusion has no significant effect on our Hyades cluster averages. The wider temperature range of our NGC 752 sample clearly exhibits the low-Teff overabundance trend, and possibly shows a hint of the high-Teff overabundance trend as well. It is clear from Figure 5 that stars below 5500 K show a substantial increase in [O/H] as compared to stars above 5500 K, and it is even possible that this increase is evident already in a few stars with 5500 K < Teff < 5600 K. Above 5600 K, the average abundance remains relatively constant until at least 6200 K. We therefore select 5600 K < Teff < 6200 K for our NGC 752 average, which yields [O/H] = −0.077 ± 0.020 (Nstars = 14). However, we have omitted from the average star 783, which has a substantially higher [O/H] than the other members in this prime temperature range, and also has a high X-ray luminosity, as will be discussed in the next section. The cluster average [Fe/H] and [O/H] and associated statistics are reported in Table 8.
Table 8. Summary of Results
| Cluster | Age | [O/H] | σμ ± | N | Δa | [Fe/H] | σμ ± | N | Δa |
|---|---|---|---|---|---|---|---|---|---|
| (Myr) | Lines:Stars | Lines:Stars | |||||||
| Hyades | 650 | 0.197 |  |
46 : 16 | −0.039 | 0.131 |  |
149:21 | 0.003 |
| NGC 752 | 1450 | −0.077 |  |
37 : 14 | −0.028 | −0.063 |  |
171:33 | 0.004 |
Note. aDue to a systematic error in reddening of +0.005; see the discussion in Section 3.
Download table as: ASCIITypeset image
Table 9 illustrates the sensitivity of our stellar abundances to random errors in the atmospheric parameters of +50 K, +0.1 dex, and +0.1 km s−1 in Teff, log g, and vt, respectively, where each parameter is varied independently. Three cases are shown, corresponding to (1) a star near the hot edge of the prime temperature range (vB 66, D520), (2) one near the cool edge (vB 17, D993), and (3) one near solar Teff (vB 63, D1017). While the values of +50 K, +0.1 dex, and +0.1 km s−1 listed above are similar to those of typical examples in the literature, it should be noted that, in the case of the Hyades, for each and every star, the typical change in Teff due to the σμ in (B − V) is substantially smaller than 50 K. However, in the relatively few cases where σμ(B − V) can be calculated for NGC 752, some implied changes in Teff are smaller than 50 K while others are larger; new, improved photometry of this cluster would be helpful.
Table 9. Sensitivity of Abundances to Independent Changes in Atmospheric Parameters
| Δ[O/H] | Δ[Fe/H] | |||||
|---|---|---|---|---|---|---|
| Star ID | Teff | log g | vturb | Teff | log g | vturb |
| δ = +50 | δ = +0.1 | δ = +0.1 | δ = +50 | δ = +0.1 | δ = +0.1 | |
| Hyades | ||||||
| vB 66 | −0.050 | 0.007 | −0.020 | 0.028 | −0.007 | −0.012 |
| vB 63 | −0.047 | 0.043 | −0.007 | 0.022 | −0.003 | −0.013 |
| vB 17 | −0.060 | 0.043 | −0.010 | 0.020 | −0.011 | −0.015 |
| NGC 752 | ||||||
| 520 | −0.040 | 0.023 | −0.010 | 0.029 | −0.012 | −0.013 |
| 1017 | −0.040 | 0.047 | −0.007 | 0.030 | −0.014 | −0.013 |
| 993 | −0.054 | 0.050 | −0.004 | 0.024 | −0.014 | −0.016 |
Note. The stars in this table are ordered from hottest to coolest within each cluster.
Download table as: ASCIITypeset image
It is important to note that, due to how we calculate log g and vt, errors in these parameters are not random and independent, but rather are correlated to the random error in Teff. Table 10 shows the effect of a random error of 50 K in Teff on the derived log g, and then the effect of changing both of these on the derived vt; also shown is the resulting overall change in stellar abundance due the sum total of all three (correlated) parameter changes. We expect that the random errors average out from star to star (and line to line), presumably resulting (partly) in the relatively small σμ in the cluster averages.
Table 10. Sensitivity of Abundances to Dependent Changes in Atmospheric Parameters
| Star ID | ΔTeff | Δlog g | Δvturb | Δ[O/H] | Δ[Fe/H] | ΔTeffa | Δlog g | Δvturb | Δ[O/H] | Δ[Fe/H] |
|---|---|---|---|---|---|---|---|---|---|---|
| Hyades | ||||||||||
| vB 66 | 50 | −0.01 | 0.05 | −0.060 | 0.020 | 19 | 0.00 | 0.02 | −0.030 | 0.008 |
| vB 63 | 50 | −0.01 | 0.05 | −0.067 | 0.018 | 18 | −0.01 | 0.01 | −0.030 | 0.006 |
| vB 17 | 50 | −0.01 | 0.05 | −0.094 | 0.013 | 17 | 0.00 | 0.01 | −0.047 | 0.002 |
| NGC 752 | ||||||||||
| 520 | 50 | −0.01 | 0.06 | −0.057 | 0.022 | 20 | 0.00 | 0.02 | −0.027 | 0.007 |
| 1017 | 50 | −0.01 | 0.05 | −0.057 | 0.025 | 18 | 0.00 | 0.02 | −0.027 | 0.007 |
| 993 | 50 | −0.01 | 0.06 | −0.084 | 0.017 | 17 | 0.00 | 0.02 | −0.040 | 0.002 |
Notes. The stars in this table are ordered from hottest to coolest within each cluster. aDue to a change in reddening of +0.005.
Download table as: ASCIITypeset image
Among tractable systematic errors, there are those that might affect the cluster averages, and there are those that do not; there also those that are likely intractable. Fortunately, systematic errors in the color–Teff scale, the isochrone gravities, or the vt will act in almost exactly the same way from cluster to cluster, and are thus expected to have negligible effects when the cluster average abundances are compared to each other (assuming the various clusters have been analyzed in the same way, as we have done here and plan to do in our future studies). Conversely, a systematic error that is potentially tractable, and that might vary from cluster to cluster, is the cluster reddening, which can affect the Teff of all prime-Teff in a similar way. We evaluate the effects of potential errors in the cluster reddenings on our cluster abundances as follows. Recall that the error in the reddening of NGC 752 is 0.005 mag, and we can take the same value as a conservative upper limit for the reddening of the Hyades (see Section 2.3; note that the Hyades reddening can only increase, whereas by contrast, the reddening of NGC 752 can go either up or down). We have calculated the changes in all the stellar Teff that result from a reddening increase of 0.005, the corresponding changes in all the stellar log g, and the corresponding changes in all the stellar vt. Table 8 includes the "systematic errors" in the cluster average abundances that result, via these correlated changes in the atmospheric parameters, from the stated change in reddening; we have also shown in Table 10 the effect of this same change in reddening on the individual stellar average abundances for the selected stars. The changes in the cluster [Fe/H] averages are not significant; each is ∼3 times smaller than the corresponding σμ. For [O/H] the changes are much larger, ∼4 times σμ for the Hyades [O/H], and ∼1.5 times σμ for the NGC 752 [O/H]. This is not surprising given the temperature sensitivity of the triplet lines, which is a consequence of their high excitation potential; nonetheless, these "systematic errors" are still less than 10% of the cluster [O/H] averages.
4. DISCUSSION
4.1. Comparison with Previous Studies
Using the triplet in Hyades dwarfs, King (1993) reports a rather high [O/H] = 0.28 ± 0.10 for the Hyades, though consistent with ours to within his errors. Schuler et al. (2006b) report [O/H] = 0.25 ± 0.02, also using the triplet in Hyades dwarfs; however, using the 6300 Å [O i] line, Schuler et al. (2006a) find [O/H] = 0.14 ± 0.02 for Hyades dwarfs and [O/H] = 0.08 ± 0.02 for Hyades giants. None of these values are in good agreement with each other or with our own value. Boesgaard (2005) also uses the triplet in dwarfs, reporting [O/H] = 0.17 ± 0.01, which differs from ours by just under 2σ (quadratically combined error), and is thus in statistically marginal agreement with our value.
Iron abundances have been studied far more extensively in the Hyades than in any other cluster. Table 11 shows a compilation of modern high-resolution spectroscopic studies of [Fe/H] in Hyades dwarfs. Although these span nearly 30 years, use a variety of telescope/spectrograph/detector combinations, and employ varying analysis techniques (for example, different Teff scales, which can affect the derived [Fe/H]), the full range of published [Fe/H] just barely exceeds 0.05 dex, with the exception of one study (Schuler et al 2006a; but note that their [Fe/H] for Hyades giants is 0.16 ± 0.02). Such concordance is remarkable, and is nearly certainly unique in the open cluster literature. Our own value for [Fe/H] agrees well with those others listed in Table 11.
Table 11. High-resolution Spectroscopic Studies of [Fe/H] for the Hyades
| Study | Instrument(s) | [Fe/H] | σμ |
|---|---|---|---|
| Cayrel et al. (1985) | 1 | 0.145a | 0.03 |
| Boesgaard & Budge (1988) | 1,2,3 | 0.168 | 0.064 |
| Boesgaard (1989) | 1,2 | 0.130 | 0.026 |
| Boesgaard & Friel (1990) | 1,2 | 0.127 | 0.022 |
| Boesgaard et al. (2002) | 4 | 0.16 | 0.04 |
| Paulson et al. (2003) | 4 | 0.13 | 0.01 |
| Yong et al. (2004) | 4 | 0.16 | 0.02 |
| Boesgaard (2005) | 4 | 0.18 | 0.01 |
| Schuler et al. (2006a) | 5,6 | 0.08 | 0.01 |
| Present | 7 | 0.131 | 0.009 |
| J. D. Cummings et al. (2014, in preparation) | 7 | 0.135 | 0.005 |
Notes. 1, CFHT/coudé/photodiodes; 2, Hale/coudé/ccd; 3, University of Hawaii 2.2 m/coudé/ccd; 4, Keck 1/HIRES/ccd; 5, VLT-UT2/UVES/ccd; 6, MacDonald 2.7m/2dcoudé/ccd; 7, WIYN/Hydra/ccd. aThis is their value from "ionized iron," which "may be preferred."
Download table as: ASCIITypeset image
Few previous abundance studies of NGC 752 exist. King (1993) reports the only previous O abundance for NGC 752, [O/H] = −0.13 ± 0.12, in good agreement with our own. Anthony-Twarog & Twarog (2006) find [Fe/H] = −0.06 ± 0.09 using uvbyCa photometry, and Anthony-Twarog et al. (2009) report [Fe/H] = −0.08 ± 0.11 from a combination of uvbyHβ photometry and moderate-dispersion spectroscopy of the giants (where the spectroscopy alone yields [Fe/H] = −0.05). Anthony-Twarog et al. (2009) suggest these supersede the Daniel et al. (1994) value of [Fe/H] = −0.15. Hobbs & Thorburn (1992) and King (1993) both find [Fe/H] = −0.09 (± 0.05, ± 0.07, respectively) spectroscopically, from high-resolution data in eight turnoff stars, and moderate-resolution data in nine dwarfs, respectively. Sestito et al. (2004) report [Fe/H] = 0.01 ± 0.04 from high-dispersion spectra of seven dwarfs, and dismiss the sub-solar values. Given the excellent agreement of most of the previous values and the sub-solar value we have presented here, the Sestito et al. (2004) value would instead seem to be the discrepant one; however, all the values summarized here are acceptably consistent within the errors, and the overall scatter is only 0.1 dex.
Figure 6 shows [O/H] versus age for our present results along with the King (1993) sample and additional OC dwarf triplet abundances from the literature (Schuler et al. 2004; Ford et al. 2005; King & Schuler 2005; Schuler et al. 2006b; Shen et al. 2007; see Section 1 for details). In Figure 6, we have recalculated the average [O/H] for the "Triplet Literature" values (green triangles) to include only prime Teff range stars, and the error bars represent the corresponding σμ; the error bars on our present values represent σμ plus the systematic error due to a reddening error of +0.005 (reported in Table 8); and the error bars on the King (1993) values are as reported by him. Our [O/H] scale would appear to be similar to that of King (1993), as evidenced by the fact that the average difference in our cluster [O/H] for the Hyades and for NGC 752 is only 0.02 ± 0.07 dex. Perhaps this is not altogether surprising since King (1993) used a near-identical reddening for NGC 752 as we have, namely E(B − V) = 0.04 (he also assumes zero reddening for the Hyades). Our results thus also may support the apparent [O/H] versus age relationship found by King (1993), although only weakly so, given that we report on just two clusters. Some of the literature values for the younger clusters also support the high [O/H] found by King (1993), but there may be some scatter as well, which is difficult to evaluate given the inhomogeneous nature of the available literature data. In future papers we will provide self-consistent data sets for additional clusters which will shed light on these issues.
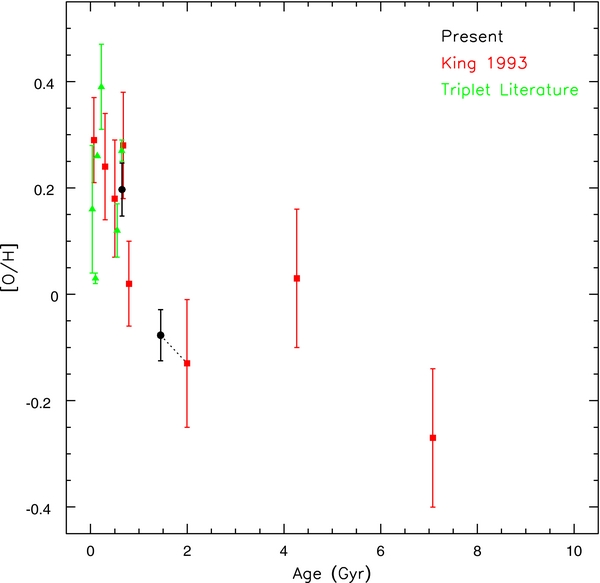
Figure 6. Average [O/H] vs. age for our present results (black circles), King (1993; red squares), and compiled triplet results from the literature (green triangles; see the text for details). The dotted line connects our result for NGC 752 with that of K93.
Download figure:
Standard image High-resolution image4.2. Cool Dwarf Overabundance Trend
Our NGC 752 sample exhibits a prominent triplet [O/H] overabundance trend for Teff < 5500 K (see Figure 5), whose origin we may attempt to investigate. This trend may be analogous to those found by Schuler et al. (2004), King & Schuler (2005), and Schuler et al. (2006b) for the Pleiades, UMa moving group, and the Hyades, respectively. Furthermore, our sample has the largest Teff range for OC triplet abundances to date (although the Schuler et al. 2006b Hyades sample had better sampling density), and so provides a unique means with which to investigate the overabundance trend. Of note is the extraordinarily high [O/H] of the coolest star in our sample, star 748 at 4209 K. This abundance, [O/H] = 2.85 ± 0.02, is suspicious because (1) the implied oxygen abundance is 700 times solar and thus unphysical to an extent which calls into question the suitability of the analysis, and (2) we detect all three triplet lines in star 748, whereas we detect only the 7771 Å line, i.e., the strongest line, in all other stars cooler than 5550 K. Note that this star is a kinematic member and has an [Fe/H] abundance which, while low, is not discrepant with respect to the cluster. Given the paucity of data between this star and the next hottest one, which is fully 400 K hotter, and thus given the absence of information about the shape of the trend in this temperature range, it is difficult to know whether this star is actually peculiar or whether the trend simply goes right through it. Having noted this uncertainty, we will confine attention to the NGC 752 overabundance trend as defined by stars between 5500 and 4500 K, to be conservative.
Schuler et al. (2006b) compared the overabundance trend exhibited by their Hyades dwarfs to that seen in the Pleiades (Schuler et al. 2004) and in the UMa moving group (King & Schuler 2005), and found that the UMa trend appeared very similar to that of the Hyades, while the Pleiades trend was clearly much steeper (see their Figure 6). Schuler et al. (2006b) concluded that this indicated an age rather than metallicity effect, given that the UMa moving group may be of similar age to the Hyades (600 Myr; King & Schuler 2005) but more than 0.2 dex lower in [Fe/H] (−0.09; Boesgaard & Friel 1990), while the Pleiades is a factor of ∼5 younger than the Hyades and of solar metallicity (King 2000). NGC 752, which is a factor of ∼2 older than the Hyades, is an ideal cluster with which to test the suggested age correlation. We did not measure [O/H] for Hyades dwarfs with Teff ≲ 5400 K, so we compare our NGC 752 results to the Schuler et al. (2006b) Hyades results, as plotted in Figure 7; we note that in Figure 7 we have shifted both data sets so that the average [O/H] of the "prime" members is zero. The NGC 752 dwarfs that have Teff between 5500 and 4500 K lie above the Hyades dwarfs of similar Teff, and the NGC 752 trend is either simply offset relative to that of the Hyades, or alternatively may have an even steeper slope. Regardless, the NGC 752 overabundance trend lies above that of the Hyades, and thus, does not appear to support the age correlation proposed by Schuler et al. (2006b).
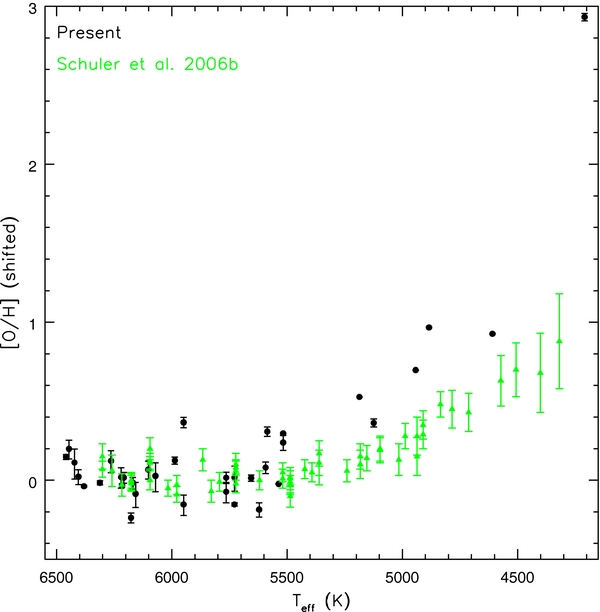
Figure 7. [O/H] vs. Teff for our present NGC 752 results (black circles) and the Hyades results of Schuler et al. (2006b; green triangles). In both cases, the abundances have been shifted so that the average cluster abundance, based on stars in the 5500–6100 K range, is zero.
Download figure:
Standard image High-resolution imageOne might wonder whether the NGC 752 overabundances correlate with other parameters, such as rotation or rotation-related (and perhaps rotation-driven) effects. Rotation is an interesting parameter because, as is well-known, G and K dwarfs spin down during main-sequence evolution (Skumanich 1972; Kawaler 1988; Cardini & Casatella 2007; Reiner & Mohanty 2012), and in particular, Pleiads rotate faster than Hyads do (e.g., Meibom et al. 2009), so perhaps the Schuler et al. (2006b) decrease of the oxygen overabundances from the Pleiades to the Hyades has something to do with rotation. While considerable effort has been put forth to study rotation in the Hyades (e.g., Delorme et al. 2011, and references therein), unfortunately there is almost no such information about NGC 752. From our spectra, we can place conservative upper limits in vsin i of 15 km s−1, based upon our instrumental resolution limit, for all stars in our NGC 752 sample that have Teff < 6200 K. In comparison, this upper limit is well above the equatorial rotation rates of about 3.5 km s−1 for Hyads near 5000 K (converted from the Delorme et al. 2011 periods). Thus, while the expectation is that NGC 752 dwarfs should rotate more slowly than Hyads of comparable temperature, which is entirely consistent with our limit of 15 km s−1, the data also allow for them to rotate up to about 3–5 times faster than the Hyades. Thus, we cannot directly evaluate whether the higher cool dwarf O overabundances in NGC 752 are correlated with rotation. If the NGC 752 cool dwarfs do rotate faster than the Hyads, there would also be implications for stellar spin-down.
We can nevertheless proceed to test whether the triplet overabundance trend is related to certain rotation-related phenomena, such as X-ray activity (stellar coronal activity is driven by rotation; e.g., Giardino et al. 2008, and references therein). As noted in the Introduction, the work of Shen et al. (2007) appears to support a correlation between [O/H] abundances and X-ray activity for the case of IC 4665, albeit based on only three stars. To test for such a correlation with our current [O/H] results, we first turn to the most comprehensive and most recently published study of X-ray activity in the Hyades, that of Stern et al. (1995), who used ROSAT data. This study provides X-ray data for 20 of the 22 Hyads for which we report [O/H]. Figure 8 shows [O/H] versus X-ray luminosity for these Hyads, where the X-ray luminosity has been normalized by the bolometric luminosity, as taken from the Y2 isochrones, for each star; also included in this plot are the two stars from Schuler et al. (2006b) for which Giardino et al. (2008) report values. Unfortunately, this combined sample contains only one star with Teff < 5400 K, which is insufficient to investigate the low-Teff overabundance trend. The available data can be interpreted as exhibiting somewhat increased scatter in [O/H] for X-ray luminosity ratios ≳ 3 × 10⁻⁵, and indeed, the standard deviation of [O/H] for stars above this limit is approximately twice that of stars below it. However, the difference in the means of the two groups is 0.045 ± 0.033 (the error is the combined σμ), which is of questionable statistical significance; furthermore, a linear least-squares fit to the entire sample yields a slope which is consistent with zero. Without even taking into account the substantial errors on the individual data points, we can conclude that there is no significant trend of [O/H] versus X-ray luminosity.
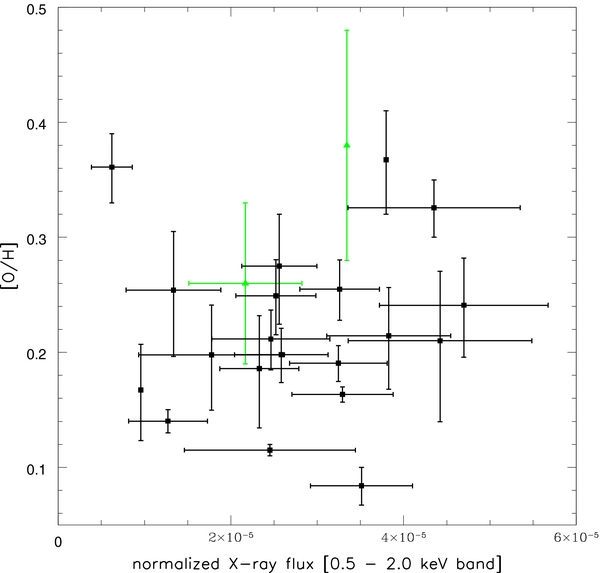
Figure 8. Our Hyades [O/H] vs. normalized X-ray luminosity from Stern et al. (1995). The green triangles indicate [O/H] for two additional Hyads from Schuler et al. (2006b).
Download figure:
Standard image High-resolution imageIn the case of NGC 752, there have been two studies of X-ray emission, Belloni & Verbunt (1996), who used ROSAT data, and Giardino et al. (2008), who used both Chandra and XMM-Newton data. Giardino et al. (2008) provide data for four of our NGC 752 stars: 701, 859, and 953 from Chandra data, and 783 from XMM-Newton data; unfortunately, these stars cover a rather limited Teff range of 5650–6000 K. Figure 9 shows [O/H] versus X-ray counts (in the 0.5–2.0 keV band) normalized by bolometric luminosity (as done for the Hyades) for these four stars. Three of these stars show no correlation between [O/H] and X-ray luminosity. The fourth is star 783, which has both a higher [O/H] than other prime range members and an unusually high X-ray luminosity. Giardino et al. (2008) note that this star is not identified as binary or rapid rotator, either of which could increase X-ray luminosity (and recall that our own conservative upper limit on vsin i is 15 km s−1 for the NGC 752 stars in our sample). They also note that the ROSAT X-ray luminosity reported for 783 in Belloni & Verbunt (1996) is three times higher than reported by Giardino et al. (2008), indicating it may have been flaring during the ROSAT observation, which implies this star is an X-ray variable. Due to the paucity of stars in our sample for which X-ray data are available, we cannot evaluate how this star might reflect any underlying scatter in [O/H] versus X-ray luminosity. In short, the available X-ray data for our two clusters do not provide any evidence for a correlation between [O/H] and X-ray activity.

Figure 9. Our NGC 752 [O/H] vs. normalized X-ray counts from Giardino et al. (2008).
Download figure:
Standard image High-resolution image
Another possibility is that triplet [O/H] abundances might be affected by chromospheric activity. As noted in the Introduction, Schuler et al. (2004) found no strong correlation between triplet [O/H] and Hα emission or Ca ii emission; however, their abundance and activity data were not contemporaneous. Since activity levels can change over time, possible correlations between abundances and activity levels might have been missed. To eliminate such potentially confusing effects of changing activity, R. M. Maderak et al. (2014, in preparation) obtained and studied contemporaneous spectra of the O i triplet, the Ca ii infrared triplet (8498 Å, 8542 Å, 8662 Å), and Hα spectral regions in 45 Pleiades dwarfs that are known to have a variety of chromospheric activity levels and rotation rates. R. M. Maderak et al. (2014, in preparation) found a strong anti-correlation between total Ca ii triplet emission and Teff, as expected if Ca ii triplet emission is correlated with Ca ii HK activity (e.g., Pace & Pasquini 2004, and references therein). In addition, the Pleiads with vsin i ≳ 30 km s−1 have Ca ii emission that is elevated by an additional ∼50% above the underlying trend with Teff. This suggests that Ca ii emission has both a chromospheric and rotational component, as discussed by Shen et al. (2007). R. M. Maderak et al. (2014, in preparation) find a clear correlation between elevated triplet [O/H] and increased Ca ii triplet emission. Interestingly, the cool Pleiads (Teff < 5400 K) that have both the largest Ca ii emission and largest [O/H] overabundances appear not to be rotating rapidly; rather, they have vsin i < 30 km s−1. This suggests that chromospheric activity, rather than rotation, is responsible for the triplet [O/H] overabundance trend in cool dwarfs, at least in the Pleiades. But if this were also to be true for the Hyades and NGC 752, a new mystery would be manifested, namely why would the cool dwarfs in the older NGC 752 have higher activity levels than in the cool Hyads?
Of importance is the R. M. Maderak et al. (2014, in preparation) finding that [O/H] is flat versus total Ca ii emission for the prime-Teff Pleiads with vsin i ≲ 30 km s−1. This suggests that the triplet [O/H] abundances of slowly rotating prime-temperature dwarfs are not affected by chromospheric activity, even though activity likely causes the cool dwarf overabundance trend, and therefore, slowly rotating prime-temperature dwarfs, like those used in the present work to define our cluster averages, yield reliable triplet abundances.
Finally, we note the difference in metallicity between the Hyades and NGC 752 of 0.194 ± 0.017 and speculate as to whether this might be related to the O overabundance differences in the cool dwarfs of the two clusters. A promising possibility is the effect of UV photons causing overphotoexcitation which enhances the strengths of the O i lines and higher excitation potential Fe i lines. Such a mechanism might also lead to overphotoionization enhancing strengths of Fe ii lines; anomalously high Fe abundances derived from Fe ii lines are indeed observed in cool Hyades dwarfs (Schuler et al. 2009). The key feature of this model would be that the lower-metallicity photospheres present smaller opacity to the UV photons (whatever their source). Such a mechanism has been inferred to be operating in cool pre-main-sequence stars on the basis of comparisons of Li i based abundances derived from the λ6708 Li resonance lines and the subordinate λ6104 feature (Bubar et al. 2011).
5. SUMMARY AND CONCLUSIONS
We have derived O and Fe abundances for 22 dwarfs in the Hyades and 36 dwarfs in NGC 752 using high-dispersion, 7774 Å O i triplet region WIYN/Hydra spectra, using an analysis that is differential with respect to the Sun. Triplet LTE abundances in the near-solar "prime" Teff range are found to be independent of Teff ("flat"), as also demonstrated by previous work (e.g., Schuler et al. 2006b). In our cluster averages, which are calculated in linear (not log) space, we have avoided using hotter stars (Teff > 6200 K), whose O abundances may be affected by NLTE, and cooler stars (Teff < 5500 K), whose abundances show an increasing trend with lower Teff. Our principal conclusions may be summarized as follows.
- 1.For the Hyades, we find a cluster mean radial velocity 39.4 ± 0.6 km s−1 based on stars which meet our criteria for single star membership, in excellent agreement with the average of the Perryman et al. (1998) values for the same set of stars. Our radial velocity analysis of NGC 752 identifies 38 single star members, largely identical to the membership assignments of Daniel et al. (1994).
- 2.Our Hyads span an insufficient range in Teff to identify clearly the limits of the "flat" O abundance range, so we adopt the range 5400–6100 K, based on Schuler et al. (2006b), in which our O abundances are also "flat." This yields a cluster average [O/H] = 0.195 ± 0.010, in good agreement with most, but not all, previous studies. The range 5600–6200 K is selected for our NGC 752, giving an average [O/H] = −0.077 ± 0.02, in perfect agreement with the one previous determination (King 1993). Based on these values, our [O/H] abundance scale is found to differ by only −0.02 dex from that of King (1993), lending support to his conclusions.
- 3.High-excitation Fe lines in both clusters exhibit rising abundances for Teff ≲ 5500, analogous to the triplet [O/H] overabundance trend (see item 4, below), and are possibly also due to over-excitation (Schuler et al. 2006a). Fe lines with EP > 4.5 eV are omitted from the averages for stars in this Teff range. The resulting cluster averages are [Fe/H] = 0.130 ± 0.009 and [Fe/H] = −0.059 ± 0.013 for the Hyades and NGC 752, respectively.
- 4.The cool dwarfs (Teff ≲ 5500) of our NGC 752 sample exhibit O overabundances (relative to the prime-Teff O plateau) that lie above the corresponding overabundances of the Hyades, and that have a similar [O/H]–Teff slope, or possibly even a steeper slope, than the corresponding trend for the Hyades from Schuler et al. (2006b). Since NGC 752 is twice as old as the Hyades, this contradicts Schuler et al.'s (2006b) suggestion that the O overabundances decrease with age. We have checked for other possible correlations. We cannot check rotation itself, as our upper limits in vsin i of 15 km s−1 in NGC 752 cannot distinguish between the three cases that NGC 752 dwarfs rotate slower than, about the same as, or (perhaps contrary to expectations) faster than the Hyades dwarfs. We find no correlation between O overabundance and published X-ray luminosities. We note R. M. Maderak et al.'s (2014, in preparation) finding that [O/H] overabundances in cool Pleiades dwarfs (aged ∼100–150 Myr) do correlate with Ca ii emission, but not with vsin i. It would be surprising if high activity in NGC 752 were to explain the higher O overabundances in NGC 752 relative to the Hyades, since activity is expected to decline with age. R. M. Maderak et al. (2014, in preparation) also corroborates that slowly rotating prime-temperature dwarfs yield reliable triplet [O/H] values. Finally, we note the difference in metallicity between NGC 752 and the Hyades, and propose a model where this difference may result in the observed O-overabundance patterns, due to smaller opacity in lower-metallicity photospheres.
Our future works will expand the age and [Fe/H] range of our sample, allowing further examination of the issues raised here.
R.M.M. acknowledges the Indiana Space Grant Consortium for support through a Graduate Fellowship. C.P.D. and J.R.K. acknowledge support from the National Science Foundation under grants AST-1009672 and AST-0908342, respectively.
Footnotes
- 6
The WIYN Observatory is a joint facility of the University of Wisconsin-Madison, Indiana University, Yale University, and the National Optical Astronomy Observatory.
- 7
IRAF is distributed by the National Optical Astronomy Observatories, which are operated by the Association of Universities for Research in Astronomy, Inc., under cooperative agreement with the National Science Foundation.