


ABSTRACT
Open clusters are very useful examples to explain the constraint of the nucleosynthesis process with the luminosities of stars because the distances of the clusters are better known than those of field stars. We carried out a detailed spectroscopic analysis to derive the chemical composition of two red giants in the young open cluster NGC 5822, NGC 5822-2, and NGC 5822-201. We obtained abundances of C, N, O, Na, Mg, Al, Ca, Si, Ti, Ni, Cr, Y, Zr, La, Ce, and Nd. The atmospheric parameters of the studied stars and their chemical abundances were determined using high-resolution optical spectroscopy. We employed the local thermodynamic equilibrium model atmospheres of Kurucz and the spectral analysis code moog. The abundances of the light elements were derived using the spectral synthesis technique. We found that NGC 5822-2 and -201 have, respectively, a mean overabundance of the elements created by the s-process, "s," with the notation [s/Fe] of 0.77 ± 0.12 and 0.83 ± 0.05. These values are higher than those for field giants of similar metallicity. We also found that NGC 5822-2 and -201 have, respectively, luminosities of 140 L☉ and 76 L☉, which are much lower than the luminosity of an asymptotic giant branch star. We conclude that NGC 5822-2 and NGC 5822-201 are two new barium stars first identified in the open cluster NGC 5822. The mass transfer hypothesis is the best scenario to explain the observed overabundances.
Export citation and abstract BibTeX RIS
1. INTRODUCTION
In addition to field stars, H ii regions, cepheid variables, and OB stars, open clusters are very useful in probing the chemical evolution of the galaxy. Besides, since we also know their distances, the luminosities of the stars in the cluster are better constrained than the field stars. This is an important stellar parameter because it is often used to constrain stellar evolution models as well as nucleosynthesis processes and dredge-up episodes (Boothroyd & Sackmann 1988; Lattanzio & Wood 2004). Therefore, any chemical enrichment or depletion observed in the spectra of cluster giants may be compared with the predictions of evolutionary models. One important chemical enrichment that is frequently observed in the atmospheres of evolved stars is the overabundance of elements created by slow neutron capture reactions. This process was called s-process by Burbidge et al. (1957). Elements heavier than the iron peak (Z > 30), such as barium and strontium, are synthesized in this way, provided that the rate of neutron capture is slow compared to the beta-decay timescale of the radioactive nuclei involved in the chain. The main site for this process is inside a star during its evolution through the asymptotic giant branch (AGB) phase, when the star develops helium-burning thermal pulses (TP-AGB phase). A by-product of the thermal pulse is the production of both carbon and neutron-rich isotopes of heavy elements. Theoretical calculations show that in order for the first thermal pulse to develop, a star should present a luminosity of ≃1400 L☉ (Vassiliadis & Wood 1993). During the TP-AGB phase, material from the He intershell, enriched by carbon and the s-process elements, is brought to the star's surface due to the deep convection zone of the AGB star ("third dredge-up"). Therefore, the study of s-process elements in the atmospheres of these stars is very useful for setting constraints on the models of neutron capture nucleosynthesis during the AGB. Unfortunately, the atmosphere of the AGB stars is crowded due to a strong molecular opacity that makes the study of the chemical abundances using atomic lines very difficult.
Barium stars are another example of objects that also display element enrichment by the s-process. However, barium stars are not luminous enough, and their effective temperatures are too high to be considered AGB stars that underwent a third dredge-up. Therefore, their overabundances of carbon and s-process elements are explained by mass transfer in a binary system from a former AGB star (now a white dwarf in the system). Because they are too warm relative to the AGB stars, and have spectral types G and K, barium stars are free from the strong molecular opacity from ZrO, CN, and C2 absorption features. This makes barium stars ideal to better probe the enrichment of s-process nucleosynthesis in the atmospheres of these stars. Several works have already been published about the chemical composition of field barium stars, such as Allen & Barbuy (2006), Smiljanic et al. (2009), and Pereira et al. (2011) to name a few. Since the work of McClure et al. (1974) for the old open cluster NGC 2420 and the subsequent confirmation using high-resolution spectroscopy by Smith & Suntzeff (1987), there was no detection of barium stars in an open cluster. In this work, we report the discovery of two barium stars in the open cluster NGC 5822, NGC 5822-2, and NGC 5822-201. We will show that NGC 5822-2 and NGC 5822-201 have overabundances of s-process elements greater than those of the field giant stars of similar metallicity. We will also show that the observed overabundance is similar to the barium stars reported in the literature as well as to the star HD 65314, a barium star used as an s-process-enriched template star.
The open cluster NGC 5822 was selected to be observed with high-resolution spectroscopy because we have started a project to obtain the atmospheric parameters and chemical abundances of a sample of red giant stars in several open clusters. This project benefited from the radial-velocity survey done by Mermilliod et al. (2008), where several red giant stars were identified as members of the star clusters surveyed by these authors. For the open cluster NGC 5822, we have observed 15 giant stars, all of which, according to Mermilliod et al. (2008), are members of this cluster, including these two barium giants. Some giant stars of NGC 5822 have already been investigated by several authors through high-resolution spectroscopy—Luck (1994), Santos et al. (2009), Smiljanic et al. (2009), and Pace et al. (2010)—but there has not yet been a study dedicated to analyzing a large sample of giant stars in this cluster.
The confirmation of barium stars in open clusters is important in order to check whether the heavy-element enrichment is due to an intrinsic nuclear process or due to an extrinsic process, i.e., the mass transfer hypothesis, since the luminosities of the stars in clusters are better constrained by their known distances. NGC 5822-2 and -201 have already been recognized as spectroscopic binaries (Mermilliod et al. 1989; Mermilliod & Mayor 1990); therefore, the detection of barium stars may raise other constraints, such as, for example, the theoretical birthrate of these kind of stars in open clusters compared to field stars as well as for the mixing and dredge-up process and nucleosynthesis on AGB stars. Since they host white dwarfs, barium stars are binary stars whose companions are white dwarfs and (Böhm-Vitense et al. 2000; Gray et al. 2011) can be another important source, other than imaging, for counting and identification of white dwarfs in open clusters (Dobbie et al. 2012). This is important to constrain the ages of the open clusters and can be compared with cluster turnoff ages (von Hippel et al. 1995).
2. OBSERVATIONS
The high-resolution spectra for these two stars were obtained at the 2.2 m ESO telescope of La Silla, Chile using the echelle spectrograph Fiberfed Extended Range Optical Spectrograph (FEROS; Kaufer et al. 1999). The FEROS spectral resolving power is R = 48,000, corresponding to 2.2 pixels of 15 μm, and has a complete wavelength coverage without gaps from 3800 Å to 9200 Å. The stars were selected from the radial velocity survey of Mermilliod et al. (2008). The nominal signal to noise ratio (S/N) was evaluated by measuring the rms flux fluctuation in selected continuum windows, and in both stars the typical values are around 100. The spectra were reduced with the MIDAS pipeline reduction package consisting of the following standard steps: CCD bias correction, flat fielding, spectrum extraction, wavelength calibration, correction of barycentric velocity, and spectrum rectification. Table 1 gives the log of the observations and other information of the observed stars. In Figure 1, we show the color–magnitude diagram of NGC 5822 using the UBV photometry of Twarog et al. (1993) for the red giants in NGC 5822, including the barium giants NGC 5822-2 and -201. The green points represent the binary stars marked by Mermilliod & Mayor (1990). The frequency of known binary stars in open clusters is important to constrain, through N-body simulations, the dynamical evolution of the clusters and for comparison with the predicted frequency of blue stragglers (Hurley et al. 2005).

Figure 1. Color–magnitude diagram of the red giants in NGC 5822. Green squares represent the binary stars. The barium stars (red circles) NGC 5822-2 and -201 are also shown. The UBV photometry was obtained from Twarog et al. (1993).
Download figure:
Standard image High-resolution imageTable 1. Log of the Observations and Other Relevant Information for the Target Stars
| ID | CPD | V | B − V | RVa | RVb | Date Obs. | Exp. |
|---|---|---|---|---|---|---|---|
| (km s−1) | (km s−1) | (s) | |||||
| 2 | −53°6222 | 9.55 | 1.06 | −29.20 | −25.07 ± 0.50 | 2009 Mar 7 | 900 |
| 201 | −53°6224 | 10.24 | 1.07 | −27.90 | −27.80 ± 0.23 | 2009 Mar 8 | 1200 |
Notes. ID, CPD number, V, B − V, and radial velocities were taken from Mermilliod et al. (2008) (Columns 1–5). Our values for the radial velocities are given in Column 6. The last two columns provide the dates of observation and exposure times. aMermilliod et al. (2008). bThis work.
Download table as: ASCIITypeset image
Figures 2, 3, and 4 show the spectra of NGC 5822-2 and -201 for some selected regions where the transitions due to the elements synthesized by the s-process are observed. For comparison, these figures also show the spectrum of a barium star, HD 65314, and the spectrum of a non-s-process-enriched giant star HD 2114. As we shall see, HD 65314 and HD 2114 have atmospheric parameters similar to those of the two cluster giants. So, the line strengths of these elements are related to the overabundances of these elements in the atmosphere of HD 65314, and, in the case of HD 2114, as a result of normal solar abundance.
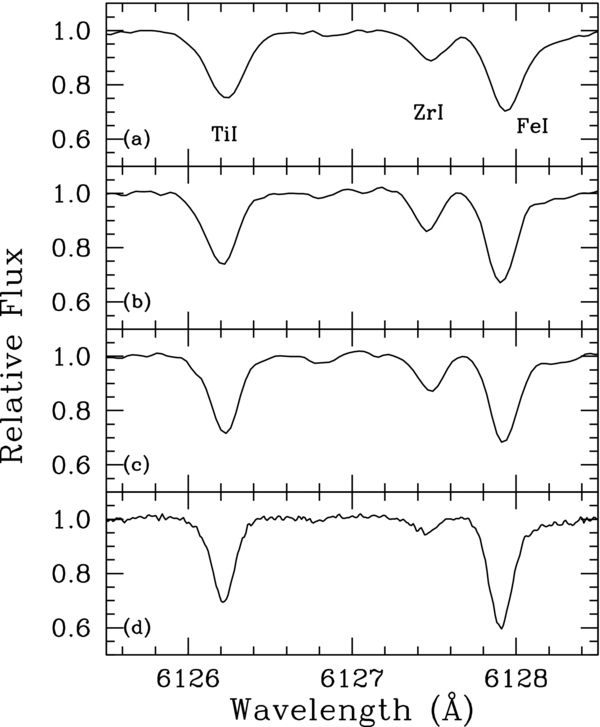
Figure 2. Normalized spectra of the open cluster giants NGC 5822-2 (a) and NGC 5822-201 (b), the barium star HD 65314 (c), and the giant star HD 2114 (d) in the region of the absorption line of Zr i 6127.46 Å.
Download figure:
Standard image High-resolution image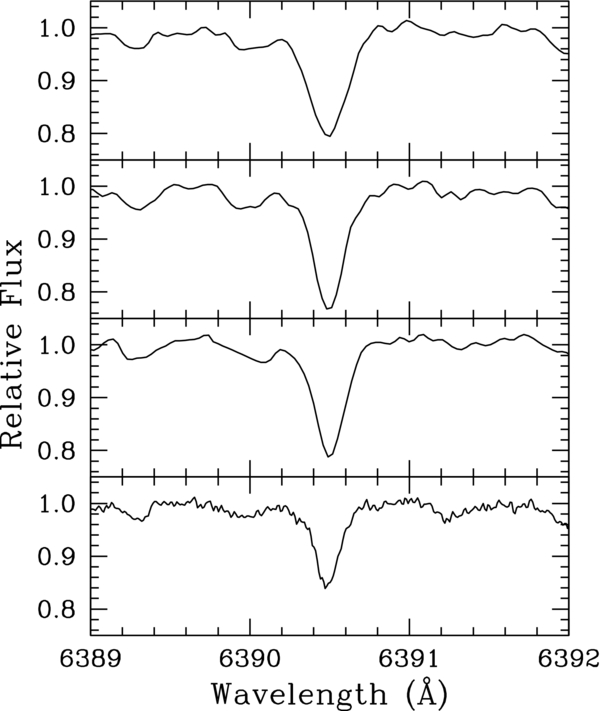
Figure 3. Same as in Figure 2, but for the region of the absorption line of La ii 6390.48 Å.
Download figure:
Standard image High-resolution image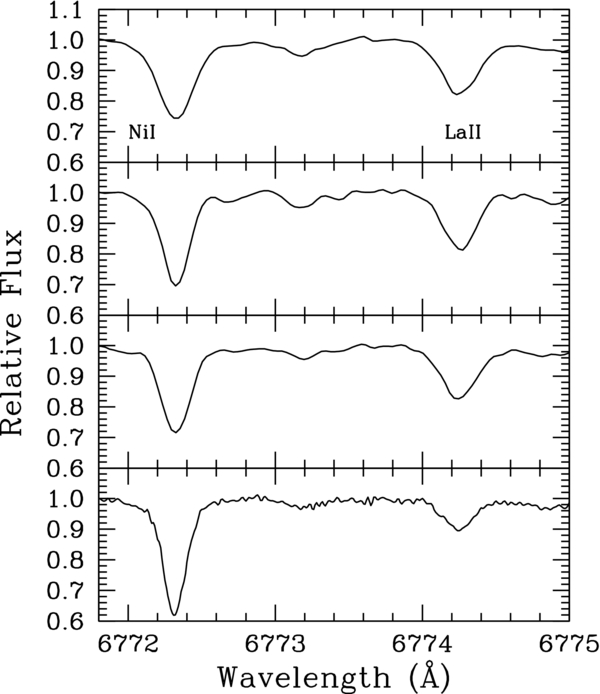
Figure 4. Same as in Figure 2, but for the region of the absorption line of La ii 6774.33 Å.
Download figure:
Standard image High-resolution image3. ANALYSIS AND RESULTS
3.1. Line Selection, Measurement, and Oscillator Strengths
The stellar spectra of the stars analyzed in this work show many atomic absorption lines of Fe i and Fe ii as well as transitions due to Na i, Mg i, Al i, Si i, Ca i, Ti i, Cr i, Ni i, Y ii, Zr i, La ii, Ce ii, and Nd ii. We have chosen a set of lines sufficiently unblended to yield reliable abundances. Equivalent widths were measured using the task splot from IRAF. The selected lines are listed in Table 2 for the case of Fe i and Fe ii lines and in Table 3 for the other elements. Tables 2 and 3 also provide the lower excitation potential, χ (eV), of the transitions and the gf values. The gf values for the Fe i and Fe ii lines were taken from Lambert et al. (1996) and Castro et al. (1997), and for the other elements the sources of the gf values are given in Table 3.
Table 2. Observed Fe i and Fe ii Lines
| Element | λ | χ | log gf | EQW2 | EQW201 | EQW65314 |
|---|---|---|---|---|---|---|
| (Å) | (eV) | (mÅ) | (mÅ) | (mÅ) | ||
| Fe i | 5159.06 | 4.28 | −0.650 | 90 | 100 | ... |
| 5162.27 | 4.18 | +0.079 | 130 | ... | ... | |
| 5198.71 | 2.22 | −2.140 | ... | 133 | 135 | |
| 5242.49 | 3.63 | −0.970 | 114 | 109 | 110 | |
| 5250.21 | 0.12 | −4.920 | 125 | 113 | 122 | |
| 5253.03 | 2.28 | −3.790 | 52 | 44 | ... | |
| 5288.52 | 3.69 | −1.510 | 92 | 81 | 81 | |
| 5307.36 | 1.61 | −2.970 | ... | 132 | 131 | |
| 5315.05 | 4.37 | −1.400 | 65 | 49 | ... | |
| 5321.11 | 4.43 | −1.190 | 67 | 64 | 61 | |
| 5322.04 | 2.28 | −2.840 | 106 | 92 | 90 | |
| 5364.87 | 4.45 | +0.230 | ... | 134 | 128 | |
| 5367.47 | 4.42 | +0.439 | ... | ... | 135 | |
| 5373.70 | 4.47 | −0.710 | 85 | 80 | 77 | |
| 5389.47 | 4.42 | −0.250 | 107 | ... | 99 | |
| 5410.91 | 4.47 | +0.400 | ... | 133 | ... | |
| 5417.03 | 4.42 | −1.530 | 57 | ... | 49 | |
| 5441.33 | 4.31 | −1.580 | 59 | 59 | 53 | |
| 5445.04 | 4.39 | +0.040 | ... | 128 | 120 | |
| 5522.44 | 4.21 | −1.400 | 68 | 63 | 58 | |
| 5532.74 | 3.57 | −2.000 | 79 | 68 | ... | |
| 5560.21 | 4.43 | −1.040 | 75 | 71 | 65 | |
| 5576.09 | 3.43 | −0.850 | ... | ... | 125 | |
| 5624.02 | 4.39 | −1.330 | ... | ... | 69 | |
| 5633.94 | 4.99 | −0.120 | 85 | ... | 81 | |
| 5635.82 | 4.26 | −1.740 | 46 | 44 | 43 | |
| 5638.26 | 4.22 | −0.720 | 98 | 94 | 97 | |
| 5686.53 | 4.55 | −0.450 | ... | 93 | ... | |
| 5691.50 | 4.30 | −1.370 | 72 | 70 | 63 | |
| 5705.46 | 4.30 | −1.360 | ... | 57 | 58 | |
| 5717.83 | 4.28 | −0.979 | ... | 86 | 85 | |
| 5731.76 | 4.26 | −1.150 | 77 | 78 | 78 | |
| 5806.73 | 4.61 | −0.900 | 73 | 72 | 68 | |
| 5814.81 | 4.28 | −1.820 | 38 | 35 | 38 | |
| 5852.22 | 4.55 | −1.180 | 65 | 54 | 58 | |
| 5883.81 | 3.96 | −1.210 | 89 | 81 | 91 | |
| 5916.24 | 2.45 | −2.990 | ... | 91 | 89 | |
| 5934.65 | 3.93 | −1.020 | 106 | 100 | 98 | |
| 6024.06 | 4.55 | −0.060 | 127 | 114 | 116 | |
| 6027.05 | 4.08 | −1.090 | 93 | 83 | 79 | |
| 6056.01 | 4.73 | −0.400 | ... | 82 | 83 | |
| 6079.00 | 4.65 | −0.970 | 65 | 61 | 62 | |
| 6082.71 | 2.22 | −3.580 | 72 | 66 | 72 | |
| 6093.64 | 4.61 | −1.350 | 44 | 44 | 42 | |
| 6096.66 | 3.98 | −1.780 | 53 | 53 | 53 | |
| 6120.24 | 0.91 | −5.950 | 26 | ... | 29 | |
| 6151.62 | 2.18 | −3.290 | 92 | 84 | 84 | |
| 6165.36 | 4.14 | −1.470 | 68 | 60 | 62 | |
| 6173.34 | 2.22 | −2.880 | 116 | 108 | 101 | |
| 6187.99 | 3.94 | −1.570 | 73 | 73 | 67 | |
| 6200.32 | 2.60 | −2.440 | 111 | 103 | 106 | |
| 6213.43 | 2.22 | −2.480 | 131 | 122 | 115 | |
| 6265.13 | 2.18 | −2.550 | ... | 132 | 129 | |
| 6311.50 | 2.83 | −3.230 | ... | 49 | 55 | |
| 6322.69 | 2.59 | −2.430 | 118 | 109 | 107 | |
| 6380.74 | 4.19 | −1.320 | ... | ... | 83 | |
| 6392.53 | 2.28 | −4.030 | 41 | 36 | 46 | |
| 6411.65 | 3.65 | −0.660 | ... | ... | 137 | |
| 6419.95 | 4.73 | −0.090 | 104 | 103 | 106 | |
| 6436.40 | 4.19 | −2.460 | ... | 25 | ... | |
| 6551.67 | 0.99 | −5.790 | 27 | 27 | ... | |
| 6574.22 | 0.99 | −5.020 | 83 | 70 | 73 | |
| 6593.87 | 2.44 | −2.420 | ... | ... | 120 | |
| 6597.56 | 4.79 | −0.920 | 58 | 58 | 55 | |
| 6608.02 | 2.28 | −4.030 | 45 | 46 | 45 | |
| 6609.11 | 2.56 | −2.690 | 112 | ... | 104 | |
| 6646.93 | 2.61 | −3.990 | 26 | 31 | ... | |
| 6699.14 | 4.59 | −2.190 | ... | ... | 20 | |
| 6703.56 | 2.76 | −3.160 | 78 | 72 | 70 | |
| 6704.48 | 4.22 | −2.660 | ... | ... | 15 | |
| 6713.74 | 4.79 | −1.600 | 30 | 29 | 40 | |
| 6739.52 | 1.56 | −4.950 | 39 | 29 | 41 | |
| 6745.96 | 4.07 | −2.770 | ... | ... | 18 | |
| 6750.15 | 2.42 | −2.620 | 122 | 113 | 115 | |
| 6752.71 | 4.64 | −1.200 | ... | 63 | 65 | |
| 6783.70 | 2.59 | −3.980 | ... | ... | 45 | |
| 6793.25 | 4.07 | −2.470 | 22 | 20 | 25 | |
| 6806.84 | 2.73 | −3.210 | 74 | 68 | 70 | |
| 6810.26 | 4.61 | −1.200 | 70 | 75 | 67 | |
| 6820.37 | 4.64 | −1.170 | 65 | 62 | 59 | |
| 6841.33 | 4.61 | −0.600 | ... | 84 | ... | |
| 6858.15 | 4.61 | −0.930 | 79 | 73 | 71 | |
| 7132.99 | 4.08 | −1.610 | ... | ... | 64 | |
| Fe ii | 4993.35 | 2.81 | −3.670 | 72 | 64 | 56 |
| 4993.35 | 2.81 | −3.670 | ... | ... | 56 | |
| 5132.65 | 2.81 | −4.000 | 59 | 59 | 48 | |
| 5234.62 | 3.22 | −2.240 | 115 | 112 | 103 | |
| 5284.10 | 2.89 | −3.010 | ... | 88 | 79 | |
| 5325.56 | 3.22 | −3.170 | 73 | 66 | 65 | |
| 5414.04 | 3.22 | −3.620 | 57 | ... | 50 | |
| 5425.25 | 3.20 | −3.210 | 71 | 71 | 63 | |
| 5534.83 | 3.25 | −2.770 | 92 | ... | ... | |
| 5991.37 | 3.15 | −3.560 | 65 | 57 | 51 | |
| 6084.09 | 3.20 | −3.800 | 50 | 49 | 44 | |
| 6149.25 | 3.89 | −2.720 | 60 | 57 | 51 | |
| 6247.55 | 3.89 | −2.340 | 81 | ... | 69 | |
| 6416.92 | 3.89 | −2.680 | 65 | 57 | 54 | |
| 6432.68 | 2.89 | −3.580 | 72 | 73 | 66 |
Table 3. Other Lines Studied
| λ | Element | χ | log gf | Ref. | EQW2 | EQW201 | EQW65314 |
|---|---|---|---|---|---|---|---|
| (Å) | (eV) | (mÅ) | (mÅ) | (mÅ) | |||
| 6154.22 | Na i | 2.10 | −1.510 | R03 | 72 | 71 | 67 |
| 6160.75 | Na i | 2.10 | −1.210 | R03 | 84 | 94 | 83 |
| 4730.04 | Mg i | 4.34 | −2.390 | R03 | 90 | ... | ... |
| 5711.10 | Mg i | 4.34 | −1.750 | R99 | 126 | 116 | 118 |
| 6318.71 | Mg i | 5.11 | −1.940 | Ca07 | 45 | 63 | 54 |
| 6319.24 | Mg i | 5.11 | −2.160 | Ca07 | 32 | 38 | 29 |
| 6319.49 | Mg i | 5.11 | −2.670 | Ca07 | ... | ... | 17 |
| 6765.45 | Mg i | 5.75 | −1.940 | MR94 | 26 | ... | ... |
| 6965.41 | Mg i | 5.75 | −1.720 | MR94 | 46 | 50 | 40 |
| 7387.70 | Mg i | 5.75 | −0.870 | MR94 | ... | ... | 69 |
| 8712.69 | Mg i | 5.93 | −1.260 | E93 | 52 | 51 | 51 |
| 8717.83 | Mg i | 5.91 | −0.970 | WSM | 94 | ... | 85 |
| 8736.04 | Mg i | 5.94 | −0.340 | WSM | 128 | 145 | ... |
| 6696.03 | Al i | 3.14 | −1.481 | MR94 | 48 | ... | 48 |
| 6698.67 | Al i | 3.14 | −1.630 | R03 | 39 | 36 | ... |
| 7835.32 | Al i | 4.04 | −0.580 | R03 | 56 | 64 | 56 |
| 7836.13 | Al i | 4.02 | −0.400 | R03 | 62 | 66 | 68 |
| 8772.88 | Al i | 4.02 | −0.250 | R03 | ... | 102 | 90 |
| 8773.91 | Al i | 4.02 | −0.070 | R03 | ... | ... | 99 |
| 5793.08 | Si i | 4.93 | −2.060 | R03 | 71 | 60 | 57 |
| 6125.03 | Si i | 5.61 | −1.540 | E93 | 42 | 47 | 46 |
| 6131.58 | Si i | 5.62 | −1.685 | E93 | 35 | 33 | 30 |
| 6145.02 | Si i | 5.61 | −1.430 | E93 | 57 | ... | 86 |
| 6155.14 | Si i | 5.62 | −0.770 | E93 | 91 | 102 | 86 |
| 7760.64 | Si i | 6.20 | −1.280 | E93 | 32 | 39 | 22 |
| 7800.00 | Si i | 6.18 | −0.720 | E93 | 67 | 78 | 70 |
| 8728.01 | Si i | 6.18 | −0.360 | E93 | ... | ... | 91 |
| 8742.45 | Si i | 5.87 | −0.510 | E93 | 110 | 113 | ... |
| 5581.98 | Ca i | 2.52 | −0.670 | C2003 | ... | ... | 119 |
| 5867.57 | Ca i | 2.93 | −1.610 | C2003 | ... | ... | 37 |
| 6102.73 | Ca i | 1.88 | −0.790 | D2002 | 154 | 149 | ... |
| 6161.30 | Ca i | 2.52 | −1.270 | E93 | ... | ... | 86 |
| 6166.44 | Ca i | 2.52 | −1.140 | R03 | 97 | 98 | 93 |
| 6169.04 | Ca i | 2.52 | −0.800 | R03 | 120 | 107 | 109 |
| 6169.56 | Ca i | 2.53 | −0.480 | DS91 | 128 | 134 | ... |
| 6449.82 | Ca i | 2.52 | −0.500 | C2003 | ... | ... | 116 |
| 6455.60 | Ca i | 2.51 | −1.290 | R03 | 89 | 98 | 83 |
| 6464.68 | Ca i | 2.52 | −2.410 | C2003 | ... | ... | 30 |
| 6471.66 | Ca i | 2.51 | −0.690 | S86 | 121 | 116 | 112 |
| 6493.79 | Ca i | 2.52 | −0.110 | DS91 | ... | 149 | ... |
| 6499.65 | Ca i | 2.52 | −0.810 | C2003 | ... | ... | 105 |
| 6798.47 | Ca i | 2.71 | −2.520 | C2003 | ... | ... | 15 |
| 4512.74 | Ti i | 0.84 | −0.480 | MFK | 114 | ... | ... |
| 4518.03 | Ti i | 0.83 | −0.320 | MFK | 111 | ... | ... |
| 4534.78 | Ti i | 0.84 | +0.280 | MFK | 139 | ... | ... |
| 4548.77 | Ti i | 0.83 | −0.350 | MFK | 108 | 100 | ... |
| 4555.49 | Ti i | 0.85 | −0.489 | MFK | 98 | 105 | ... |
| 4562.64 | Ti i | 0.02 | −2.660 | MFK | 51 | 42 | ... |
| 4617.28 | Ti i | 1.75 | +0.389 | MFK | 102 | 95 | ... |
| 4639.95 | Ti i | 1.74 | −0.190 | MFK | ... | 76 | ... |
| 4681.92 | Ti i | 0.05 | −1.070 | MFK | ... | 114 | ... |
| 4758.12 | Ti i | 2.25 | +0.420 | MFK | 64 | ... | 65 |
| 4759.28 | Ti i | 2.25 | +0.511 | MFK | 71 | 72 | 69 |
| 4778.26 | Ti i | 2.24 | −0.300 | MFK | 35 | 36 | ... |
| 4997.10 | Ti i | 0.00 | −2.120 | MFK | 72 | 67 | ... |
| 5009.66 | Ti i | 0.02 | −2.259 | MFK | ... | ... | 71 |
| 5016.17 | Ti i | 0.85 | −0.570 | MFK | 116 | 100 | 100 |
| 5022.87 | Ti i | 0.83 | −0.429 | MFK | 115 | 111 | 106 |
| 5039.96 | Ti i | 0.02 | −1.130 | MFK | ... | ... | 117 |
| 5040.61 | Ti i | 0.83 | −1.787 | MFK | ... | ... | 50 |
| 5043.59 | Ti i | 0.84 | −1.733 | MFK | ... | ... | 49 |
| 5062.10 | Ti i | 2.16 | −0.460 | MFK | 37 | 34 | 33 |
| 5087.06 | Ti i | 1.43 | −0.840 | MFK | ... | ... | 66 |
| 5113.45 | Ti i | 1.44 | −0.780 | E93 | 51 | 50 | 52 |
| 5145.47 | Ti i | 1.46 | −0.570 | MFK | 78 | 67 | 65 |
| 5147.48 | Ti i | 0.00 | −2.012 | MFK | ... | ... | 91 |
| 5152.19 | Ti i | 0.02 | −0.202 | MFK | 78 | 70 | ... |
| 5210.39 | Ti i | 0.05 | −0.879 | MFK | 148 | 143 | ... |
| 5219.71 | Ti i | 0.02 | −2.290 | MFK | 80 | 73 | 73 |
| 5223.63 | Ti i | 2.09 | −0.561 | MFK | 27 | 42 | 37 |
| 5282.44 | Ti i | 1.05 | −1.300 | MFK | 55 | 48 | ... |
| 5295.78 | Ti i | 1.05 | −1.631 | MFK | 36 | 29 | 38 |
| 5490.16 | Ti i | 1.46 | −0.932 | MFK | 49 | 47 | 47 |
| 5503.90 | Ti i | 2.58 | −0.190 | MFK | ... | 20 | ... |
| 5662.16 | Ti i | 2.32 | −0.110 | MFK | 54 | ... | 47 |
| 5689.48 | Ti i | 2.30 | −0.470 | MFK | 35 | 28 | 32 |
| 5866.46 | Ti i | 1.07 | −0.871 | E93 | ... | ... | 90 |
| 5922.12 | Ti i | 1.05 | −1.470 | MFK | 65 | 44 | 51 |
| 5978.55 | Ti i | 1.87 | −0.500 | MFK | 52 | 51 | 54 |
| 6091.18 | Ti i | 2.27 | −0.370 | R03 | 44 | ... | 32 |
| 6126.22 | Ti i | 1.05 | −1.420 | R03 | 71 | 64 | 61 |
| 6258.11 | Ti i | 1.44 | −0.360 | MFK | 100 | 90 | 85 |
| 6261.10 | Ti i | 1.43 | −0.480 | B86 | 94 | 82 | 91 |
| 6554.24 | Ti i | 1.44 | −1.220 | MFK | 42 | 43 | 40 |
| 4836.85 | Cr i | 3.10 | −1.140 | MFK | ... | 33 | ... |
| 4936.34 | Cr i | 3.11 | −0.220 | MFK | 68 | 67 | ... |
| 4954.80 | Cr i | 3.12 | −0.140 | MFK | ... | 69 | ... |
| 4964.93 | Cr i | 0.94 | −2.526 | MFK | ... | ... | 68 |
| 5193.50 | Cr i | 3.42 | −0.900 | MFK | 29 | ... | 19 |
| 5214.13 | Cr i | 3.37 | −0.740 | MFK | 25 | 27 | 25 |
| 5214.61 | Cr i | 3.32 | −0.660 | MFK | 44 | 49 | ... |
| 5238.96 | Cr i | 2.71 | −1.300 | MFK | 29 | 34 | 31 |
| 5247.57 | Cr i | 0.96 | −1.631 | MFK | 132 | 121 | 111 |
| 5272.00 | Cr i | 3.45 | −0.420 | MFK | 36 | 35 | 40 |
| 5296.70 | Cr i | 0.98 | −1.240 | GS | 143 | 135 | ... |
| 5298.28 | Cr i | 0.98 | −1.170 | MFK | ... | 144 | ... |
| 5300.75 | Cr i | 0.98 | −2.130 | GS | 97 | 97 | 90 |
| 5304.18 | Cr i | 3.46 | −0.690 | MFK | 26 | 27 | 23 |
| 5312.86 | Cr i | 3.45 | −0.561 | MFK | 44 | 30 | 25 |
| 5318.77 | Cr i | 3.44 | −0.690 | MFK | 27 | 31 | 21 |
| 5340.45 | Cr i | 3.44 | −0.730 | MFK | 20 | ... | 26 |
| 5348.33 | Cr i | 1.00 | −1.290 | GS | 145 | 125 | ... |
| 5628.65 | Cr i | 3.42 | −0.770 | MFK | 21 | 29 | 20 |
| 5781.18 | Cr i | 3.32 | −0.879 | MFK | 26 | ... | ... |
| 5783.07 | Cr i | 3.32 | −0.400 | MFK | 48 | 52 | 42 |
| 5784.97 | Cr i | 3.32 | −0.380 | MFK | 48 | 47 | 48 |
| 5787.93 | Cr i | 3.32 | −0.080 | GS | 72 | 68 | 63 |
| 6330.10 | Cr i | 0.94 | −2.870 | R03 | 70 | 68 | 64 |
| 4513.00 | Ni i | 3.71 | −1.520 | MFK | ... | 30 | ... |
| 4904.42 | Ni i | 3.54 | −0.190 | MFK | ... | 105 | 100 |
| 4913.98 | Ni i | 3.74 | −0.600 | MFK | 76 | 78 | 72 |
| 4935.83 | Ni i | 3.94 | −0.340 | MFK | 83 | ... | 64 |
| 4953.21 | Ni i | 3.74 | −0.620 | MFK | ... | 80 | 75 |
| 4967.52 | Ni i | 3.80 | −1.600 | MFK | 25 | 31 | 28 |
| 4995.66 | Ni i | 3.63 | −1.611 | MFK | 38 | 35 | 33 |
| 5003.75 | Ni i | 1.68 | −3.130 | MFK | 65 | 64 | ... |
| 5010.94 | Ni i | 3.63 | −0.900 | MFK | 72 | 62 | 62 |
| 5084.11 | Ni i | 3.68 | −0.180 | E93 | ... | ... | 98 |
| 5094.42 | Ni i | 3.83 | −1.120 | MFK | 47 | 45 | 41 |
| 5115.40 | Ni i | 3.83 | −0.280 | R03 | ... | ... | 87 |
| 5157.98 | Ni i | 3.61 | −1.720 | MFK | 35 | 37 | 29 |
| 5197.17 | Ni i | 3.90 | −1.140 | MFK | 48 | 46 | 43 |
| 5578.73 | Ni i | 1.68 | −2.640 | MFK | ... | ... | 95 |
| 5587.87 | Ni i | 1.94 | −2.370 | MFK | 99 | 90 | ... |
| 5589.37 | Ni i | 3.90 | −1.150 | MFK | 38 | ... | 34 |
| 5593.75 | Ni i | 3.90 | −0.790 | MFK | 62 | 72 | 55 |
| 5643.09 | Ni i | 4.17 | −1.250 | MFK | 31 | 28 | 22 |
| 5709.56 | Ni i | 1.68 | −2.140 | MFK | ... | 110 | 111 |
| 5748.36 | Ni i | 1.68 | −3.250 | MFK | 66 | 68 | 64 |
| 5760.84 | Ni i | 4.11 | −0.810 | MFK | 56 | 61 | 47 |
| 5805.23 | Ni i | 4.17 | −0.600 | MFK | 56 | 54 | 49 |
| 5847.01 | Ni i | 1.68 | −3.440 | MFK | 60 | 51 | ... |
| 5996.74 | Ni i | 4.24 | −1.060 | MFK | 39 | 37 | 31 |
| 6053.69 | Ni i | 4.24 | −1.070 | MFK | 42 | ... | 32 |
| 6086.29 | Ni i | 4.27 | −0.470 | MFK | 58 | 68 | 58 |
| 6108.12 | Ni i | 1.68 | −2.440 | MFK | ... | ... | 100 |
| 6111.08 | Ni i | 4.09 | −0.830 | MFK | 54 | 54 | 48 |
| 6128.98 | Ni i | 1.68 | −3.390 | MFK | 68 | 65 | 57 |
| 6130.14 | Ni i | 4.27 | −0.979 | MFK | 40 | 37 | 31 |
| 6176.82 | Ni i | 4.09 | −0.260 | MFK | 86 | 88 | 78 |
| 6177.25 | Ni i | 1.83 | −0.360 | MFK | 38 | 39 | 35 |
| 6186.72 | Ni i | 4.11 | −0.900 | MFK | 43 | 42 | 38 |
| 6204.61 | Ni i | 4.09 | −1.150 | MFK | ... | 37 | 38 |
| 6223.99 | Ni i | 4.11 | −0.971 | MFK | 53 | ... | 41 |
| 6230.10 | Ni i | 4.11 | −1.200 | MFK | 42 | 41 | ... |
| 6322.17 | Ni i | 4.15 | −1.210 | MFK | 30 | 25 | 27 |
| 6327.60 | Ni i | 1.68 | −3.090 | MFK | 86 | 86 | 74 |
| 6378.26 | Ni i | 4.15 | −0.821 | MFK | 55 | ... | 49 |
| 6384.67 | Ni i | 4.15 | −1.000 | MFK | ... | 44 | 35 |
| 6482.81 | Ni i | 1.94 | −2.851 | MFK | 86 | 84 | 73 |
| 6532.88 | Ni i | 1.94 | −3.420 | MFK | ... | 48 | 37 |
| 6586.33 | Ni i | 1.95 | −2.790 | MFK | 78 | 75 | 76 |
| 6598.61 | Ni i | 4.24 | −0.932 | MFK | 40 | 41 | ... |
| 6635.14 | Ni i | 4.42 | −0.750 | MFK | 48 | ... | 38 |
| 6643.64 | Ni i | 1.68 | −2.030 | MFK | 146 | ... | ... |
| 6767.77 | Ni i | 1.83 | −2.110 | MFK | 131 | 123 | 116 |
| 6772.32 | Ni i | 3.66 | −1.010 | R03 | ... | 75 | 69 |
| 6842.04 | Ni i | 3.66 | −1.440 | MFK | 47 | 40 | 41 |
| 7788.93 | Ni i | 1.95 | −1.990 | E93 | 148 | ... | ... |
| 4883.68 | Y ii | 1.08 | +0.070 | SN96 | ... | 144 | ... |
| 5087.43 | Y ii | 1.08 | −0.170 | SN96 | 120 | 126 | 107 |
| 5123.21 | Y ii | 0.99 | −0.930 | SN96 | ... | 92 | ... |
| 5200.41 | Y ii | 0.99 | −0.570 | SN96 | 124 | 112 | 100 |
| 5205.72 | Y ii | 1.03 | −0.340 | SN96 | 141 | 116 | ... |
| 5289.81 | Y ii | 1.03 | −1.850 | VWR | 59 | 52 | 45 |
| 5402.78 | Y ii | 1.84 | −0.440 | R03 | 91 | 76 | 60 |
| 4772.30 | Zr i | 0.62 | −0.060 | A05 | 49 | 50 | 37 |
| 4784.94 | Zr i | 0.69 | −0.600 | A05 | ... | ... | 17 |
| 4805.87 | Zr i | 0.69 | −0.580 | A05 | 19 | 17 | 16 |
| 4809.47 | Zr i | 1.58 | +0.350 | A05 | 14 | 15 | 10 |
| 4815.05 | Zr i | 0.65 | −0.380 | A05 | ... | ... | 17 |
| 4815.63 | Zr i | 0.60 | −0.270 | A05 | ... | 33 | 27 |
| 4828.05 | Zr i | 0.62 | −0.750 | A05 | ... | 18 | 10 |
| 5385.13 | Zr i | 0.52 | −0.640 | A05 | 20 | 23 | 18 |
| 5879.79 | Zr i | 0.15 | −1.030 | A05 | 27 | 26 | 17 |
| 5955.34 | Zr i | 0.00 | −1.700 | A05 | ... | 17 | ... |
| 6127.46 | Zr i | 0.15 | −1.060 | S96 | 15 | 30 | 27 |
| 6134.57 | Zr i | 0.00 | −1.280 | S96 | 15 | 31 | 26 |
| 6143.18 | Zr i | 0.07 | −1.100 | S96 | 15 | 32 | 34 |
| 4086.71 | La ii | 0.00 | −0.160 | VWR | 110 | ... | ... |
| 5122.99 | La ii | 0.32 | −0.930 | SN96 | ... | 68 | ... |
| 5303.53 | La ii | 0.32 | −1.350 | VWR | 49 | 52 | 45 |
| 5880.63 | La ii | 0.24 | −1.830 | R04 | 31 | ... | 39 |
| 6320.42 | La ii | 0.17 | −1.520 | VWR | 55 | 61 | 49 |
| 6390.48 | La ii | 0.32 | −1.410 | SN96 | 62 | 46 | 50 |
| 6774.33 | La ii | 0.12 | −1.709 | SN96 | 58 | 56 | 51 |
| 4073.47 | Ce ii | 0.48 | +0.320 | SN96 | 91 | ... | ... |
| 4120.84 | Ce ii | 0.32 | −0.240 | SN96 | 74 | ... | ... |
| 4127.38 | Ce ii | 0.68 | +0.240 | SN96 | 82 | 78 | ... |
| 4418.79 | Ce ii | 0.86 | +0.310 | SN96 | 83 | ... | 77 |
| 4486.91 | Ce ii | 0.30 | −0.360 | SN96 | ... | ... | 78 |
| 4562.37 | Ce ii | 0.48 | +0.330 | SN96 | 98 | 95 | 94 |
| 4628.16 | Ce ii | 1.40 | +0.010 | SN96 | ... | ... | 93 |
| 5117.17 | Ce ii | 1.40 | +0.010 | VWR | 36 | 29 | 38 |
| 5187.45 | Ce ii | 1.21 | +0.300 | VWR | 59 | 51 | ... |
| 5274.24 | Ce ii | 1.28 | +0.389 | VWR | 61 | ... | 57 |
| 5472.30 | Ce ii | 1.25 | −0.190 | VWR | 44 | 35 | 39 |
| 6051.80 | Ce ii | 0.23 | −1.600 | SN96 | ... | 22 | 30 |
| 4811.34 | Nd ii | 0.06 | −1.015 | VWR | 73 | 70 | 78 |
| 4959.12 | Nd ii | 0.06 | −0.916 | VWR | ... | ... | 83 |
| 5063.72 | Nd ii | 0.98 | −0.758 | VWR | ... | 32 | 28 |
| 5130.59 | Nd ii | 1.30 | +0.100 | SN96 | 59 | 62 | 62 |
| 5212.36 | Nd ii | 0.20 | −0.700 | E93 | 85 | ... | ... |
| 5234.19 | Nd ii | 0.55 | −0.460 | SN96 | ... | 59 | ... |
| 5311.46 | Nd ii | 0.99 | −0.560 | SN96 | 52 | 49 | 46 |
| 5319.81 | Nd ii | 0.55 | −0.350 | SN96 | 87 | 78 | 74 |
| 5416.38 | Nd ii | 0.86 | −0.980 | VWR | 18 | ... | ... |
| 5431.54 | Nd ii | 1.12 | −0.457 | VWR | 34 | 37 | ... |
| 5442.26 | Nd ii | 0.68 | −0.900 | SN96 | ... | 47 | ... |
| 5740.88 | Nd ii | 1.16 | −0.560 | VWR | 28 | ... | ... |
| 5842.39 | Nd ii | 1.28 | −0.601 | VWR | 20 | ... | ... |
References. A05: Antipova et al. 2005; B86: Blackwell et al. 1986; Ca07: Carretta et al. 2007; C2003: Chen et al. 2003; D2002: Depagne et al. 2002; DS91: Drake & Smith 1991; E93: Edvardsson et al. 1993; GS: Gratton & Sneden 1988; MFK: Martin et al. 1999; MR94: McWilliam & Rich 1994; R03: Reddy et al. 2003; R04: Reyniers et al. 2004; R99: Reddy et al. 1999; S86: Smith et al. 1986; S96: Smith et al. 1996; SN96: Sneden et al. 1996; VWR: van Winckel & Reyniers 2000; WSM: Wiese et al. 1969.
3.2. Atmospheric Parameters
To obtain the chemical abundances, it is necessary first to calculate the stellar parameters: effective temperature Teff, surface gravity log g, metallicity [Fe/H] ([X/H] = log (NX/NH)⋆ − log (NX/NH)☉), and microturbulent velocity ξ. The atmospheric parameters were determined using the local thermodynamic equilibrium (LTE) model atmospheres of Kurucz (1993) and the spectral analysis code MOOG (Sneden 1973).
The effective temperature was derived by requiring that the abundances calculated for the Fe i lines do not show any dependence upon excitation potential. Thus, the solution thus found is unique, depending only on a set of Fe i and Fe ii lines and the employed atmospheric model, and yields as a by-product the metallicity of the star ([Fe/H]). The gravity was determined by forcing the Fe i and Fe ii lines to yield the same iron abundance at the selected effective temperature. The microturbulent velocity was determined by forcing the abundance determined from individual Fe i lines to show no dependence on the equivalent width. Results for the stellar parameters are shown in Table 4.
Table 4. Atmospheric Parameters of NGC 5822-2 and -201 and the Barium star HD 65314
| NGC 5822-2 | NGC 5822-201 | NGC 5822-2a | NGC 5822-201b | HD 65314 | |
|---|---|---|---|---|---|
| Teff (K) | 5100 ± 100 | 5200 ± 120 | 5100 | 5035 | 5000 ± 120 |
| log g (dex) | 2.4 ± 0.2 | 2.7 ± 0.2 | 2.25 | 2.85 | 2.5 ± 0.2 |
| [Fe/H] (dex) | −0.15 ± 0.09 | −0.11 ± 0.10 | 0.04 | 0.05 ± 0.10 | −0.12 ± 0.11 |
| ξ (km s−1) | 1.6 ± 0.2 | 1.5 ± 0.2 | 2.2 | 1.32 | 1.2 ± 0.3 |
Notes. aLuck (1994). bSmiljanic et al. (2009).
Download table as: ASCIITypeset image
Previous determinations of the atmospheric parameters of NGC 5822-2 and -201 were done, respectively, by Luck (1994) and Smiljanic et al. (2009). The solutions are also shown in Table 4. The observations of Luck (1994) were done with medium resolution (R = 18,000) while Smiljanic et al. (2009) observed with the FEROS spectrograph. As can be observed in Table 4, our stellar parameters are in good agreement with previous determinations, except for the microturbulence velocity.
As was mentioned earlier, we have compared the spectra of NGC 5822-2 and -201 with the spectrum of barium star HD 65314 and normal giant HD 2114. HD 65314 was also selected as an s-process-enriched comparison star after analyzing our results for the stellar parameters and abundances obtained from the large high-resolution spectroscopic survey of the barium stars selected from the samples of MacConnell et al. (1972) and Bidelman (1981) as well as some stars from Gomez et al. (1997). This survey aims to obtain the atmospheric parameters, abundances, and the kinematical properties of these chemically peculiar stars and compare them with the non-s-process-enriched giant stars. Of the 230 surveyed stars, we have already discovered a new CH subgiant, BD−03°3668 (Pereira & Drake 2011) as well as a sample of metal-rich barium stars (Pereira et al. 2011). As will be seen in Section 4.2.3, HD 65314 displays a mean s-process abundance ([s/Fe]) similar to that of NGC 5822-2 and -201. Table 4 also shows the atmospheric parameters of HD 65314.
HD 2114 was included in our study after searching in the literature for a star with stellar parameters similar to those found for the cluster giants and with a spectrum that would be available in the ESO archives, so that a comparison between HD 2114 and the spectra of the stars studied here was possible. We obtained the following atmospheric parameters using the spectroscopic data from ESO: Tefff = 5200, log g = 2.3, [Fe/H] = −0.13, and ξ = 1.7. These are similar to those found by Hekker & Meléndez (2007): Tefff = 5160, log g = 2.55, [Fe/H] = −0.15, and ξ = 1.85.
The internal errors in our adopted effective temperatures (Teff) and microturbulent velocities (ξ) can be determined from the uncertainty in the slopes of the Fe i abundance versus excitation potential and Fe i abundance versus reduced equivalent width (Wλ/λ). The standard deviation in log g was set by changing this parameter around the adopted solution until the difference between the Fe i and Fe ii mean abundance differed by exactly one standard deviation of the [Fe i/H] mean value. Based on the above description, we estimate typical uncertainties in atmospheric parameters of the order of ±100 K, ±0.20 dex, and ±0.2 km s−1 for Teff, log g, and ξ, respectively.
To test our gravities obtained from spectroscopy for NGC 5822-2 and -201, we have calculated evolutionary gravities from the equation below:
The turnoff mass (M = 2.1 M☉), interstellar absorption (AV = 0.45), and distance (r = 697 pc) for NGC 5822 were taken from Table 2 of Smiljanic et al. (2009), and bolometric corrections were taken from Alonso et al. (1999). We found a mean difference of approximately of 0.1 dex for both stars between the spectroscopic and evolutionary gravities.
3.3. Abundance Analysis
The abundances of chemical elements were determined with LTE model atmosphere techniques. The equivalent widths were calculated by integration through a model atmosphere and were compared with the measured equivalent widths. The current version of the line-synthesis code moog (Sneden 1973) was used to carry out the calculations. Table 5 shows the derived abundances of the elements and also the number of lines employed (or number of spectral regions, in the case of carbon and nitrogen whose abundances were determined using molecular lines) for each species, n, the standard deviation, and in the notations [X/H] and [X/Fe] as well as the C/O ratio. The adopted abundances for the elements analyzed in this work were normalized to the solar abundances of Grevesse & Sauval (1998). For the solar iron abundance, we adopted log ε(Fe) = 7.52.
Table 5. Abundances in the log ε(H) = 12.0 Scale and in the Notations [X/H] and [X/Fe]
| Species | NGC 5822-2 | NGC 5822-201 | HD 65314 | |||||||||
|---|---|---|---|---|---|---|---|---|---|---|---|---|
| n | log ε | [X/H] | [X/Fe] | n | log ε | [X/H] | [X/Fe] | n | log ε | [X/H] | [X/Fe] | |
| Fe i | 57 | 7.37 ± 0.09 | −0.15 | ... | 66 | 7.41 ± 0.10 | −0.11 | ... | 72 | 7.39 ± 0.11 | −0.13 | ... |
| Fe ii | 13 | 7.37 ± 0.06 | −0.15 | ... | 11 | 7.41 ± 0.09 | −0.11 | ... | 13 | 7.39 ± 0.08 | −0.13 | ... |
| C i | 2 | 8.30 | −0.22 | −0.07 | 2 | 8.52 | 0.00 | +0.11 | 2 | 8.32 | −0.20 | −0.07 |
| N i | 6 | 8.39 ± 0.08 | +0.47 | +0.62 | 6 | 8.35 ± 0.09 | +0.43 | +0.54 | 6 | 8.27 ± 0.07 | +0.35 | +0.46 |
| O i | 1 | 8.53 | −0.30 | −0.15 | 1 | 8.82 | −0.01 | +0.10 | 1 | 8.53 | −0.30 | −0.17 |
| Na i | 2 | 6.37 | +0.04 | +0.19 | 2 | 6.29 | −0.04 | +0.07 | 2 | 6.31 | −0.02 | +0.11 |
| Mg i | 7 | 7.66 ± 0.10 | +0.08 | +0.23 | 8 | 7.61 ± 0.15 | +0.03 | +0.14 | 8 | 7.46 ± 0.17 | −0.12 | −0.01 |
| Al i | 4 | 6.29 ± 0.07 | −0.18 | −0.03 | 4 | 6.52 ± 0.12 | +0.05 | +0.16 | 5 | 6.39 ± 0.11 | −0.06 | +0.07 |
| Si i | 8 | 7.59 ± 0.09 | +0.04 | +0.19 | 5 | 7.65 ± 0.11 | +0.10 | +0.21 | 8 | 7.55 ± 0.12 | 0.00 | −0.13 |
| Ca i | 8 | 6.33 ± 0.08 | −0.03 | +0.12 | 5 | 6.34 ± 0.07 | −0.02 | +0.09 | 11 | 6.26 ± 0.10 | −0.10 | +0.03 |
| Ti i | 27 | 4.86 ± 0.11 | −0.16 | −0.01 | 32 | 4.88 ± 0.13 | −0.14 | −0.03 | 27 | 4.71 ± 0.09 | −0.31 | −0.19 |
| Cr i | 20 | 5.51 ± 0.13 | −0.16 | −0.01 | 20 | 5.59 ± 0.11 | −0.08 | 0.03 | 16 | 5.35 ± 0.07 | −0.32 | −0.19 |
| Ni i | 38 | 6.14 ± 0.09 | −0.11 | +0.04 | 40 | 6.20 ± 0.10 | −0.05 | +0.06 | 43 | 6.06 ± 0.11 | −0.19 | −0.06 |
| Y ii | 4 | 3.02 ± 0.13 | +0.78 | +0.93 | 6 | 2.96 ± 0.10 | +0.72 | +0.83 | 4 | 2.72 ± 0.11 | +0.48 | +0.61 |
| Zr i | 8 | 3.05 ± 0.08 | +0.45 | +0.60 | 11 | 3.24 ± 0.09 | +0.64 | +0.75 | 12 | 2.83 ± 0.12 | +0.23 | +0.36 |
| La ii | 6 | 1.77 ± 0.12 | +0.60 | +0.75 | 5 | 1.94 ± 0.06 | +0.77 | +0.88 | 5 | 1.80 ± 0.09 | +0.63 | +0.76 |
| Ce ii | 10 | 2.18 ± 0.13 | +0.60 | +0.75 | 5 | 2.36 ± 0.16 | +0.76 | +0.87 | 8 | 2.4 ± 0.22 | +0.82 | +0.95 |
| Nd ii | 8 | 2.15 ± 0.16 | +0.65 | +0.80 | 10 | 2.20 ± 0.15 | +0.70 | +0.81 | 6 | 2.38 ± 0.19 | +0.88 | +1.01 |
| C/O = 0.59 | C/O = 0.50 | C/O = 0.61 | ||||||||||
Download table as: ASCIITypeset image
Carbon, nitrogen, and oxygen abundances were determined using the spectrum synthesis technique. For the oxygen abundance in NGC 5822-2 and -201, we used the line at 6363.78 Å because the line at 6300.31 Å is contaminated by the telluric O2 line in both stars. The gf value for the 6363.78 Å line was taken from Lambert (1978). In HD 65314, we used the forbidden line at 6300.63 Å to obtain the oxygen abundance.
Since the abundances of the CNO elements are interdependent because of the association of carbon and oxygen in CO molecules in the atmospheres of cool giants, the CNO abundance determination procedure was iterated until all the abundances of these three elements agreed. The abundances of carbon and nitrogen were determined using the lines of the CN and C2 molecules. The line lists used in this work are the same as used in previous studies done for some barium stars (Pereira & Drake 2009; Drake & Pereira 2011). The observed and synthetic spectra of NGC 5822-2, -201, and HD 65314 in the region around the C2 molecule at 5635 Å are shown in Figure 5.
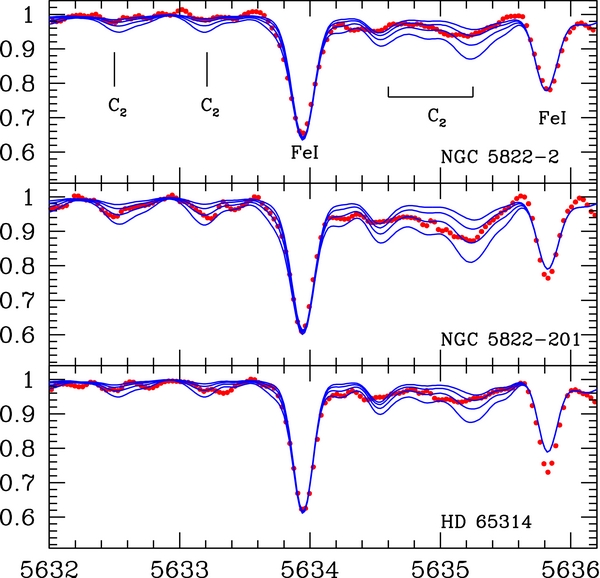
Figure 5. Observed (dotted red line) and synthetic (solid blue line) spectra in the region around the C2 molecule lines at 5635 Å for the stars NGC 5822-2, NGC 5822-201, and HD 65314. In the synthetic spectra of NGC 5822-2, we show the synthesis for carbon abundances of log ε(C) = 8.20, 8.30, 8.40, and 8.52; for NGC 5822-201, we show the synthesis for carbon abundances of logε(C) = 8.32, 8.42, 8.52, and 8.62; and for HD 65314, we show the synthesis for carbon abundances of log ε(C) = 8.12, 8.22, 8.32, and 8.42.
Download figure:
Standard image High-resolution imageWe do not measure the barium abundance in our stars because all barium lines have equivalent widths higher than 200 mÅ and therefore will not be at the linear part of the curve of growth (Hill et al. 1995; Pereira et al. 2011). However, since we have measured several other lines of other elements synthesized by the s-process (Y, Zr, La, Ce, and Nd), we believe that we probed this nucleosynthesis process in NGC 5822-2 and NGC 5822-201 fairly well.
3.4. Abundance Uncertainties
The abundance uncertainties of NGC 5822-2 and -201 are shown in Tables 6 and 7. HD 65314 also displays similar abundance uncertainties. The abundance uncertainties due to the errors in the effective temperatures and microturbulent velocities were determined by changing these parameters around the adopted solutions until the difference in the iron abundance became one standard deviation. The uncertainties in the abundances, due to errors in the stellar atmospheric parameters, were computed by changing these parameters by their standard deviations given in Table 4 and calculating the changes incurred in the element abundances. The final uncertainty of the abundance by number is found by composing quadratically the uncertainties due to atmospheric parameters and the Wλ's. The abundance uncertainties resulting from the errors in the equivalent width measurements were computed from the expression provided by Cayrel (1988). These errors we are set, essentially, by the S/N and the resolution of the spectra. In our case, having 48,000 and a typical S/N of 150, the expected uncertainties in the equivalent widths are about 2–3 mÅ. For all measured equivalent widths, these uncertainties led to errors in the abundances less than those due to the uncertainties in the stellar parameters. They were calculated by quadratically combining the different sources of errors under the assumption that the errors were independent. In the last column of Tables 6 and 7, we quote the observed abundance dispersion among the lines for those elements with more than three available lines.
Table 6. Abundance Uncertainties of NGC 5822-2
| Species | ΔTeff | Δlog g | Δξ | ΔWλ | (∑σ2)1/2 | σobs |
|---|---|---|---|---|---|---|
| +100 K | +0.2 | +0.2 | +3 mÅ | |||
| Fe i | −0.09 | +0.00 | +0.08 | −0.06 | 0.13 | 0.09 |
| Fe ii | −0.06 | −0.07 | +0.08 | −0.07 | 0.14 | 0.06 |
| C i | −0.01 | +0.04 | −0.04 | ... | 0.06 | ... |
| N i | −0.10 | +0.06 | +0.09 | ... | 0.15 | 0.08 |
| O i | −0.02 | −0.10 | −0.01 | ... | 0.10 | ... |
| Na i | −0.06 | +0.01 | +0.04 | −0.04 | 0.08 | ... |
| Mg i | −0.04 | +0.01 | +0.04 | −0.04 | 0.07 | 0.10 |
| Al i | −0.05 | +0.00 | +0.02 | −0.05 | 0.07 | 0.07 |
| Si i | 0.00 | −0.02 | +0.03 | −0.05 | 0.06 | 0.09 |
| Ca i | −0.10 | +0.01 | +0.11 | −0.05 | 0.15 | 0.08 |
| Ti i | −0.13 | +0.00 | +0.08 | −0.06 | 0.16 | 0.11 |
| Cr i | −0.09 | +0.01 | +0.06 | −0.06 | 0.12 | 0.13 |
| Ni i | −0.07 | −0.01 | +0.06 | −0.06 | 0.11 | 0.09 |
| Y ii | 0.00 | −0.06 | +0.15 | −0.06 | 0.17 | 0.13 |
| Zr i | −0.15 | +0.00 | +0.01 | −0.07 | 0.17 | 0.08 |
| La ii | −0.02 | −0.07 | +0.07 | −0.06 | 0.12 | 0.12 |
| Ce ii | −0.01 | −0.06 | +0.14 | −0.07 | 0.17 | 0.13 |
| Nd ii | −0.02 | −0.07 | +0.09 | −0.07 | 0.14 | 0.16 |
Notes. Column 2 gives the variation of the abundance caused by the variation in Teff. The other columns refer, respectively, to the variations due to log g, ξ, and Wλ. Column 6 gives the compounded rms uncertainty of the second to fifth columns. The last column gives the observed abundance dispersion for those elements whose abundances were derived using more than three lines.
Download table as: ASCIITypeset image
Table 7. Abundance Uncertainties of NGC 5822-201
| Species | ΔTeff | Δlog g | Δξ | ΔWλ | (∑σ2)1/2 | σobs |
|---|---|---|---|---|---|---|
| +120 K | +0.2 | +0.2 | +3 mÅ | |||
| Fe i | −0.11 | +0.00 | +0.08 | −0.06 | 0.15 | 0.10 |
| Fe ii | +0.06 | −0.08 | +0.08 | −0.06 | 0.14 | 0.09 |
| C i | −0.06 | −0.03 | −0.03 | ... | 0.07 | ... |
| N i | −0.17 | −0.04 | −0.04 | ... | 0.18 | 0.09 |
| O i | −0.03 | −0.08 | −0.01 | ... | 0.09 | ... |
| Na i | −0.08 | +0.01 | +0.03 | −0.04 | 0.09 | ... |
| Mg i | −0.05 | +0.01 | +0.03 | −0.05 | 0.08 | 0.15 |
| Al i | −0.06 | +0.01 | +0.04 | −0.05 | 0.09 | 0.12 |
| Si i | −0.02 | +0.00 | +0.04 | −0.05 | 0.07 | 0.11 |
| Ca i | −0.11 | +0.00 | +0.12 | −0.05 | 0.17 | 0.07 |
| Ti i | −0.15 | +0.01 | +0.07 | −0.06 | 0.18 | 0.13 |
| Cr i | −0.12 | −0.01 | +0.07 | −0.06 | 0.15 | 0.11 |
| Ni i | −0.10 | −0.02 | +0.05 | −0.06 | 0.13 | 0.10 |
| Y ii | −0.01 | −0.04 | +0.15 | −0.06 | 0.18 | 0.10 |
| Zr i | −0.17 | −0.01 | +0.01 | −0.08 | 0.18 | 0.09 |
| La ii | −0.02 | −0.05 | +0.07 | −0.06 | 0.11 | 0.06 |
| Ce ii | −0.03 | −0.12 | +0.16 | −0.08 | 0.22 | 0.16 |
| Nd ii | −0.02 | −0.14 | +0.06 | −0.07 | 0.17 | 0.15 |
Note. Columns and symbols have the same meaning as in Table 6.
Download table as: ASCIITypeset image
We verify the well-known relations from Tables 6 and 7 that neutral elements are more sensitive to the temperature variations, while singly ionized elements are more sensitive to the variations in log g. For the elements whose abundance is based on stronger lines, such as the lines of calcium, yttrium, and cerium, the error introduced by the microturbulence is important.
4. DISCUSSION
4.1. Luminosities of NGC 5822-2 and NGC 5822-201
For NGC 5822-2 and -201, the bolometric magnitude which results from the adopted turnoff mass, temperature, and gravity of the two stars is, respectively, Mbol⋆ = −0.6 ± 0.5 (with a luminosity of 140 L☉) and Mbol⋆ = 0.0 ± 0.5 (with luminosity of 76 L☉), assuming Mbol☉ = +4.74 for the Sun (Bessel et al. 1998). These luminosities are too low to consider NGC 5822-2 and -201 as AGB stars that started shell helium burning (via thermal pulses) and became self-enriched in the neutron-capture elements. In fact, theoretical calculations show that in order to develop the first thermal pulse, the star's luminosity should be ≃ 1800 L☉ (Mbol = −3.4; Lattanzio 1986) or ≃ 1400 L☉ (Mbol = −3.1; Vassiliadis & Wood, 1993).
Since we know the distance of the cluster of NGC 5822, we can also compare the masses of these giants with the masses of the field barium stars. The masses of barium stars have already been determined in the literature. The determinations were made either by the available parallax or by placing them in log g–log Teff diagram with theoretical evolutionary tracks (Allen & Barbuy 2006; Antipova et al. 2003, 2004; Boyarchuk et al. 2002; Liang et al. 2003; Pereira et al. 2011; Smiljanic et al. 2007). In all these studies, the authors found that the masses of barium stars are in the range between 1.3 and 4.2 M☉. To date, the most complete analysis of the determination of the mass of barium stars is the work of Mennesier et al. (1997). There, the authors, using the Hipparcos parallaxes and based on the Lu (1991) catalog, showed from the absolute magnitude versus intrinsic color index diagram that the mass of barium stars is in the range between 1.25 and 7.0 M☉. However, some high values found for the mass of some barium stars should be viewed with caution since there are many stars in the Lu (1991) catalog that are not barium stars. As far as the two giants in NGC 5822 are concerned, their masses are also constrained by the cluster age and the turnoff mass. With a value of 2.1 M☉, (Section 3.2), we can see that they also lie in the same range of the field barium stars.
4.2. Abundance Pattern
4.2.1. Carbon, Nitrogen, and Oxygen
In Figure 6, we compare our CNO abundances obtained for NGC 5822-2 and -201 and HD 65314 with field giant stars analyzed by Mishenina et al. (2006) and Luck & Heiter (2007). We also included the [C/Fe] ratio for another barium star in the open cluster NGC 2420 from Smith & Suntzeff (1987). The [C/Fe] and [N/Fe] ratios for the field giants were computed using absolute abundances on the scale of log ε(H) = 12.0 obtained in these papers and then converted to [X/Fe] ratios using the solar abundances adopted in this work (Section 3.3). As seen in Figure 6, the [N/Fe] ratios for these two cluster giants have similar values of the giants analyzed by Mishenina et al. (2006) and Luck & Heiter (2007). Figure 6 also shows that nitrogen is overabundant with respect to the Sun in field giants as well as in NGC 5822-2 and -201 and in HD 65314. As a star becomes giant, due to deepening of its convective envelope, nuclear processed material is brought from the interior to the outer layers of the star, which changes the surface composition. As a consequence of the first dredge-up process, the abundance of 12C is reduced and the abundance of 14N is enhanced (Lambert 1981). Our results for the [N/Fe] ratio show the effects of the first dredge-up.
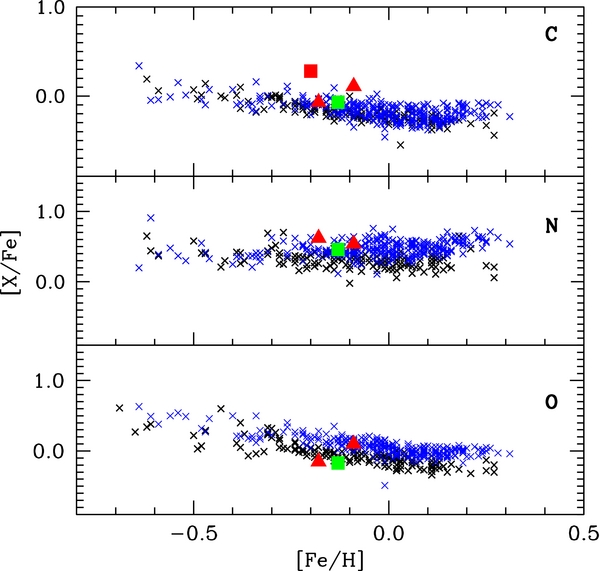
Figure 6. Chemical abundances of carbon, nitrogen, and oxygen given as a function of the metallicity for NGC 5822-2 and -201 (red triangles), NGC 2420-X (red square), and HD 65314 (green square). Blue crosses represent field giants of Luck & Heiter (2007), whereas black crosses the clump giants of Mishenina et al. (2006).
Download figure:
Standard image High-resolution imageWe updated the metallicity of the two barium stars of NGC 2420 as well as the carbon and the heavy-element abundances. Smith & Suntzeff (1987) derived a metallicity of −0.55 and −0.68, respectively, for stars D and X. These observations were made at lower resolution and with a spectral coverage of 200 Å. As was discussed in Jacobson et al. (2011), NGC 2420 could be more metal-rich than −0.57, as was earlier derived by Smith & Suntzeff (1987). In fact, the authors obtained a mean metallicity of −0.20, which we adopted for stars X and D to obtain the [X/Fe] ratios ([C/Fe] and the [s-process/Fe]) seen in Figures 6, 7, 10, and 11.
The [O/Fe] ratios of NGC 5822-2 and -201 and HD 65314 are similar to those seen in field giants. The [O/Fe] ratio was also computed based on an absolute abundance and then converted to the [X/Fe] ratio using the solar abundances adopted in Section 3.3. For this reason, there is an offset of −0.13 dex in the [O/Fe] ratio between Figure 6 in this paper and Figure 13 in Mishenina et al. (2006), who adopted a solar oxygen abundance of 8.70. Luck & Heiter (2007) adopted a solar oxygen abundance (8.81) similar to this paper's, and because of that our normalized [O/Fe] ratio is equal to the ratio derived by these authors.
Figure 7 shows the CNO abundances of our target stars with some previous determinations done for some barium giant stars (Barbuy et al. 1992; Allen & Barbuy 2006; Pereira & Drake 2009). Our derived [C/Fe] ratios are in good agreement with these previous analyses. The barium stars also shown the effects of the first dredge-up episode, since we also observed nitrogen enrichment. As far as oxygen is concerned, our [O/Fe] is also in agreement with these previous determinations in the barium giants.
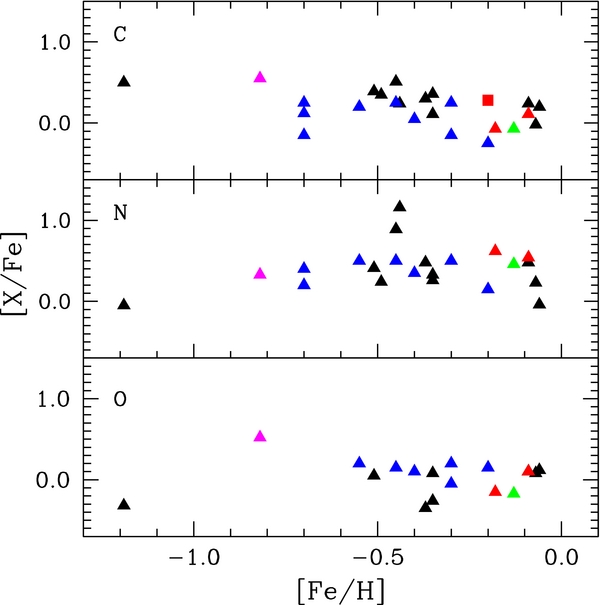
Figure 7. Chemical abundances of carbon, nitrogen, and oxygen given as a function of the metallicity for field barium stars from Barbuy et al. (1992, blue triangles), Allen & Barbuy (2006, black triangles), and the star HD 10613 from Pereira & Drake (2009, magenta triangle). Other symbols have the same meanings as in Figure 6 for the stars analyzed in this work and for NGC 2420-X.
Download figure:
Standard image High-resolution image4.2.2. Other Elements: Na to Ni
Sodium and aluminum, α-elements (Mg, Si, Ca, and Ti), and iron-peak elements (Cr and Ni) in NGC 5822-2 and -201 as well as in HD 65314 follow the general trend seen in the field giants analyzed by Luck & Heiter (2007). Figures 8 and 9 show the abundances of the above-mentioned elements for our studied stars.
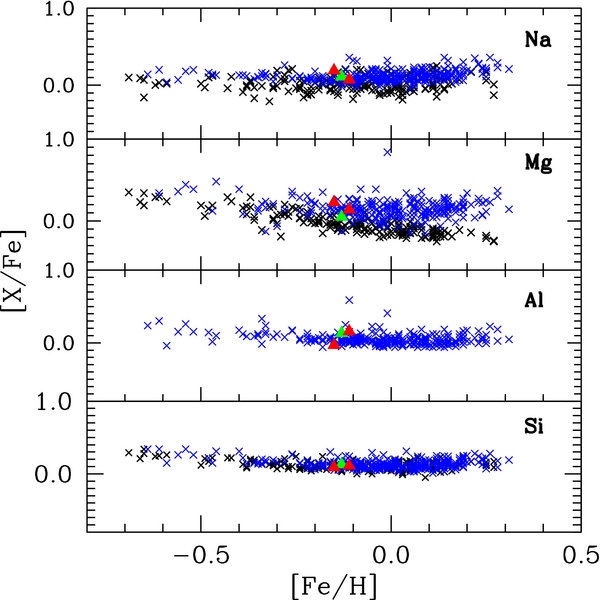
Figure 8. Abundance ratios [X/Fe] vs. [Fe/H]. Symbols have the same meanings as in Figure 6.
Download figure:
Standard image High-resolution image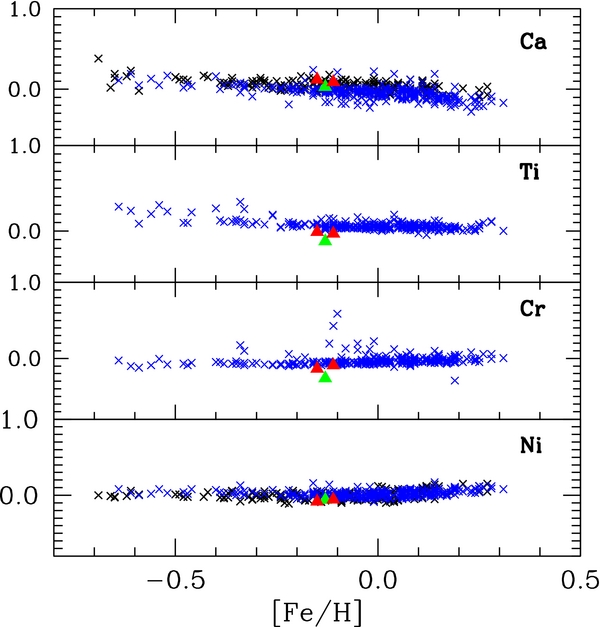
Figure 9. Abundance ratios [X/Fe] vs. [Fe/H]. Symbols have the same meaning as in Figure 6.
Download figure:
Standard image High-resolution image4.2.3. Heavy Elements: Neutron-capture Elements
Figure 10 shows the abundances of Y, La, Ce, and Nd for NGC 5822-2 and -201 as well as for the barium stars HD 65314 and NGC 2420-X and D (Smith & Suntzeff 1987). Clearly, these stars have higher abundances of these elements than field giants. This result is interesting because these differences are significant for the four elements. This fact is also noted at the bottom of Figure 10, where we also provide the mean abundance of these heavy elements, "s" in the notation [s/Fe]. We obtained [s/Fe] = 0.77 ± 0.12 and 0.83 ± 0.05, respectively, for NGC 5822-2 and -201. These values are not only much higher than the mean value for the field giants at similar metallicity ([s/Fe] ≈ 0.1 and [s/Fe] = 0.17 ± 0.12 for HD 2114), but also it is similar to the values found in other barium stars (as can be seen in Figure 11). For the barium star HD 65314, we have [s/Fe] = 0.74 ± 0.4. The abundance of zirconium (not shown in the figure) was also taken into account to calculate [s/Fe]; however, in the literature there are not many results for the zirconium abundance in field giants, except for barium stars (Antipova et al. 2005; Allen & Barbuy 2006; Smiljanic et al. 2007; Pereira et al. 2011).

Figure 10. Abundance ratios [X/Fe] vs. [Fe/H]. Symbols have the same meaning as in Figure 6 (red squares represent NGC 2420-X and -D). Among the local giants analyzed by Luck & Heiter (2007), only one barium star was spotted, HD 104979 (Začs 1994), which can be seen at [Fe/H] = −0.33 with [s/Fe] = +0.54.
Download figure:
Standard image High-resolution image
Figure 11. Abundance ratios [X/Fe] vs. [Fe/H] for field barium stars as a function of metallicity from Allen & Barbuy (2006, black triangles), Pereira et al. (2011, green triangles), and Smiljanic et al. (2007, blue triangles). Red squares represent the barium giants in NGC 2420. Green squares represent HD 65314 and red triangles represent NGC 5822-2 and -201.
Download figure:
Standard image High-resolution imageIn Figure 12, we show the relationship between the orbital period and the [s/Fe] for a sample of field barium stars. We used the available period data from Jorissen et al. (1998) and the [s/Fe] ratios from different sources of the literature. Unfortunately, there are not many barium stars with determined binary periods, but there is a trend of decreasing [s/Fe] ratio with increasing orbit period—although the scatter seen in this figure would mean that the separation of the stars in the system is not the only parameter that influences the observed overabundances (Jorissen et al. 1998). Dilution effects of the accreted material as well as the metallicity are also important. The star NGC 5822-2 with a period of 1000 days (Mermilliod et al. 1989) displays dynamics and overabundances similar to other field barium stars.

Figure 12. Relationship between the orbital period and mean s-process abundance of NGC 5822-2 (red cross) in comparison with a sample of field barium stars (black crosses). Orbital periods were taken from Jorissen et al. (1998). Heavy element abundances were taken from Allen & Barbuy (2006), Antipova et al. (2003, 2004), Kovacs (1985), Liang et al. (2003), Liu et al. (2009), Masseron et al. (2010), Smiljanic et al. (2007), Smith (1984), and Začs (1994).
Download figure:
Standard image High-resolution image
The previous determination of the heavy-element abundance in one of the cluster giant analyzed in this work, NGC 5822-2, was done by Luck (1994), who found [Zr/Fe] = 0.59, which is in good agreement with our results. For the [Nd/Fe] ratio, Luck (1994) found 0.19, which is different from our value of 0.80. This difference of results is probably related to the number of lines employed in the analysis. While our abundance ratio is based on eight lines, the result of [Nd/Fe] of Luck (1994) was based on a single line. Since Luck (1994) used a lower resolution than we used, this single line likely could be contaminated by transitions other than the Nd line.
We may speculate a few reasons why more than 20 yr have passed since the last discovery of a barium star in an open cluster. First, after 2008, when the large radial velocity survey of Mermilliod et al. (2008) was published, several new cluster giants were identified, thus allowing the study of new objects, some of which are binary systems. Second, another important point for the identification of barium stars in an open cluster is the determination of the heavy-element abundances. Few cluster giants have their heavy-element abundances determined; even when they are, the abundances were determined for one or two elements of the s-process based on a few lines (Maiorca et al. 2011). Therefore, with new high-resolution spectroscopic surveys to obtain the metallicities and abundances for giants in open clusters, other new barium stars will probably be discovered.
The discovery of these two barium stars in NGC 5822, and the two previously known in NGC 2420, raised another point for a comparison between the frequency of the barium stars to normal giants in field stars and in the cluster. In field stars, the percentage of barium stars is only 1 (MacConnell et al. 1972). In open clusters, the binary frequency of red giant spectroscopic binaries with periods less than 4000 days is 23% (Mermilliod & Mayor 1990). The barium star fraction, considering these two barium stars in NGC 5822 among 21 known giants and two in NGC 2420 among 22, is 10%, 10 times larger than that in the field stars.
5. CONCLUSIONS
Our abundance analysis employing high-resolution optical spectra of two giants in the open cluster NGC 5822 with the aim of obtaining their abundance pattern can be summarized as follows:
- 1.Stars NGC 5822-2 and NGC 5822-201 are two barium stars found in the open cluster NGC 5822. They have, respectively, a mean overabundance of the elements created by slow-neutron capture reactions, "s," with the notation [s/Fe] of 0.77 ± 0.12 and 0.83 ± 0.05, which is much higher than stars at similar metallicities. HD 65314, a barium star chosen as an s-process-enriched comparison star, has [s/Fe] = 0.74 ± 0.4. In addition, the luminosities of NGC 5822-2 and -201 are too low for them to be AGB stars and become self-enriched in the elements created by the s-process.NGC 5822-2 has already been proven as a binary star. Its radial velocity, due to orbital motion, has a systematic variation from −24.5 to −33.5 km s−1 (Mermilliod et al. 1989), which is consistent with the mean NGC 5822 radial velocity of −29.31 ± 0.18 (Mermilliod et el. 2008). The previously discovered barium stars in the open cluster NGC 2420, NGC 2420 X and D, have a systematic variation from 81 to 71 km s−1 and from 74 to 68 km s−1 (Mermilliod et al. 2007), respectively, which is also consistent with the mean NGC 2420 radial velocity of 73.57 ± 0.15 km s−1 (Mermilliod et al. 2008). Although NGC 5822-201 displays an enrichment of the elements created by the s-process and has already been classified as "SB" (Mermilliod & Mayor 1990), a confirmation of binary status is necessary and very desirable. NGC 5822-201 is probably in a very eccentric orbit where significant radial velocity variations would occur only in a small phase range like in the orbit of star HD 123949, which is seen in Figure 2 of Udry et al. (1998). Another possibility is that the orbit is pole-on.
- 2.Analysis of the light elements reveals that carbon abundances in NGC 5822-2 and -201 are similar as compared to those in barium stars previously analyzed and also with the barium star HD 65314. Nitrogen abundances show an enrichment similar to field giant stars and other barium stars. The oxygen abundances of NGC 5822-2 and -201 are also similar to those in the field giants as well as to those in other barium stars.
- 3.Thanks to the radial-velocity survey of Mermilliod et al. (2008), we were able to investigate a "large" sample of giant stars in the open cluster NGC 5822. NGC 5822 is the second open cluster to host barium stars.
This research used the SIMBAD database, operated at CDS, Strasburg, France.
Footnotes
- *
Based on observations made with the 2.2 m telescope at the European Southern Observatory (La Silla, Chile).