


ABSTRACT
According to the variation pattern of the solar magnetic field polarity and its relation to the relative sunspot number, we established the time series of the sunspot magnetic field polarity index and analyzed the strength and polarity cycle characteristics of the solar magnetic field. The analysis showed the existence of a cycle with about a 22-year periodicity in the strength and polarity of the solar magnetic field, which proved the Hale proposition that the 11-year sunspot cycle is one-half of the 22-year solar magnetic cycle. By analyzing the atmospheric temperature field, we found that the troposphere and the stratosphere in the middle latitude of both the northern and southern hemispheres exhibited a common 22-year quasicycle in the atmospheric temperature, which is believed to be attributable to the 22-year solar magnetic cycle.
Export citation and abstract BibTeX RIS
1. INTRODUCTION
The occurrences of sunspots are very regular and have been documented for a long time, and the relative sunspot number is commonly considered as an index of solar activity. Previous researchers (Hong 2000; Xu 1986; Wang 1964; Zhao 1996, pp. 84–89; Friis-Christensen & Lassen 1991; Eddy 1976, 1977; Kodera 2002; Bond et al. 2001; Ruzmaikin & Feynman 2002; Agnihtri et al. 2002) have firmly demonstrated the relation between solar activity and various geophysical phenomena, especially with droughts, floods, and weather variation.
Sunspots have magnetic poles that vary in a cycle of approximately 22 years. The magnetic field of the sunspots is thousands of times more powerful than the solar magnetic field. Most sunspot groups are dipoles consisting of a front and a back side along the approximately east–west directionality, which have reverse polarities and an approximately balanced magnetic current. The front side is closer to the equator than the back side and has a higher sunspot density, whereas the back side has a higher latitude and a more scattered sunspot distribution (Lin 2001) than the front side. Upon the switch of the 11-year cycle, the magnetic poles at 30°–50° latitude in the southern and northern hemispheres revert to the opposite pole. Therefore, concerning the variation in the magnetic pole, the periodicity of the sunspot magnetic field is 22 years (twice that of 11 years), also known as the Hale cycle.
Some researchers have shown that there is a correlation between the 22-year sunspot cycle and a number of atmospheric activities, such as the air circumfluence oscillation; the center intensity and the center location of air activity in 30°N–50°N; the spatial and temporal variations of the air pressure, temperature, and precipitation in the winter in the middle latitude; the frequency of obstructive high pressure; and drought in western America (Li 1995, pp. 52–53; Zhang 2000; Hou & Li 2000). The air temperature field variation in the stratosphere and troposphere also exhibits a prevailing cycle that is more evident at a higher altitude. The 1948–2000 air temperature data from the National Centers for Environmental Prediction (NCEP) show that a 22-year cycle is predominant in each layer of the stratosphere in the middle latitude of both the northern and southern hemispheres.
By analyzing the empirical orthogonal function of the 10-hPa potential altitude field in the global stratosphere, we found the existence of an obvious 22-year variation cycle in the first and second modes of the north and south pole oscillations, respectively (Qu et al. 2005). The 22-year cycle is more obvious in the fourth mode of 30°N–50°N and 30°S–50°S and reflects the symmetrical characteristics of the air activity in the middle latitude of the northern and southern hemispheres. The air system selectively responds to the 22-year variation cycle of the solar activity.
Clearly, there is a correlation between the prevailing 22-year cycle of the air system and the 22-year cycle of the solar magnetic activity. Although no clear theory has been established to directly illustrate this relationship, there is numerous research on abnormal geomagnetic and solar magnetic field variations that affect coronal mass ejections. There is also research in progress on the relationship between the abnormal magnetic field variation of the Earth and calamitous weather events.
The Earth is surrounded by solar radiation and particle current (solar wind); when combined, their power spectra determine the spatial environment around the Earth. The occurrence of the dazzle spot in the Sun can bring about a series of severe geophysical effects to the Earth. The solar dazzle spot ejects solar plasma consisting of plenty of low energy particles, each composed of equal quantities of electrons and protons. These particles arrive at the Earth three days after the occurrence of the dazzle spot and strike the magnetic layer and the ionosphere of the Earth to generate magnetic and ionospheric storms. On the other hand, a magnetic storm produced by the movement of such massive low energy particles could destroy the normal state of the geomagnetic field (Lin 2001).
Data have shown that high energy particles can cause the rapid increase of ionosphere absorption, significantly increase cosmic noise absorption, and increase geomagnetic disturbance. The corresponding special big magnetic storms occur on the surface of the Earth, which is closely related to the southward component of the interplanetary magnetic field, and indicate whether the interplanetary hydromagnetic wave contributed to the induction of the magnetospheric pulsation. During the main phase of the magnetic storm, the geomagnetism disturbance is largely increased, and the horizontal value of the polar geomagnetism changes with the southward component of the interplanetary magnetic field. The solar activity index correlates with the southward component of the interplanetary magnetic field, and the magnetic storm is controlled by the highly negative southward component of the interplanetary magnetic field. Satellite data have shown that the magnetic storm is stimulated by an interplanetary wave as well as the power transmitted from the solar wind to the magnetic layer. After the bow wave and the peak of the magnetic layer come through, the amplitude of the interplanetary disturbing magnetic field will increase five times. The rapid variation of the geomagnetic field with a large magnitude is a major source of spatial natural disaster. The Bz of the disturbing magnetic field is absorbed near 1 × 10⁻⁴ Hz. Based on the MIP-8 spaceship data and the geomagnetic activity index, most events are gone because the wind pressure of the Sun moves and the overall intensity of the magnetic field grows. Only when the interplanetary electric field intensity between morning and twilight is more than 5 mV m−1 will the magnetic storm and substorm occur at the same time. It has been argued that the space events in May 1998 correspond to the great magnetic storm from 1 May to 16 May. During the initial hours of the magnetic storm, there are plenty of Pc-type geomagnetic disturbances, and, during the recovery phase of the magnetic storm, there are even substantial Pc5-type disturbances. This magnetic storm is correlated with the electric field of the wind of the Sun.
Other research shows the abnormal variation of the geomagnetic field. The geomagnetic field permeates the Earth and exists in the centersphere—the crust, ocean, aerosphere, ionosphere, and the geomagnetic layer. The temporal and spatial variations of the geomagnetic field are informative and can alert professionals to natural disasters such as magnetic storms, magnetic substorms, and particle radiation. The rapid large variation in the magnitude of the geomagnetic field is a major source of spatial natural disaster. There is an increasing number of research on the relationship between the variation of the geomagnetic field and weather. It has been found that, when the geomagnetic field quickly changes, the weather in the Yellow River area and in northern China evidently varies. The weather is warm and wet with frequent flooding when the geomagnetic activity is relatively low, whereas drought frequently occurs when the geomagnetic activity is high. After a large magnetic storm, the abnormal P(z) can be noted in a large number of areas (>1000 km2, even across the globe) that correspond to global geophysical events.
To sum up, the solar activity affects the Earth's climate by delivering abnormal solar radiation variation and inducing abnormal geomagnetic field variation, both of which correlate with the magnetic field of the sunspot. The variation of the sunspot magnetic field includes the variation of the magnetic intensity and direction, and the latter is determined by the conversion of the magnetic pole.
2. MAGNETIC INDEX OF THE SOLAR MAGNETIC FIELD
The 22-year magnetic variation cycle of solar activity is correlated with many types of geophysical phenomena. However, this kind of magnetic variation is not mathematically well represented to allow the in-depth analysis of its relationship with such geophysical phenomena. Therefore, in this paper, we establish a sunspot magnetic field index from the relative sunspot number and construct the time series of the sunspot magnetic index.
The 11-year, natural sunspot activity cycle can be represented by the Maunder butterfly diagram (Shang et al. 2003). The cycle starts with a few sunspots that appear at latitude 30°–40°. The larger sunspot in the front of the sunspot group (the leading sunspot) constitutes the N pole, and the larger sunspot in the back of the sunspot group (the trailing sunspot) constitutes the S pole. At this time, the sunspot area is small and the magnetic field is weak. As both sunspots approach the equator, the sunspot area and the magnetic field increase. When the sunspots move to latitude 10°–20°, the sunspot number and area reach their maximum and the magnetic field becomes the greatest at this point. Afterward, the sunspot number and area and the magnetic field decrease each year. When they move to latitude 5°, the sunspots disappear and the magnetic field changes to 5 Ga of the initial magnetic field. Meanwhile, a small sunspot group appears at latitude 30°–40° with a reversed polarity, i.e., the leading and the trailing sunspots constitute the S and N poles, respectively. Thus, the sunspot polarity reverses and the cycle repeats again after another 11 years. Considering this variation in the magnetic polarity, the complete sunspot magnetic cycle is 22 years.
When the leading sunspot is the N pole, the relative sunspot number in latitude 30°–50° in the northern hemisphere is positive, and, when the leading sunspot is the S pole, the relative sunspot number is negative. The sequence of the relative sunspot number reflects the sunspot magnetic cycle. The sunspot relative number is referred to as the sunspot magnetic index and is expressed as Mi (magnetic index). The time series comprised of the sunspot magnetic index is referred to as the magnetic index time series of the sunspot magnetic field, which is expressed as Mi(i), where (i) is the sequence number.
All of the sunspots have a magnetic field. The greater the sunspot area, the more powerful the magnetic field becomes. The relationship of the greatest magnetic field of sunspot Bm and sunspot area S can be expressed by the following empirical equation:

The statistical equation between the annual average relative sunspot number and the annual average sunspot area was given by the Greenwich Observatory in 1874 (Department of Astronomy of Nanjing University 1964, pp. 308–315) as

By combining Equations (1) and (2), we can obtain the empirical equation between the greatest magnetic field of sunspot Bm and the annual average relative sunspot number R:

Although this equation is only empirical, it is obvious that the intensity of the solar magnetic field increases with the relative sunspot number. To some extend, the relative sunspot number reflects the variation of the intensity of the solar magnetic field. Therefore, the sunspot magnetic index series not only indicates the magnetic variation of the sunspot magnetic field, but it also indicates the variation of the solar magnetic field intensity.
Based on the 11-year sunspot cycle data from the Zurich Observatory, the first cycle began in 1755 February and ended in 1766 April with the N pole as the leading sunspot. The second cycle began in 1766 May and ended in 1775 April with the S pole as the leading sunspot. Therefore, the first sunspot magnetic cycle began in 1755 February and ended in 1775 April and lasted for two sunspot cycles (20 years, 3 months). Table 1 also shows other before-and-after magnetic cycles.
Table 1. List of Sunspot Magnetic Cycles
| Sequence | Start | Year of Maximum | Year of Maximum | Sequence | Start | Year of Maximum | Year of Maximum |
|---|---|---|---|---|---|---|---|
| Number | Year | N pole | S pole | Number | Year | N pole | S pole |
| −5 | 1619.0 | 1626.0 | 1639.7 | 4 | 1823.3 | 1829.9 | 1837.2 |
| −4 | 1645.0 | 1649.0 | 1660.0 | 5 | 1843.5 | 1848.1 | 1860.1 |
| −3 | 1666.0 | 1675.0 | 1685.0 | 6 | 1867.2 | 1870.6 | 1883.9 |
| −2 | 1689.5 | 1693.0 | 1705.5 | 7 | 1889.6 | 1894.1 | 1907.0 |
| −1 | 1712.0 | 1718.2 | 1727.5 | 8 | 1913.6 | 1917.6 | 1928.4 |
| 0 | 1734.0 | 1738.7 | 1750.3 | 9 | 1933.8 | 1937.4 | 1947.5 |
| 1 | 1755.2 | 1761.5 | 1769.7 | 10 | 1954.5 | 1957.9 | 1968.9 |
| 2 | 1775.5 | 1778.4 | 1788.1 | 11 | 1976.6 | 1979.7 | 1989.6 |
| 3 | 1798.3 | 1805.2 | 1816.4 | 12 | 1996.9 | 2000.7 | 2010.8 |
Download table as: ASCIITypeset image
During the 385 years from 1619 to 2003, the sunspot magnetic index went through 18 cycles with an average magnetic cycle of 22.2 years, but the length of each cycle was not equal (Table 1). Alternatively, the cycle lengths determined by the two maximum N poles and the two maximum S poles are different, indicating a drift in the relative locations of the maxima. The longest cycle determined by the two maximum N poles can reach 26 years and 10 months; the shortest is 17 years, whereas the longest cycle determined by the two maximum S poles can reach 28 years and 3 months, with the shortest being 18 years and 3 months. Clearly, the 22-year cycle is a statistical average and not a strict physical cycle. Figure 1 shows the yearly average magnetic index of the sunspot magnetic field. The intensity of the peaks substantially oscillates and the absolute value varies from 62.3 to 253.

Figure 1. Yearly average of the sunspot magnetic field index from 1700 to 2008.
Download figure:
Standard image High-resolution image3. 22-YEAR TEMPERATURE VARIATION CYCLE OF THE HIGH AIR IN 30°N–50°N
The grid data of the monthly average temperature field of the 17 global vertical layers in 1948–2000 are taken from the National Center for Atmospheric Research/NCEP. The horizontal resolution of the data is 2 5 × 25. Based on these data, we construct the time series of the monthly average temperature distance from sea level to 10 hPa in 30°N–50°N and 30°S–50°S.
We first evaluate the variation in air temperature at about 25 km in altitude in the 10-hPa isobar layer of the middle stratosphere at 30°N–50°N. Figure 2 shows the five-month smoothed average monthly air temperature at 25 km altitude in the 10-hPa isobar layer at 30°N–50°N from 1948 to 2000. From Figure 2 we can see that the air temperature has steadily increased since the 1940s, which is in agreement with the general tendency of global warming. The temperature increase is fit into the linear equation as
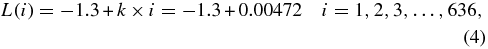
where −1.3 is the average temperature of early 1948, i is the time sequence number starting from 1948 March, and the slope of the line is k = 3/636 = 0.00472. Some researchers have argued that the rapid temperature surge in the 1980s and the 1990s resulted from an increase in human activity; thus, the rising temperature reflected the influence of human activity on the climate. To analyze the effect of the solar activity on the high air temperature, we remove the contribution of human activity to the temperature time series. Subtracting the climate tendency L(i) from the original temperature series t(i), we obtain the net temperature series y(i) as
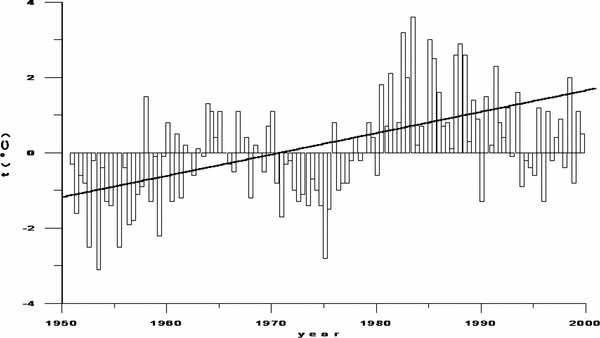
Figure 2. Histogram of the five-month smoothed average monthly air temperature of the 10-hPa isobar layer from 1950 to 2000 at 30°N–50°N. The solid line shows the linear fit of the temperature increase (L(i) = −1.3 + 3i/636).
Download figure:
Standard image High-resolution imageUsing the method described in Li (1995), we analyze the power spectrum of the temperature series y(i) and examine its significance. From Figure 3, we can see that the estimated temperature power spectrum of the 25-km high air at 30°N–50°N has two significant peaks. One peak is the 22-year cycle (264 months) and the other is at the 12-month cycle. The 12-month cycle is the yearly climate cycle and will not be discussed further. Based on the reference method described in Li (1995), we can obtain the amplitude A = 0.7542 and the initial phase angle θ = 3.14 + 1.3031 for the 22-year temperature cycle wave. The sine function of the wave is
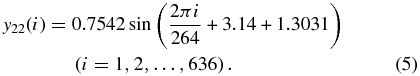
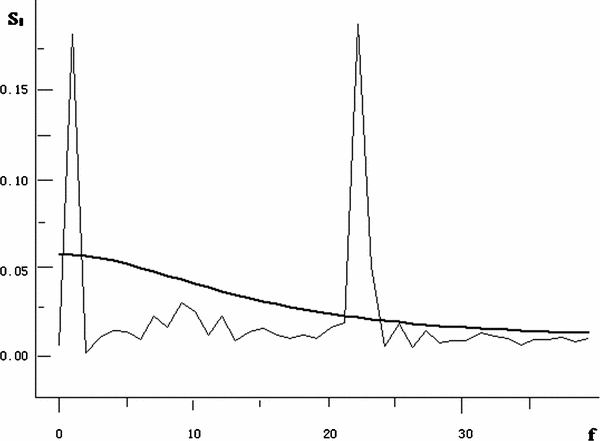
Figure 3. Estimated power spectrum and the checkout spectrum (bold solid line) of the 25-km high air at 30°N–50°N.
Download figure:
Standard image High-resolution imageIn Figure 4, the red line indicates the 25-km high air temperature series Y(i) that has excluded the temperature variation at 30°N–50°N. The blue line indicates the theoretical sine curve Y22(i) of the 22-year temperature cycle of the 25-km high air at 30°N–50°N. The theoretical sine curve of the 22-year temperature cycle depicts the periodic variation of the 25-km high air in the middle latitude of the northern hemisphere.
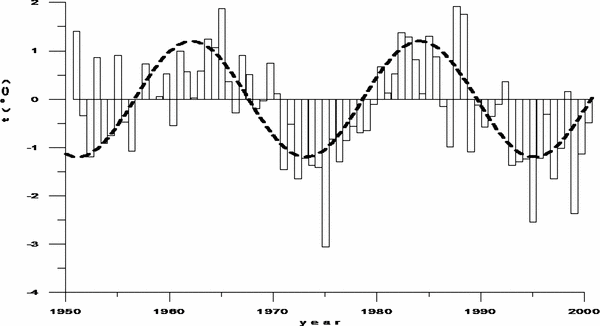
Figure 4. Histogram of the five-month smoothed average monthly temperature at the 10-hPa isobar layer and the theoretic temperature (dashed line) of the 264-month cycle from 1950 to 2000 in 30°N–50°N.
Download figure:
Standard image High-resolution imageIn Figure 5, the dotted line is the theoretical sine curve of the 22-year temperature cycle Y22(i), and the solid line is the five-month smoothed average sunspot magnetic index (the sunspot magnetic index value was divided by 150 to scale the curve to the appropriate unit). From Figure 5, we can see that the 10th magnetic cycle (1954 May to 1976 May), the 11th magnetic cycle (1976 June to 1996 September), and the 12th magnetic cycle (1996 October to 2008 August) had both maximum N peak values in the solar magnetic index and peak temperature value in the 22-year cycle. The ninth magnetic cycle (1933 August to 1954 April), the 10th magnetic cycle (1954 May to 1976 May), and the 11th magnetic cycle (1976 June to 1996 September) had a maximum S bottom value in the solar magnetic index and a bottom temperature value in the theoretical temperature curve. The peak and bottom values of the solar magnetic cycle slightly exceeded the peak and bottom values in the temperature curve. This is because the magnetic index reaches the maximum N and S values rapidly from 0 and then slowly falls back to 0 from the N and S maximum values.
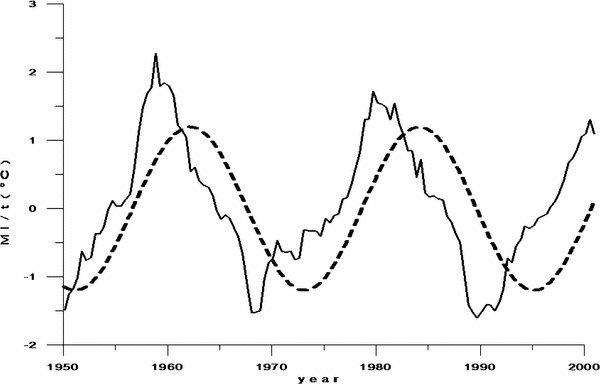
Figure 5. Sunspot magnetic index curve (index value divided by 150; solid line) and the monthly theoretic average temperature curve at the 10-hPa isobar layer (dashed line) of the 264 months from 1950 to 2000 in 30°N–50°N.
Download figure:
Standard image High-resolution imageWe calculate the lag correlation function of the temperature and the magnetic index to evaluate the degree of correlation between them. The correlation coefficients of the temperature lagging the solar magnetic indices 0 through 11 are 0.871, 0.876, 0.880, 0.883, 0.886, 0.889, 0.891, 0.893, 0.8941, 0.8943, 0.8942, 0.8941, respectively. These high correlation values indicate that the solar magnetic index has a close relationship with the 22-year cycle of the high air temperature in the middle latitude of the northern hemisphere.
The correlation value is largest when the temperature lags behind the magnetic index, indicating that the solar activity occurs nine months ahead of the variation in air temperature. Because the solar magnetic index is in accord with the high air temperature variation in the 22-year cycle in the middle latitude of the northern hemisphere, and because of the characteristic of this correlation function, it can be inferred that the 22-year cycle of the high air temperature variation is induced by the periodic variation of the sunspot magnetic field. This law in high air temperature variation provides us with the basic theory to forecast the climate. Therefore, we can use the linear regression equation to express the relationship between the solar magnetic index Mi(i) and the 22-year temperature cycle T22(i) in the 10-hPa isobar layer of the northern hemisphere:

where the regression coefficients a and b can be determined by the theory of least multiplication as follows.
Because the data we used are the average errand values, the constant item a = 0 and the regression coefficient b = 0.737. The regression equation then becomes

Equation (6) depicts the linear relationship between the sunspot magnetic index and the temperature variation in the 10-hPa isobar layer at 30°N–50°N. Based on Equation (6), using the monthly average sunspot magnetic index, we calculated the monthly average temperature errand curve (dashed line) and the theoretical monthly average temperature cycle curve (dotted line) in the 10-hPa isobar layer at 30°N–50°N from 1948 to 2000 (Figure 6). From Figure 6, we can see that the predicted values agree well with the actual data, indicating that the regression equation can reliably account for the inherent relation between the solar activity and the abnormal temperature variation of the high air in the middle latitude of the northern hemisphere.

Figure 6. Monthly average temperature curve (dashed line) of the 10-hPa isobar layer and the 264-month cycle curve calculated by the regression equation using the monthly sunspot magnetic index (histogram; index value divided by 150) from 1950 to 2000 in 30°N–50°N.
Download figure:
Standard image High-resolution image
4. UNIVERSAL 22-YEAR TEMPERATURE VARIATION CYCLE OF THE HIGH AIR IN THE NORTHERN AND SOUTHERN HEMISPHERES
Using the same method, we analyze the air temperature spectra of eight layers, from sea level at 1000 hPa to about 25 km in the middle stratosphere at 10 hPa, in 30°N–50°N and 30°S–50°S. The results show that in each layer there is a distinct variation cycle in accordance with the 22-year solar magnetic cycle, indicating that the 22-year (264 months) solar magnetic cycle has a global influence on the Earth's atmosphere.
We also calculated the magnitude of the oscillation in the 22-year cycle of each layer (Table 2), which represents the extent of the air temperature oscillation induced by the solar activity. Table 2 clearly shows the magnitude of the oscillation becomes larger at a higher altitude, which indicates that the solar magnetic variation has a greater influence on the high air than on the low layer. In the high air, the magnitude of the oscillation is greater in the middle latitude of the northern hemisphere than in the southern hemisphere. In the low layer, the magnitude of the oscillation in the southern hemisphere is greater than in the northern hemisphere. This indicates that the solar magnetic variation has different effects on the air temperature in the middle latitude of the southern and northern hemispheres.
Table 2. Magnitude of Oscillation of the 22-Year Cycle in Each Layer at 30°N–50°N and 30°S–50°S (Unit: °C)
| Layer Hemisphere | 10 hPa | 20 hPa | 50 hPa | 70 hPa | 100 hPa | 300 hPa | 500 hPa | 1000 hPa |
|---|---|---|---|---|---|---|---|---|
| Northern | 0.754 | 0.804 | 0.491 | 0.479 | 0.418 | 0.067 | 0.027 | 0.069 |
| Southern | 0.560 | 0.721 | 0.328 | 0.266 | 0.150 | 0.122 | 0.073 | 0.084 |
Download table as: ASCIITypeset image
5. SUMMARY
Based on the relative sunspot number, we established the time series of the sunspot magnetic index. We then determined the tendency of the rising temperature in the high air at the stratosphere in the middle latitude of the northern hemisphere and removed it from the time series of the sunspot magnetic index. The variation of the atmospheric temperature clearly showed a pervasive 22-year cycle in the stratosphere and the troposphere at the middle latitude of the northern and southern hemispheres. Based on this analysis, it is believed that the 22-year atmospheric temperature variation cycle is caused by the 22-year solar magnetic activity cycle.
This work is funded by the Global Change Research Program of China (2010CB951403) and the National Science Foundation of China (40875041).