


ABSTRACT
We correct errors in our comparisons of model results with observations and fix typographical errors in mathematical expressions for the accretion time. Reanalyzing the observations leads to new values for the target slope of the cumulative size distribution for large objects as a function of the slope of the power-law relation between albedo and radius. Despite these changes, the analysis still strongly prefers models where trans-Neptunian objects grow from an initial population of small (1–10 km) planetesimals.
Export citation and abstract BibTeX RIS
1. INTRODUCTION
In Kenyon & Bromley (2012), we investigated whether coagulation models of planet formation can explain the observed size distributions of trans-Neptunian objects (TNOs) and Kuiper Belt objects (KBOs). We combined new and previously published calculations to derive robust relations between the slope of the cumulative size distribution of large objects and the size of the largest object as a function of initial disk mass, initial planetesimal size, and fragmentation parameters. Comparisons with observations favor models starting with small (1–10 km) planetesimals. Here, we correct an error in our analysis.
2. FORMATION TIME
In the third paragraph of Section 4.3 and item 2 of Section 5, the correct expression for the formation time should be tf∝xma3, where xm is the disk mass in units of the minimum mass solar nebula and a is the semimajor axis.
3. TARGET SLOPES
In Equation (10) of Kenyon & Bromley (2012), the correct expression for the relationship between the slope q of the cumulative size distribution, the slope α of the cumulative sky surface density as a function of magnitude, and the slope β of the distribution of albedo ν as a function of radius r (ν∝r−β) is (Fraser et al. 2008)

Observations of KBOs suggest α ≈ 0.80 for cold KBOs and α ≈ 0.40 for hot KBOs. Thus, q ≈ 4(1 − β/2) (cold KBOs) and q ≈ 2(1 − β/2) (hot KBOs). For β = 0, the observations imply cumulative size distributions with q ≈ 2 (hot KBOs) and q ≈ 4 (cold KBOs) not the q ≈ 3 and 5 used in Figures 14 and 15 of Kenyon & Bromley (2012).
To compare numerical simulations with observations, we construct plots of the "success fraction," the fraction of models that match a target slope as a function of the maximum size rmax of a KBO in each dynamical class. We adopt an error in the target slope of ±0.25 and consider three choices for the maximum radius—log rmax = 2.80 ± 0.05, 3.00 ± 0.05, and 3.15 ± 0.05—which span the range of maximum sizes for known KBOs.
Figures 1–4 show success fractions as a function of the initial disk mass, xm, and the initial maximum size of a planetesimal, r0. Figures 1 and 3 are new; Figures 2 and 4 repeat Figures 14 and 15 from Kenyon & Bromley (2012). The figures are appropriate for observations of hot KBOs with β = 0 (q = 2, Figure 1), β = −1 (q = 3, Figure 2), β = −2 (q = 4, Figure 3), and β = −3 (q = 5, Figure 4). The last two figures are appropriate for cold KBOs with β = 0 (q = 4, Figure 3) and β = −0.5 (q = 5, Figure 4). All together, the four figures more than span the range of plausible values for α (Levison & Stern 2001; Bernstein et al. 2004; Fuentes & Holman 2008; Fraser et al. 2010; Fuentes et al. 2011; Sheppard et al. 2011) and β (e.g., Stansberry et al. 2008; Brucker et al. 2009) as a function of the size and dynamical class.
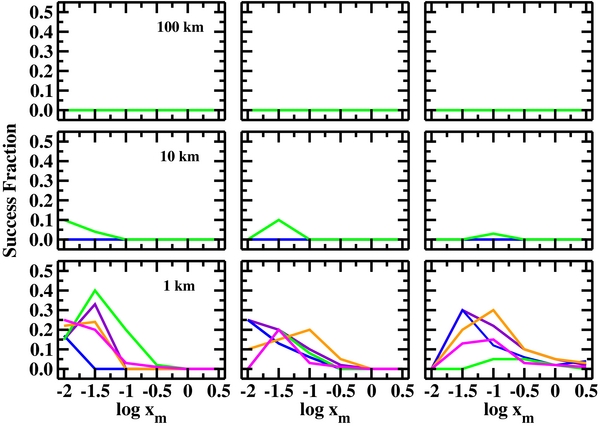
Figure 1. Fraction of calculations that achieve a target slope q4 = 2 ± 0.25 and maximum size log rmax = 2.80 ± 0.05 (left panels), log rmax = 3.00 ± 0.05 (middle panels), or log rmax = 3.15 ± 0.05 (right panels) as a function of the initial disk mass (xm). In each panel, the legend indicates r0. Colored lines show results for different starting conditions; violet: a = 15–75 AU; nc∝r−0.5, fw fragmentation parameters; blue: a = 30–150 AU; nc∝r−0.5, fw fragmentation parameters; green: a = 30–150 AU; nc∝r−3, fw fragmentation parameters; orange: a = 30–150 AU; nc∝r−3, fs fragmentation parameters; magenta: a = 30–150 AU; nc∝r−3, fvs fragmentation parameters. For r0 = 1 km (lower panels), any range of a, xm = 0.01–0.1, and all fragmentation parameters, 10%–30% of the calculations achieve the target slope and maximum radius; the success rate depends weakly on rmax. Larger initial disk masses with xm = 0.1–3 have success rates of 10% or less; the success rate grows modestly with rmax. For r0 = 10 km (middle panels), less than 10% of calculations with small initial disk masses (xm ≲ 0.1)—but none of the calculations with larger disk masses (xm ≳ 0.1) reach the target; the success rate falls with increasing rmax. For r0 = 100 km (upper panels), none of the calculations reach the target.
Download figure:
Standard image High-resolution image
Figure 2. Same as Figure 1 for a target slope q4 = 3 ± 0.25 (this figure repeats Figure 14 of Kenyon & Bromley (2012)). For r0 = 1 km (lower panels), any range of a, most initial disk masses, and all fragmentation parameters, 20%–50% of the calculations reach the target slope and maximum radius; the success rate increases with larger rmax. For r0 = 10 km, calculations with small disk masses (xm ≲ 0.3) reach the target; other calculations fail. For r0 = 100 km, none of the calculations match the target. In all calculations with r0 = 10–100 km, the success rate grows with increasing rmax.
Download figure:
Standard image High-resolution image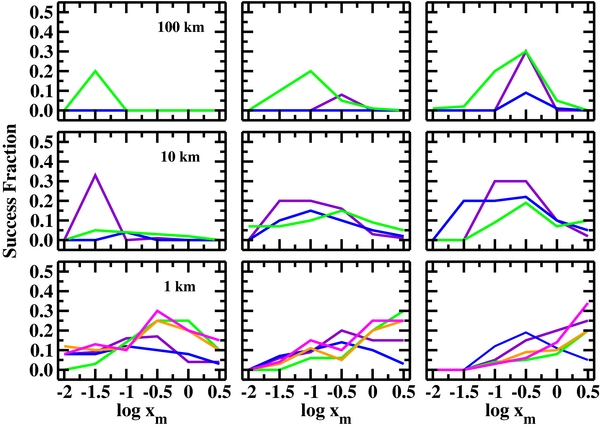
Figure 3. Same as Figure 1 for a target slope q4 = 4 ± 0.25. For r0 = 1 km (lower panels), any range of a, most initial disk masses, and all fragmentation parameters, 20%–30% of the calculations reach the target slope and maximum radius; the success rate is independent of rmax. For r0 = 10 km, calculations with a range of disk masses (xm ≳ 0.03) reach the target at rates of 10%–20%. For r0 = 100 km (upper panels), 20% of calculations with intermediate disk masses (xm ≈ 0.1–1)—but very few of the calculations with smaller disk masses (xm ≲ 0.1) reach the target; the success rate is independent of rmax.
Download figure:
Standard image High-resolution image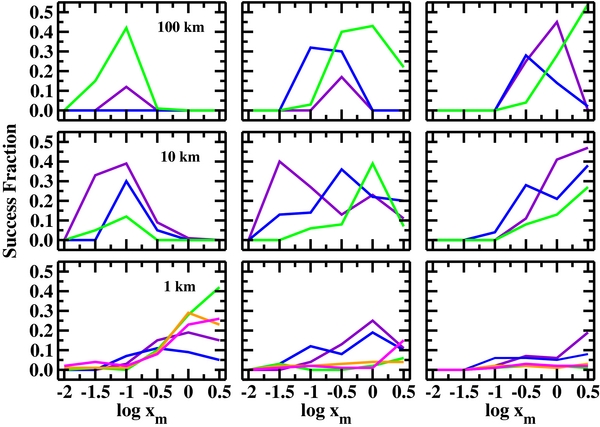
Figure 4. Same as Figure 1 for a target slope q4 = 5 ± 0.25 (this figure repeats Figure 15 of Kenyon & Bromley (2012)). For r0 = 1 km (lower panels), any range of a, most initial disk masses, and all fragmentation parameters, 10%–30% of the calculations achieve the target slope and maximum radius; the success rate decreases slowly with rmax. For r0 = 10 km (middle panels) and r0 = 100 km (upper panels), 20%–50% of calculations with intermediate disk masses (xm ≈ 0.1–1) reach the target; the success rate at large (small) disk masses increases (decreases) slowly with rmax.
Download figure:
Standard image High-resolution image
Combined with constraints on the formation time, Figures 1 and 2 suggest that hot KBOs with rmax ≈ 1400 km formed from an ensemble of small planetesimals. Aside from a very small success fraction at xm = −1 in Figure 2, no model with 100 km planetesimals (upper panels in the figures) matches the target slopes for β = −1 to 0. For small disk masses, xm ≲ 0.1, calculations with 10 km planetesimals (middle panels in the figures) match the target 10%–30% of the time. Smaller β results in larger success fractions. However, calculations with 10 km planetesimals fail to form 1000 km objects in 600 Myr or less (Kenyon & Bromley 2012). For 1 km planetesimals (lower panels in the figures), models with β = −1 (Figure 2) are more successful than models with β = 0 (Figure 1). Successful models with β = 0 require small disk masses, which are precluded by the time formation constraint.
For β = −2 to −3 (Figures 3 and 4), these trends continue. Smaller and smaller β results in larger success fractions for calculations starting with 10–100 km planetesimals and somewhat smaller success fractions for calculations starting with 1 km planetesimals. Constraints on the formation time preclude models with (1) 100 km planetesimals and xm ≲ 0.3 and (2) 10 km planetesimals and xm ≲ 0.1. These constraints rule out models starting with 10–100 km planetesimals when β = −2 and q = 4. Thus, hot KBOs with β = −2 strongly favor models with large disk masses and small planetesimals. For the smallest β = −3 (q = 5), models starting with 10–100 km planetesimals are more successful than models with small planetesimals.
Given the range of β currently favored by observations of hot KBOs (β ≈ −1 to −2), the most successful coagulation models for hot KBOs with α ≈ 0.4 and rmax ≈ 1000–1400 km have large disk masses and small planetesimals. If β is less than −2, our results suggest models with large planetesimals. Current observations appear to preclude this option.
Results for cold KBOs suggest a broader range of possibilities. The largest cold KBOs are smaller than the largest hot KBOs. Constraints on the formation time favor models with large disk masses. Thus, we concentrate on results for xm ≳ 0.3 in the left panels of Figures 3 and 4. Although results for β = 0 have success fractions of 10%–30% for any r0; models with r0 = 100 km require a more restricted set of fragmentation parameters than models with r0 = 1–10 km. As β decreases, models with large r0 and large xm have smaller and smaller success fractions. For r0 = 1 km, calculations with almost any massive disk match the observations for all β.
4. SUMMARY
Correcting an error in relating the target slope q to observational constraints on α and β yields a new set of success ratio plots for coagulation calculations of TNOs. Analysis of these plots leads to the same conclusion as in the original manuscript: the observed size distributions strongly favor models where KBOs grow from small planetesimals.
We thank E. Chiang for pointing out the error in Equation (1) in the published version of this paper and for comments on this manuscript. Discussions with W. Fraser clarified the derivation of Equation (1) and helped us to revise the analysis of success fractions.