


ABSTRACT
We present a comprehensive study of young stellar populations in six dwarf galaxies in or near the Local Group: Phoenix, Pegasus, Sextans A, Sextans B, WLM, and NGC 6822. Their star-forming regions, selected from GALEX wide-field far-UV imaging, were imaged (at sub-pc resolution) with the WFPC2 camera on board the Hubble Space Telescope (HST) in six bandpasses from far-UV to I to detect and characterize their hot massive star content. This study is part of HST treasury survey program HST-GO-11079; the general data characteristics and reduction procedures are detailed in this paper and results are presented for the first six galaxies. From a total of 180 HST images, we provide catalogs of the multi-band stellar photometry and derive the physical parameters of massive stars by analyzing it with model-atmosphere colors. We use the results to infer ages, number of massive stars, extinction, and spatial characteristics of the young stellar populations. The hot massive star content varies largely across our galaxy sample, from an inconspicuous presence in Phoenix and Pegasus to the highest relative abundance of young massive stars in Sextans A and WLM. Albeit to a largely varying extent, most galaxies show a very young population (a few Myrs, except for Phoenix), and older ones (a few 107 years in Sextans A, Sextans B, NGC 6822, and WLM, ∼108yr in Phoenix and Pegasus), suggesting discrete bursts of recent star formation in the mapped regions. The hot massive star content (indicative of the young populations) broadly correlates with the total galaxy stellar mass represented by the integrated optical magnitude, although it varies by a factor of ∼3 between Sextans A, WLM, and Sextans B, which have similar MV. Extinction properties are also derived.
Export citation and abstract BibTeX RIS
1. INTRODUCTION
The Local Group of galaxies offers our best opportunity to study stellar evolution and star formation, its modalities and regulating factors, and its interplay with dust in a wide variety of environments and characteristics, such as galaxy type, metallicity (spanning ∼2 dex), gas density, interactions, and star formation history. The vicinity of the galaxies allows Hubble Space Telescope (HST) imaging to resolve individual stars and large telescopes in space and from the ground to obtain spectroscopy of the brightest members. At the same time, the study of entire stellar populations at a single, known distance allows global pictures to be gathered, useful to place constraints on stellar and galaxy evolution.
The HST spatial resolution, combined with a broad wavelength range and access to UV wavelengths, enables in particular a better characterization of the youngest, most massive hot stars, to whose high Teffs optical colors alone are not sensitive, and which tend to crowd in compact regions (e.g., Bianchi et al. 2001b; Bianchi & Efremova 2006; Massey et al. 2007; Hodge et al. 2011; Kang et al. 2009; Bianchi 2007).
GALEX 5 wide-field imaging in two UV bands, and especially in the far-UV, provided an unprecedented snapshot of the SF sites across nearby galaxies (e.g., Bianchi 2011 and references therein; Kang et al. 2009; Gil de Paz et al. 2007; Thilker et al. 2005, 2007b; Bianchi et al. 2005; Calzetti et al. 2005; Hunter et al. 2010), unconfused by older populations that contribute light at optical and IR wavelengths but are inconspicuous in the far-UV. Great sensitivity to even small star formation rates is afforded by imaging in far-UV, where the flux of young massive stars amounting, e.g., to as little as a few percent of the mass of an entire galaxy can be easily detected (e.g., Marino et al. 2011; Thilker et al. 2007a).
We combined the advantages of the two instruments and performed HST imaging in six bands, from the far-UV to IR, of conspicuous SF sites in eight Local Group galaxies, selected from GALEX wide-field far-UV imaging.
Dwarf galaxies are especially relevant both for understanding stellar evolution and in the cosmology context. They are very numerous, and in the hierarchical formation scenario, they represent the basic building blocks of larger galaxies and augment their halos (e.g., Ibata et al. 2002). They typically have low metal content, providing a laboratory for testing star formation and evolution in conditions more common in earlier epochs of the universe. Those in our vicinity provide a window into these conditions and the key to interpret large samples seen at increasing redshifts with less details (e.g., Weisz et al. 2011b). Finally, it is important to understand the efficiency of metal enrichment of the interstellar medium (ISM) through the yield of stellar nucleosynthesis products, which may differ between large spirals such as the Milky Way (MW) or Andromeda (M31), and low-mass galaxies where the shallow gravitational potential well may allow dust to escape through supernova-induced bubbles, reducing cosmic recycling. Does the low metallicity observed in nearby dwarfs indicate that they never formed much stars, or have they been forming stars without efficiently enriching the galaxy ISM (see, e.g., Tolstoy et al. 2009 and references therein)? More differences are intriguing: in large spirals, a robust relation has been observed between gas surface density and star formation rate (Kennicutt 1998; Roychowdhury et al. 2009), but it does not hold for dwarf galaxies (e.g., Lee et al. 2009; Wyder et al. 2009; Bianchi et al. 2011c and references therein). But then again, the association of gas reservoirs with low-mass dwarfs is also not always clear (e.g., Figure 7 of Bianchi et al. 2011c). In the dIr/dSph galaxy Phoenix, the nearby gas cloud, first mapped by Young & Lo (1997) and St-Germain et al. (1999), is believed to be still gravitationally associated with the galaxy (its velocity being consistent with that of the galaxy's stars), and to have been expelled from the main galaxy body by supernovae's winds in a recent (<100 Myr) star formation episode, according to Young et al. (2007).
To unravel the contribution of dwarf galaxies to the chemical evolution of the universe and their star-formation histories, we need to study both old and young stars and measure the metal content of stellar and gas components. For the Local Group dwarfs, metallicity measurements are mostly confined to old stars. In the review by Mateo (1998) we find the mean iron abundances [Fe/H], for old and intermediate age populations, to range from one-tenth to one-hundredth of the solar value in our sample galaxies. Including more recent derivations, we find [Fe/H] = −1.9 in Phoenix (Ortolani & Gratton 1988; van de Rydt et al. 1991; −1.85 from Held et al. 1999) and Sextans A (Dohm-Palmer et al. 1997), [Fe/H] = −1.5 to −1.27 dex in WLM (Minniti & Zijlstra 1996; Lee et al. 1993; Leaman et al. 2009), to [Fe/H] = ∼ − 1.2 in Sextans B (Tosi et al. 1991) and NGC 6822 (Lee et al. 1993; Gallart et al. 1996a, 1996b), to [Fe/H] = −1 in Pegasus (Aparicio & Gallart 1995; Aparicio et al. 1997).
For relatively younger stars, measurements are scarcer. Venn et al. (2003) find [Fe/H] = −0.38 from UVES optical spectra of two A-type supergiants in WLM. Kaufer et al. (2004) derive iron group abundances of −0.99, −0.04, and −0.06 from UVES spectra of three A-type supergiants in Sextans A; Muschielok et al. (1999) derived [Fe/H] = −0.49 ± 0.22 for three B-type supergiants in NGC 6822, and Venn et al. (2001) derived [Fe/H] = −0.50 ± 0.20 from spectra of two A-type supergiants in this galaxy. Overall, differences emerge by factors from 3 to 10, within the same galaxy, based on the few existing measurements.
As for the O/H ratio in the gas and in stellar atmospheres, results vary by factors of a few among different regions in the same galaxy, see, e.g., Kniazev et al. (2005) for Sextans B. These authors find for PN in Sextans B 12+log(O/H)=7.47 ± 0.16, consistent with that of the low-metallicity H ii regions, but for PN in Sextans A they find 12+log(O/H) = 8.02 ± 0.05, higher than the average 12+log(O/H) = 7.54 value found for three H ii regions. Saviane et al. (2009) find [O/H] = −0.46 and [Ar/H] = −1.03 for the one PN known in Phoenix, for which they infer an evolutionary age of ⩾2 Gyr, and estimated the ISM metallicity z = 0.002–0.008, i.e., one tenth or more of the solar value.
Our focus is the characterization of the youngest populations through the identification and measurement of the hottest, most massive stars. Our program aims at answering a number of scientific questions from these data alone and with complementary observations, including understanding how stars are formed in clusters and associations, and how the modalities of SF depend on environment conditions, exploring the high-mass portion of the mass function (MF) in varying environments (e.g., Massey 2003) and selecting reliable candidates for follow-up UV and optical spectroscopy, to derive much-needed abundances for younger stars, and mass loss rates over a wide metallicity range. The ensemble of derived stellar parameters and the massive star content for each galaxy and its individual SF sites will also be a stepping stone for calibrating star-formation rate (SFR) indicators from integrated measurements, available for these galaxies from GALEX in the UV (Bianchi et al. 2011c), from Spitzer in the IR (e.g., Calzetti et al. 2010), from the CTIO/KPNO survey (Massey et al. 2007, hereafter LGGS) in Hα, and from HST and ground-based surveys for hundreds of more distant galaxies. The identification of the hottest stars will also enable interpretation of the existing emission-line maps (Hα, [O iii], and [S ii]) for these galaxies. Imaging over a wavelength range including the UV also allows us to derive ages and masses for young stellar clusters, which will be presented for the remaining galaxies from this program in forthcoming papers, following the works by Hodge et al. (2010, 2011) in M31.
In this paper, we describe the observation strategy for the whole program (Section 2) and photometric measurement procedures in detail (Section 3), and present the multi-band photometry catalogs (Section 3.4) for the first six galaxies, Local Group dwarfs showing varying degrees of current or recent star formation. We analyze the photometry with stellar models to derive physical stellar parameters and interstellar extinction in Section 4; we discuss the results of the massive star content in Section 5. Section 6 summarizes the work presented and compares results across the sample and outlines future work.
2. HST IMAGING
Six Local Group galaxies, NGC 6822, Pegasus, Phoenix, Sextans A, Sextans B,6 and WLM (Table 1) were observed with HST/WFPC2 as part of treasury program HST-11079, PI: L. Bianchi. The program, for a total of over 800 HST images, also included several fields in M31 and M33, which will be published in a subsequent paper. Imaging in six broadband filters (F170W, F255W, F336W, F439W, F555W, F814W) was acquired at every pointing to provide multi-band photometry which would allow us to determine simultaneously the stellar temperatures and extinction by interstellar dust. Two orbits were spent on each pointing, with exposure times chosen to achieve a uniform depth in all filters for the hot massive stars. Specifically, the F336W, F439W, and F555W (circa UBV) exposures aimed at reaching a uniform signal-to-noise ratio (S/N) ≈ 75 for a B0V star with V = 20, E(B − V) = 0.25; the exposure in F170W (1200 s) aimed at an almost similar S/N for an O5 star with V = 19.5, E(B − V) = 0.25 (but obviously yields a lower S/N for later-type, cooler stars). Exposures in F255W aimed at reaching slightly less depth for stars earlier than O5, due to time constraints, but provide similar S/N for late-O types; they proved extremely useful, when combined with U and far-UV band measurements, for determining extinction, in all cases, and for alleviating the Teff/extinction degeneracy for hot stars (Section 4). Our analysis shows that our goals were met or exceeded. Two exposures with each filter were taken at every pointing, to allow removal of cosmic rays, yielding a total of 180 images at 15 pointings for these six galaxies, out of a total of over 800 HST images. Details of the data sets are given in Table 2.
Table 1. The Sample Galaxies
| Galaxy | Distancea | Type | D25 | Area Covered | MV |
|---|---|---|---|---|---|
| (kpc) | (arcmin) | by WFPC2 | (mag) | ||
| (arcmin2)/(kpc2) | |||||
| Phoenix | 406. ± 13. (1) | dIrr/dSph | 4.9 × 4.1 | 5.78/0.10 | −10.1 |
| Pegasus | 919. ± 30. (2) | IAm | 5.0 × 2.7 | 5.78/0.41 | −12.8 |
| Sextans A | 1320. ± 40. (3) | IBm | 5.9 × 4.9 | 11.6/2.04 | −14.5 |
| Sextans B | 1370. ± 180. (4) | ImIV-V | 5.1 × 3.5 | 5.8/0.88 | −14.2 |
| WLM | 978. ± 20. (5) | IB(s)m | 11.5 × 4.0 | 15/1.10 | −14.6 |
| NGC6 822 | 460. ± 5. (6) | IB(s)m | 15.5 × 13.5 | 40/0.73 | −15.1(−16.0) |
Note. aReferences for the distances: (1) Held et al. 1999; (2) McConnachie et al. 2005; (3) Dolphin 2003; (4) Sakai et al. 1997; (5) Gieren et al. 2008; (6) Gieren et al. 2006.
Download table as: ASCIITypeset image
Table 2. HST Observations
| Galaxy | Visita | Target Name | File Name | α (J2000.0) | δ (J2000.0) | Offsetb ('') Δα, Δδ |
|---|---|---|---|---|---|---|
| NGC 6822 | 09 | NGC6822-FIELD1 | U9WQ09 | 19 44 30.92 | −14 42 12.6 | −0.05, +0.3 |
| 10 | NGC6822-FIELD2 | U9WQ10 | 19 44 31.42 | −14 44 39.1 | −0.30, +0.25 | |
| 11 | NGC6822-FIELD3 | U9WQ11 | 19 44 52.42 | −14 52 39.3 | −0.02, −0.70 | |
| 12 | NGC6822-FIELD4 | U9WQ12 | 19 44 54.92 | −14 47 02.4 | −0.20, −0.40 | |
| 13 | NGC6822-FIELD5 | U9WQ13 | 19 44 45.92 | −14 44 50.4 | −0.23, −0.40 | |
| 14 | NGC6822-FIELD6 | U9WQ14 | 19 45 05.18 | −14 55 26.6 | −0.20, −0.35 | |
| 15 | NGC6822-FIELD7 | U9WQ15 | 19 45 09.42 | −14 48 29.4 | −0.35, +0.30 | |
| PEGASUS | 08 | PEGASUS | U9WQ08 | 23 28 35.42 | +14 44 05.8 | −0.45, +0.15 |
| PHOENIX | 07 | PHOENIX | U9WQ07 | 01 51 00.74 | −44 26 51.0 | +0.18, +0.05 |
| SEXTANSA | 05 | SEXTANSA-A1+A2 | U9WQ05 | 10 10 55.59 | −04 40 46.2 | +0.20, +0.45 |
| 04 | SEXTANSA-A3+A4+A5+A6 | U9WQ04 | 10 11 04.59 | −04 41 54.2 | −0.50, −0.15 | |
| SEXTANSB | 06 | SEXTANSB | U9WQ06 | 10 00 00.06 | +05 19 59.3 | −0.37, −0.30 |
| WLM | 01 | WLM-A1+A3 | U9WQ01 | 00 01 56.61 | −15 27 13.0 | +0.15, −0.50 |
| 02 | WLM-A2+A4 | U9WQ02 | 00 01 60.00 | −15 29 47.1 | +0.25, −0.70 | |
| 03 | WLM-NEW | U9WQ03 | 00 01 54.72 | −15 28 56.2 | +0.15, −0.65 |
Notes. aTwelve exposures in six filters were taken at every pointing, with exposure times of 2 × 600 s in F170W, 300 s + 260 s in F255W, 230 s + 260 s in F439W, 2 × 50 s in F555W, and 2 × 60 s in F814W. bCorrection needed to register WFPC2 coordinates to LGGS reference frame (e.g., R.A. (HST) + Δα = R.A. (LGGS)).
Download table as: ASCIITypeset image
The footprints of the WFPC2 pointings are shown in Figure 1, overlaid on GALEX far-UV imaging. The wide-field far-UV GALEX imaging unambiguously reveals the youngest stellar populations (e.g., Kang et al. 2009; Bianchi et al. 2011c; Efremova et al. 2011) and was used to identify the most conspicuous star-forming (SF) sites across the LG galaxies, and to chose the HST imaging pointings for this program. Our HST imaging covers ≈40 arcmin2 in NGC 6822 (seven pointings, two are partially overlapping); 5.8 arcmin2 (1 pointing) each in Pegasus, Phoenix, and Sextans B; 11.6 arcmin2 in Sextans A (2 pointings); and ≈15 arcmin2 in WLM (3 partially overlapping pointings). For NGC 6822, our pointings do not target some of the very conspicuous SF regions, such as Hubble X and Hubble V, because these were already studied with HST multi-band photometry in previous programs (e.g., Bianchi et al. 2001b; Bianchi & Efremova 2006): the new pointings were chosen instead to cover regions with characteristics differing from those already investigated, enabling comparisons which may clarify star formation in varying environments. In all regions studied, this is the first imaging data providing such wavelength coverage with two UV bands shortward of U, ideal to characterize the hottest stars.

Figure 1. HST-WFPC2 footprints overlaid on far-UV GALEX imaging, where the young populations are most evident. The images are scaled so that the 0.5 kpc bar (the long bar in each image) has identical length, except for the two smallest galaxies (top), which are shown on a scale twice as large to make them clearly visible. The small bar corresponds to 1'.
Download figure:
Standard image High-resolution image3. PHOTOMETRY
This is the first paper of a series in which we will present extensive photometric catalogs of stellar sources and of stellar clusters in Local Group galaxies from the homogeneous data sets acquired by our treasury program HST 11079. Therefore, we describe here in detail the characteristics of the data, the adopted photometry procedures, and the resulting photometric quality.
The calibrated science data images were downloaded from the MAST archive, already processed for bias removal and flat fielding by the pipeline. One of the four WFPC2 detectors, WF4, is known to suffer from occasional bias anomalies, characterized by zero or low bias count levels. For details on WF4 anomaly and related calibration caveats, we refer to the instrument team Web site and the instrument report by Dixon & Biretta (2009). A WF4 bias correction is applied by the pipeline (for data downloaded after 2009 August 28) pixel to pixel and the resulting photometry is more accurate for faint stars (Dixon & Biretta, 2009), the accuracy quoted by these authors being up to ∼0.01 mag for observations with gain = 7, which is the case for all of our images. The data sets for which a WF4 bias correction was applied by the pipeline have the keyword WF4TCORR in the header, and its value is set to "PERFORM" when the new calibration step has been performed. For this reason, in 2009 September we downloaded all observations from the archive again, in order to minimize the impact of WF4 anomalies on our photometric quality. We had previously analyzed the first data soon after each observation, therefore we could compare photometry on the same data downloaded before and after 2009 August. We actually see a small improvement in the WF4 photometry when we test its consistency by comparing stars that fall in detectors WF2 or WF3 in other overlapping pointings (see below).
We removed cosmic rays, combined the images taken with the same filter, detected the sources, and performed point-spread function (PSF) fitting photometry using the HSTphot photometry package by Dolphin (2000), in the version posted on 2009 September 9 on his Web site http://purcell.as.arizona.edu/hstphot/ which includes updated zero points but no improvements on Charge Transfer Efficiency (CTE) corrections for WF4 (A. Dolphin 2009, private communication).
The image preprocessing consisted of (1) using the data quality images (".c1f" files) to mask (with the mask/HSTphot routine) bad and saturated pixels; (2) masking the cosmic rays with crmask/HSTphot using the two images taken in every filter; (3) combining the images at a given pointing taken with the same filter using coadd/HSTphot; and (4) hot pixels removal (hotpixels/hstphot).
Source detection, PSF photometry, and calibration are all part of the main HSTphot routine hstphot. We run the hstphot routine with source-detection independent threshold value of 3.5σ, and a total threshold value of 4.0σ, which results in a minimum S/N = 4 for the detected sources and a maximum photometric error of 0.27 mag.
3.1. Background Subtraction and Aperture Correction
HSTphot offers two different options for background subtraction: local background estimation (option 2) and use of a sky background image ("re-fitted sky," option 512). We compared the PSF photometry obtained with both options. They compare well if the default aperture corrections are used. We computed individual aperture corrections with HSTphot: they are comparable to the default values when we use the "re-fitted sky" option, but are very different when we use the local background option. Magnitudes computed with local background estimate and individual aperture corrections are up to 0.25 mag (depending on the detector and image) fainter than magnitudes computed using local background estimate and default aperture corrections, or re-fitted sky background subtraction with either default or individual aperture corrections. The effect is due to source crowding in most of our fields. Using the re-fitted sky option for background subtraction, we compared the aperture corrections computed individually for every chip and every filter by HSTphot, with the default (average) values. We find that the highest deviations, up to 0.05 mag, occur in the best exposed filters (F555W and F439W) while for shorter-wavelength filters, where the sources are much more sparse, the agreement is excellent (⩽0.01 mag in most cases). Moreover, the highest differences are seen in the WF3 chip, which contains the largest part of our target SF regions (as a consequence of how we centered the targets), therefore is much more populated of sources, and the smallest differences (almost zero) are found in the PC chip, which is the least populated. We conclude that in some fields, and especially for WF3 F555W and F439W images, crowding affects the choice of isolated stars by the HSTphot package to derive individual aperture correction. We have experienced this problem previously when analyzing HST imaging in crowded stellar fields from earlier programs. Because the problem does not subsist for shorter-wavelength filters where stars are more sparse, the error in aperture correction, however small (⩽0.05 mag), would introduce a small color bias for crowded field chips if we used individual aperture correction values. Therefore, for homogeneous robustness across the whole catalog, we adopted the default aperture correction values. We discuss here at length these additional systematic uncertainties, because in the final catalog we report only the formal photometry error for each source, as is customary. Finally, a potential additional source of systematic uncertainty is the CTE correction.
3.2. Repeatability and Consistency Tests
In order to evaluate which are the best HSTphot options to use for our photometry of crowded stellar associations and to assess uncertainties in the CTE corrections, we compared photometry of sources in overlapping portions of some fields. Such overlaps are few, since our goal was to maximize the imaging coverage of SF regions and to avoid repetitions. M31 and M33 photometry will be presented in a forthcoming paper, but all of the tests on photometry accuracy are reported here. There is some overlap between fields 1, 2 and, 3 in WLM, between fields 49 and D8 in M31, and between fields 18 and 20 in M33. In addition, visit D8 in M31 is a repetition of visit 48, which failed during reacquisition and therefore the second orbit worth of observations was lost, but exposures in F336W, F439W, and F555W are useable. Since their orientation is similar to the make-up visit D8, the comparison between the two provides a check for repeatability with the same detector, while the other overlaps provide a test for consistency among different detectors. Most comparisons are limited by statistical significance, and the agreement is much better when a larger number of overlapping stars is available. Stars with repeated measurements in WLM are few: from 21(F336W) to 43/64 (F555W/F814W) stars overlap between field1-WF3 and field3-WF4, and 17 to 57 stars (F336W to F814W) are in common between field2-WF4 and field3-WF2 (plus a few WF3 sources), when we limit the sample to sources with photometric error better than 0.1 mag and "sharpness" and "type" restrictions as described below. The comparison shows that magnitudes from both chips of field 3 are brighter than in field 1 or field 2, the mean difference being 0.1/0.08 mag in F555W/F814W (σ = 0.15/0.12 mag) for WF4, but almost zero for WF3 in these filters, and being larger for bluer filters than for longer-wavelength filters, probably just because of the much poorer statistics at shorter wavelengths. All differences are less than the standard deviations. More matched stars are available if we do not apply restrictions of magnitude errors, but the larger errors then blur the comparisons. Photometry from visit 18-WF3 and visit 20-WF2 in M33 (38 to 98 stars, F336W to F814W) differs on average by 0.045 mag (F336W and F439W, σ = 0.16 mag) or 0.006 mag (F555W, σ = 0.1 mag), visit 18-WF3 being fainter, but again not significantly. Comparison between visit 18-WF4 and visit 20-WF2 shows again the first to be fainter by 0.187/0.06/0.04/0.03 mag (F336W/F439W/F555W/F814W, with 11/16/24/50 overlapping stars, respectively), all differences being much smaller than the standard deviations and therefore not significant. Comparison of M31 visit D8-WF2 or WF3 with visit 49-WF4 indicates D8 measurements to be fainter by 0.021–0.027 mag in all filters (with standard deviations between 0.12 and 0.3 mag, and a few hundred stars overlap). Finally, for M31 repeated observations visit D8 and visit 48 where we compare stars reobserved in the same chip, the agreement is within 0.015 mag for all repeated filters in WF3 and WF2 detectors (a few hundred stars overlap in each), but slightly worse, about 0.04 mag, for the WF4 detector, but again all differences are well within 1σ. The difference is again in the sense of fainter magnitudes from visit D8. If we took these differences at face value, photometric stability seems worse in WF4 than in WF3 and WF2 (by about 0.02 mag), but other possible systematic small offsets may occur from visit to visit, of the order of ≳0.02 mag, that we suspect may arise from CTE corrections since they are detector- and filter-independent. Comparisons with PC measurements are worse, as is often found to be the case, but stars are also very few in this higher resolution detector. The comparison figures given above are for HSTphot option "520," i.e., re-fitted sky background estimate and default aperture correction values, which we adopted for our catalog. Using other options, such as the aperture corrections for individual chips, the consistency is only slightly worse. In summary, our data do not provide any significant evidence for systematic differences and do not add information to the thorough tests by the WFPC2 team cited above, since we particularly avoided repetitions; these tests only show that repeatability is within the significance of the measurements, and worse in WF4 than in other chips.
3.3. Completeness Limits
We estimated the completeness of our photometry by using the fake_image/HSTphot routine to create artificial images on which we performed detection and photometry running HSTphot with the same parameters as for our photometry. The incompleteness reaches 20% at 21.0, 22.8, 22.9, and 22.0 mag for F336W, F439W, F555W, and F814W, respectively. The detections in the two ultraviolet filters F170W and F255W are incomplete even at bright magnitudes.
3.4. The Photometry Catalogs
In the final photometry catalogs we want to retain as many true sources as possible, while at the same time eliminate artifacts. After testing a number of options and considering the completeness limits given above, we first chose to retain sources detected in at least one of the two filters where we have the deepest exposures: F439W or F555W, plus one other band (any filter), in order to eliminate possible spurious detections that would appear in a single filter. By imposing this requirement we typically include in the catalogs between 30% and 55% of the total original detections by HSTphot in any filter. The rejected sources are detections in only one filter, and they are artifacts, typically small residual cosmic rays or hot pixels. The percentage of retained sources varies, as we may expect, being higher for fields with higher number of detections. In fact, more total detections generally mean more real stars, if the number of artifacts (the single-filter detections), mostly related to cosmic rays, is constant, since the exposure times are the same in all fields. For one field however, visit 09 in NGC 6822, imposing detection in two filters reduces the total number to about 15%. Visual inspection reveals this field to be particularly plagued with artifacts. We further restricted the catalogs, for the purpose of our analysis, to sources with HSTphot parameters sharpness between −0.3 and 0.3, and type = 1 (defined as "good star"), although sources of with any sharpness value and HSTphot type are included in the online catalogs. Such restrictions conservatively eliminate most remaining artifacts (cosmic rays, background objects), which appear mostly as sources with unrealistic extremely small errors and faintest magnitudes in the error–magnitude plots (Figure 2). We note that applying only a cut in sharpness would be sufficient to effectively eliminate most of these artifacts (between 5% and 7% of the sources across our galaxy sample) and the additional restriction of type = 1 removes about 10 times less sources, about 0.4%–0.7% of the sources (except for Sextans A where it is 2%). This criterion may eliminate also some actual stars, but very few. There are only a few type = 2 objects (defined as unresolved binary) per galaxy, and these fall on the acceptable locus in the error–magnitude diagram (Figure 2); however, the analysis of their composite color would be meaningless. They are therefore retained in the online catalogs for record, but not used in the following analysis. Figure 2 shows error–magnitude plots for a typical field in each filter.

Figure 2. Error–magnitude plots for one sample galaxy, Sextans B, in each filter. The yellow (light gray) dots are sources with HSTphot "type" other than 1, and the green (gray) dots are sources with HSTphot "sharpness" greater than 0.3 (in absolute value). These sources are excluded in the analysis sample.
Download figure:
Standard image High-resolution imageWe then examined the color–magnitude diagrams of the sources (discussed in the next section) after applying the above restrictions, and we found that a number of sources detected in the two filters F255W and F439W have unrealistic colors of mF255W − mF439W ⩽ −4. All these implausible sources have large errors, typically larger than 0.2 mag; however, our maximum error (from the imposed 3.5σ detection limit) is 0.27 mag, and the corresponding ∼0.4 mag error (3σ) on color could not cause even the hottest stars to have such negative mF255W− mF439W color. We therefore suspected these sources to be spurious, and inspection of the images indeed revealed most of them to be one-pixel small artifacts such as sharp cosmic rays or hot pixels, that happen to have a match in the other image, because both F255W and F439W have fairly long exposures, and therefore, abundances of small cosmic rays. Much fewer (almost none) of these spurious detections are seen in the shorter F555W and F814W exposures, as can be expected. We further investigated the HSTphot output parameters: sharpness, roundness, χ2, and "major axis," in search of criteria to eliminate these spurious sources. Unfortunately, all of these parameters for the artifacts have values in the range of the good stellar sources, therefore they are not helpful. The only useful coincidence allowing us to sieve these remaining artifacts is that they group at color mF255W − mF439W ⩽ −3.5 mag, well separated from the stellar sequence (Figure 4), and this coincidence just reflects the difference in the zero points: ZP = 17.037 mag for mF255W and ZP = 20.886/20.870 (WF2–WF3/WF4) for mF439W. Most of these spurious sources do not have a counterpart in F555W, thanks to the shorter exposure (which reduces the probability of a cosmic ray coinciding in the same position as in another filter image) which is another criterion to identify most though not all possible artifacts. For example, in NGC 6822, the galaxy where we have most fields (seven), and 0.83 million detected sources overall, we find 101 sources with detection in both mF255W and mF439W and mF255W − mF439W ⩽ −3.5 mag; 94 sources detected in both mF255W and mF439W but not in F555W, all but five of these having mF255W − mF439W ⩽ −3.5 mag, and five having normal mF255W − mF439W and mF336W − mF439W colors. Therefore, in the final analysis catalog we imposed the further requirement of detection in the F555W band (equally deep as F439W but with a five-time shorter exposure), which eliminates an additional ∼0.04% of the sources. This criterion may also eliminate a few real stars, but errors of these objects are mostly close to our faintest-source limit, and the analysis that follows, concerning the most massive stars, is not at all affected by these restrictions. We try nonetheless to apply the best possible criteria in order to make the catalogs generally useful. The final number of sources in each galaxy with these criteria are given in Column 3 (see footnotes "a" and "b") of Table 3. Imposing detection in F814W in our case would unnecessarily eliminate hot sources, since the completeness limit is brighter in this filter, consistent with our program choices, and therefore this criterion was avoided.
Table 3. Results from HST Photometry
| Galaxy | No. of Sources | No. of Stars with | E(B − V) This Paperd | – Other – | No. of Stars | |||||
|---|---|---|---|---|---|---|---|---|---|---|
| a/b | Fitted SEDc | Hot Stars col.5 | All Stars col.4 | Cool Stars | e | f | M > | |||
| Total | Teff > 18 kK | Median/Mean | Median/Mean | Median/Mean | 17 M☉/9 M☉ | |||||
| Phoenix | (*) | 1486/1338 | 96 | 54 | 0.09/0.11 ±0.13 | 0.07/0.12 ±0.16 | 0.02/0.13 ±0.19 | 0.15 | 0.02 | 1+1−0/3+0−0 |
| (**) | 46 | 0.10/0.11 ±0.13 | 0.03/0.10 ±0.15 | 0.00/0.08 ±0.17 | 1+1−1/4+0−0 | |||||
| (***) | 46 | 0.09/0.12 ±0.14 | 0.03/0.10 ±0.15 | 0.00/0.09 ±0.17 | 1+1−0/3+0−0 | |||||
| Pegasus | (*) | 2204/2034 | 63 | 48 | 0.16/0.17 ±0.11 | 0.16/0.17 ±0.12 | 0.12/0.18 ±0.17 | 0.15 | 0.07 | 1+2−2/46+141−5 |
| (**) | 47 | 0.15/0.16 ±0.11 | 0.17/0.20 ±0.17 | 0.28/0.32 ±0.25 | 3+5−4/73+413−14 | |||||
| (***) | 48 | 0.15/0.16 ±0.11 | 0.16/0.20 ±0.17 | 0.26/0.32 ±0.26 | 2+4−4/57+287−11 | |||||
| Sextans A | (*) | 4149/3556 | 571 | 425 | 0.11/0.11 ±0.08 | 0.10/0.11 ±0.10 | 0.05/0.10 ±0.15 | 0.05 | 0.04 | 179+30−5/1332+1005−162 |
| (**) | 424 | 0.10/0.10 ±0.09 | 0.09/0.10 ±0.11 | 0.05/0.10 ±0.15 | 191+29−1/1355+996−156 | |||||
| (***) | 424 | 0.10/0.10 ±0.08 | 0.09/0.10 ±0.11 | 0.05/0.10 ±0.15 | 178+25−1/1319+1003−167 | |||||
| Sextans B | (*) | 3584/3169 | 191 | 150 | 0.09/0.11 ±0.10 | 0.09/0.12 ±0.12 | 0.09/0.14 ±0.17 | 0.09 | 0.03 | 27+24−21/452+1672−52 |
| (**) | 147 | 0.07/0.10 ±0.10 | 0.07/0.10 ±0.12 | 0.07/0.13 ±0.17 | 27+24−21/429+1664−51 | |||||
| (***) | 147 | 0.07/0.10 ±0.11 | 0.07/0.10 ±0.12 | 0.07/0.12 ±0.16 | 25+24−22/415+1613−58 | |||||
| WLM | (*) | 7058/6349 | 631 | 531 | 0.11/0.12 ±0.10 | 0.11/0.12 ±0.12 | 0.08/0.13 ±0.18 | 0.07 | 0.04 | 45+36−29/721+923−61 |
| (**) | 524 | 0.09/0.11 ±0.11 | 0.09/0.11 ±0.12 | 0.08/0.14 ±0.18 | 48+40−36/740+965−71 | |||||
| (***) | 523 | 0.09/0.11 ±0.10 | 0.09/0.11 ±0.12 | 0.07/0.14 ±0.19 | 42+39−32/694+829−52 | |||||
| NGC 6822 | (*) | 26722/24196 | 1917 | 1465 | 0.32/0.33 ±0.12 | 0.31/0.31 ±0.14 | 0.24/0.26 ±0.18 | 0.25 | 0.24 | 93+38−32/1067+608−61 |
| (**) | 1433 | 0.32/0.32 ±0.12 | 0.30/0.30 ±0.15 | 0.20/0.23 ±0.21 | 109+65−54/1174+816−66 | |||||
| (***) | 1428 | 0.32/0.32 ±0.12 | 0.30/0.30 ±0.16 | 0.20/0.24 ±0.21 | 92+49−40/1060+497−62 | |||||
Notes. *SED-fitting results using models of metallicity z = 0.002 and LMC2-type extinction (extinction curve from Misselt et al. 1999). **SED-fitting results using models of solar metallicity and "MW-type" extinction with RV = 3.1 (extinction curve from Cardelli et al. 1989). ***SED-fitting results using models of solar metallicity and LMC2-type extinction. aTotal sources detected in either F555W or F439W plus at least another filter. bNumber of sources detected in F555W plus at least another filter, with HSTphot type = 1 and sharpness between −0.3 and 0.3. cSources (out of the sample in Column 3, with error cuts of 0.15/0.1/0.1 mag in F336W/F439W/F555W, which maximizes significant detection in all filters and favors the hottest stars, consistent with the design and scope of our program. Note that these are less than one tenth the total sample and include the massive top of the main sequence and cool supergiants (large dots in Figure 13). dDerived in Section 4 of this paper; the average value is driven mainly by hot stars in conspicuous star-forming regions, which are the majority of the SED-fitted stars, therefore it is not surprisingly higher than the foreground extinction. eFrom Massey et al. (2007), estimated by eye from the position of the blue plume in the B, V CMD (ground-based). fFrom the Schlegel et al. (1998) Milky Way maps.
Download table as: ASCIITypeset image
To summarize, in the catalogs available online we retained sources with detection in either F555W or F439W plus one other filter in favor of completeness; however, we restrict the analysis sample to sources with detection in F555W (plus another filter), HSTphot type = 1 and |sharpness| < 0.3. The inclusive photometry catalogs are given in the online version of this paper and are also available, with other supporting data, from the author's Web site (http://dolomiti.pha.jhu.edu/LocalGroup/). A small sample is shown in Table 4. In the catalogs, the magnitudes of objects detected in overlapping images are average of the individual measurements weighted by their errors. Their coordinates refer to one of the images, which is provided in Column 24 of the table; in Column 25 we also record on which detector (chip) the source has been measured so that it is possible to retrace sources measured on WF4, which has slightly larger systematic errors. The columns are: (1) running number, (2) parent galaxy, (3) object ID, following IAU designation, (4 and 5) R.A. and decl., (6–17) magnitude and error, in each filter from F170W to F814W, (18–21) UBVI magnitudes, transformed from the mF336W, mF439W, mF555W, mF814W magnitudes to the Johnson system with HSTphot, (22) sharpness parameter, (23) "type," (24 and 25) visit/field (see Table 2) and detector (chip). Small offsets were added to the coordinates of visit 02 (Δ − R.A. = −0.00018 deg, Δ − decl. = −0.00018 deg) and visit 10 (Δ − R.A. = −0.00003 deg, Δ − decl. = −0.00020 deg) to match their sources in overlapping fields (Figure 1).
Table 4. HST Photometry Catalogs
| No. | Galaxy | Source | R.A. (J2000) | Decl. (J2000) | mF170W | Err | mF255W | Err | mF336W | Err | mF439W | Err | mF555W | Err | mF814W | Err | U | B | V | I | Sharpness | Type | Frame | Chip |
|---|---|---|---|---|---|---|---|---|---|---|---|---|---|---|---|---|---|---|---|---|---|---|---|---|
| IAU Identifier | (deg) | (deg) | (mag) | (mag) | (mag) | (mag) | (mag) | (mag) | (mag) | (mag) | (mag) | (mag) | (mag) | (mag) | (mag) | (mag) | (mag) | (mag) | ||||||
| 0 | PHOENIX | J015052.6-442610 | 27.7195700 | −44.4363700 | 99.00 | 99.00 | 99.00 | 99.00 | 99.00 | 99.00 | 22.30 | 0.09 | 21.02 | 0.03 | 19.61 | 0.02 | 99.00 | 22.17 | 21.00 | 19.57 | 0.018 | 1 | 07 | 1 |
| 1 | PHOENIX | J015053.0-442617 | 27.7208999 | −44.4382535 | 99.00 | 99.00 | 18.44 | 0.12 | 20.81 | 0.19 | 22.62 | 0.16 | 99.00 | 99.00 | 99.00 | 99.00 | 21.55 | 22.67 | 99.00 | 99.00 | 0.146 | 1 | 07 | 1 |
| 2 | PHOENIX | J015053.1-442610 | 27.7215365 | −44.4361175 | 99.00 | 99.00 | 99.00 | 99.00 | 99.00 | 99.00 | 99.00 | 99.00 | 22.54 | 0.10 | 21.42 | 0.07 | 99.00 | 99.00 | 22.52 | 21.39 | −0.092 | 1 | 07 | 1 |
| 3 | PHOENIX | J015053.2-442639 | 27.7218579 | −44.4442064 | 99.00 | 99.00 | 99.00 | 99.00 | 21.80 | 0.23 | 23.93 | 0.26 | 23.83 | 0.27 | 99.00 | 99.00 | 22.56 | 23.95 | 23.83 | 99.00 | 0.086 | 1 | 07 | 1 |
| 4 | PHOENIX | J015053.2-442630 | 27.7218910 | −44.4417058 | 99.00 | 99.00 | 99.00 | 99.00 | 99.00 | 99.00 | 23.58 | 0.26 | 23.54 | 0.22 | 99.00 | 99.00 | 99.00 | 23.58 | 23.54 | 99.00 | 0.103 | 1 | 07 | 1 |
| 5 | PHOENIX | J015053.3-442635 | 27.7221714 | −44.4432454 | 99.00 | 99.00 | 99.00 | 99.00 | 99.00 | 99.00 | 23.69 | 0.23 | 23.04 | 0.13 | 21.91 | 0.09 | 99.00 | 23.64 | 23.02 | 21.87 | 0.050 | 1 | 07 | 1 |
| 6 | PHOENIX | J015053.3-442631 | 27.7221880 | −44.4420876 | 99.00 | 99.00 | 19.08 | 0.20 | 99.00 | 99.00 | 23.50 | 0.21 | 99.00 | 99.00 | 99.00 | 99.00 | 99.00 | 99.00 | 99.00 | 99.00 | 0.037 | 1 | 07 | 1 |
| 7 | PHOENIX | J015053.3-442642 | 27.7222872 | −44.4451988 | 99.00 | 99.00 | 99.00 | 99.00 | 99.00 | 99.00 | 23.84 | 0.24 | 23.66 | 0.22 | 22.94 | 0.22 | 99.00 | 23.83 | 23.65 | 22.91 | −0.220 | 1 | 07 | 1 |
| 8 | PHOENIX | J015053.6-442632 | 27.7234120 | −44.4423311 | 99.00 | 99.00 | 99.00 | 99.00 | 99.00 | 99.00 | 99.00 | 99.00 | 23.60 | 0.22 | 22.80 | 0.22 | 99.00 | 99.00 | 23.57 | 22.76 | 0.026 | 1 | 07 | 1 |
| 9 | PHOENIX | J015053.6-442636 | 27.7235965 | −44.4435215 | 99.00 | 99.00 | 99.00 | 99.00 | 99.00 | 99.00 | 23.16 | 0.13 | 22.44 | 0.07 | 21.38 | 0.06 | 99.00 | 23.11 | 22.41 | 21.34 | −0.103 | 1 | 07 | 1 |
| 10 | PHOENIX | J015053.7-442631 | 27.7241145 | −44.4421359 | 99.00 | 99.00 | 99.00 | 99.00 | 99.00 | 99.00 | 99.00 | 99.00 | 23.19 | 0.14 | 22.08 | 0.11 | 99.00 | 99.00 | 23.16 | 22.05 | −0.145 | 1 | 07 | 1 |
Notes. This table is also available at the author's Web site http://dolomiti.pha.jhu.edu/LocalGroup/. Magnitude values of 99.00 are assigned to non-detections in a given filter. HSTphot parameters "sharpness" and "type" are given in Columns 22 and 23: only sources with type = 1 ("good star") and sharpness between −0.3 and 0.3, and detection in the F555W filter, were used in the analysis.
Only a portion of this table is shown here to demonstrate its form and content. Machine-readable and Virtual Observatory (VO) versions of the full table are available.
Download table as: Machine-readable (MRT)Virtual Observatory (VOT)Typeset image
The astrometry was derived using the metric/wfpc2 IRAF routine to translate the PC/WF coordinates into right ascension and declination. We kept the astrometry in the frame of the parent WFPC2 image (except as noted above) which is useful to produce finding charts for selected objects from this program. In Table 2, we also give offsets to reduce the astrometry to a standard reference frame, obtained by comparing reference stars with the astrometry solution of Massey et al. (2007) photometry. The offsets were derived by comparing stars measured in the ground-based surveys with only one HST counterpart; after examining the distribution of distances between matches in the two catalogs and the multiplicity of matches with decreasing match radius, we concluded that all systematic differences are much less than 1 arcsec and vary from visit to visit. More details are given below.
3.5. Comparison with Ground-based Photometric Surveys
We compared our HST photometry in mF555W and mF439W, transformed to B and V, to the broadband photometry from the ground-based LGGS (Massey et al. 2007). Comparison of astrometry shows the coordinates to agree to much better than 1 arcsec (Section 3.4), with no corrections applied, and the majority of distances between matched sources to be a few tens of an arcsec (for the closest match). These distances decrease to <0.2 arcsec for most sources after the corrections given in Table 2 are applied. If we use a match radius of 2.5 arcsec, we find between 67% and 95% of the Massey et al. (2007) sources to be resolved into multiple HST sources (up to a maximum of 13 HST sources within 2 5 of a ground-based source). This is due to the HST spatial resolution, primarily, and to the HST photometry being deeper for most galaxies (Figure 3). For four of our sample galaxies, Massey et al. (2007) photometry has a limit of V ∼ 22 mag, and for WLM and NGC 6822 it includes fainter sources: we show in Figure 3 NGC 6822 as the deepest example in the LGGS ground-based catalog and Sextans A as a typical-depth example, both with numerous matches.
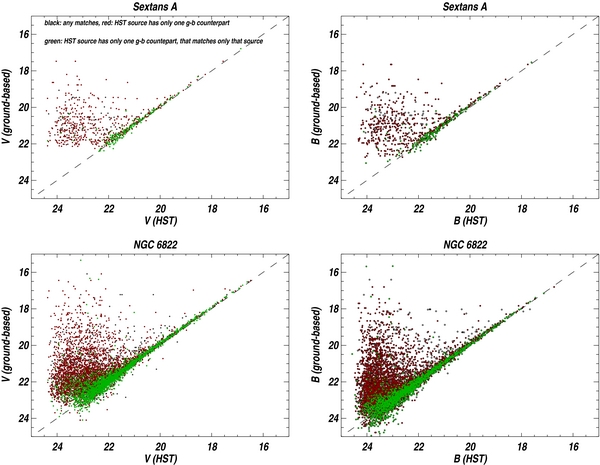
Figure 3. Comparison of HST V and B photometry with matched ground-based photometry from the LGGS survey. Two sample galaxies are shown: the depth of LGGS photometry for Phoenix, Pegasus, and Sextans B is similar to the Sextans A plot; its limit is fainter for WLM and NGC 6822. Red dots mark ground-based sources that match more than one HST source, i.e., they are unresolved at the ground-based resolution; green dots mark sources with a unique match (i.e., the HST coordinates have only one counterpart and this does not match other HST sources). The plot was made with a match radius of 1.5 arcsec. The coordinates between the two catalogs were registered to within 0.1 arcsec.
Download figure:
Standard image High-resolution imageThe number of multiple matches is reduced if we restrict the match radius to 1.5 arcsec, for example, which is comparable to a typical ground-based seeing, and it is also reduced if we consider HST sources brighter than our faintest limit. Obviously, source crowding increases with fainter flux limits, although only unresolved sources of comparable brightness to the closest match would affect unresolved photometric measurements. A ground-based source measurement including a number of unresolved stars would be brighter than the HST resolved sources, and this effect is seen in Figure 3, increasing as fainter sources are considered. Red dots are HST sources for which only one ground-based source is found within the match radius; green dots are cases where both the HST source has a single ground-based match and the ground-based source matches only one HST star within the match radius; these cases are much fewer, and not surprisingly they are found among the brightest sources. Specifically, for a match radius of 2.5 arcsec, we find the following fraction of HST sources to have ground-based matches (and fraction among these matches having a unique ground-based counterpart): 73% (68%), 29% (78%), 44% (68%), 36% (78%), 88% (45%), and 83% (50%) for Phoenix, Pegasus, Sextans A, Sextans B, WLM, and NGC 6822, respectively. Also, 67%, 83%, 90%, 94%, 75%, and 78%, respectively, of the ground-based counterparts match multiple HST sources (i.e., they are resolved into multiple components in HST imaging), and only 24%, 14%, 8%, 5%, 11%, and 12% of the total matched HST sources have a unique ground-based match that is matching only that HST source. As we will see in the next sections, the hottest stars tend to be in crowded regions, making the HST study all the more important for our purpose.
With a more restricted match radius of 1.5 arcsec, after registering the coordinates as shown in Table 2, the above fractions become: 59% (94%), 19% (91%), 29% (90%), 21% (90%), 69% (82%), and 64% (86%) total matches (and fraction of them where the HST source has only one ground-based match); 51%, 63%, 75%, 80%, 59%, and 64% of the matched ground-based sources are matching multiple HST sources (this is the fraction of unresolved stars in the ground-based survey); and finally, for 48%, 35%, 24%, 20%, 34%, and 32% of the matches, the HST source has a unique counterpart and this counterpart is not closer than 1.5 arcsec to any other HST source. We reported results with two often used match radii, although the second is more representative of a ground-based seeing, to aid the interpretation. Within a smaller radius, fewer matches are found, but those that are eliminated are mostly spurious matches; in fact, the number of total matches decreases but the fraction of "single" matches becomes much higher. This is also confirmed by the distribution of distances between HST sources and their ground-based counterparts, which is peaked at small values (≪1 arcsec) for the closest match, while it is flat or grows with distance for secondary matches. Such arguments were also discussed by Bianchi et al. (2011a) regarding other data sets, and are relevant for assessing the significance of comparisons.
Because unresolved ground-based sources include flux from more than one HST source, we compared magnitudes among the two data sets only for stars with a unique match (the green points in Figure 3). We further restricted the comparison to sources brighter than 21.5 mag to avoid large photometric errors. The green dots in Figure 3 indicate a very small offset between HST and ground-based measurements. The average difference between magnitudes (in the restricted sample as defined above) is V (HST)−V (Massey et al. 2007) = 0.086 mag (1σ = 0.187 mag), and B (HST)−B (Massey et al. 2007) = 0.068 mag (1σ = 0.136 mag) for NGC 6822 where the maximum number of unique matches is found, brighter than 21.5 mag (594 stars in V and 384 stars in B). In other galaxies, much fewer matches are found, with these restrictions, between 19 (Pegasus) and 103 (WLM); the average magnitude difference in all galaxies is always in the sense of HST magnitudes being fainter. Restricting the comparison to stars brighter than 21.0 [20.5, 20.0] mag decreases the sample but at the same time reduces the scatter because brighter stars have smaller photometric errors: for NGC 6822 (393 [263, 193] stars in V, 249 [160, 95] stars in B), V (HST)−V (LGGS) = 0.091[0.083, 0.081] mag (1σ = 0.167[0.082, 0.076] mag), and B (HST)−B (LGGS) = 0.062[0.060, 0.061] mag (1σ = 0.099[0.081, 0.067] mag), respectively. In sum, the same offset is found at any magnitude range, and the average difference becomes significant when we consider stars with small photometric errors.
4. ANALYSIS
4.1. Color–Magnitude Diagrams and Color–Color Diagrams
Figure 4 shows observed color–magnitude diagrams (CMD) for the six galaxies in different colors constructed from our set of WFPC2 filters. The data are not corrected for reddening. In order to indicate the expected location of the young stellar populations, we show with vertical lines stellar model colors, computed in the WFPC2 passbands, for Teff = 50,000, 30,000, 20,000, and 15,000 K. Both intrinsic (long lines) and reddened (short lines) colors with E(B − V) = 0.25 (MW-type dust, RV = 3.1) are shown. Model colors are shown for two gravity values, bracketing most expected values. The colors from different filters illustrate quantitatively the advantage of using violet and ultraviolet measurements to photometrically characterize the hottest stars, separating them from intermediate temperature stars. This can be further appreciated from Figure 5. In all galaxies a young or very young stellar population (blue stars) is present, although it is very inconspicuous in Pegasus and Phoenix compared with the other galaxies that are richer in massive stars. Comparison of the data with intrinsic and reddened model colors also indicates at a glance that foreground reddening is overall negligible in most galaxies, consistent with the foreground extinction estimates given in Table 3, and with values derived in the next section, except for NGC 6822, which is at low Galactic latitude. In NGC 6822's CMD, the "blue plume," the feature consisting of the upper main-sequence stars with mF439W − mF555W ∼ color between 0 and −0.2 mag or mF336W − mF439W ∼−1.6 mag, appears displaced by a reddening amount similar to the estimated foreground reddening, E(B − V) ∼ 0.25–0.22 (Massey et al. 2007; Bianchi & Efremova 2006; Bianchi et al. 2001b; Efremova et al. 2011; Table 3). The low Galactic latitude of NGC 6822 also entails a significant contamination by foreground MW-halo stars, visible as a large number of redder objects, mostly between the "blue plume" and the red supergiants.
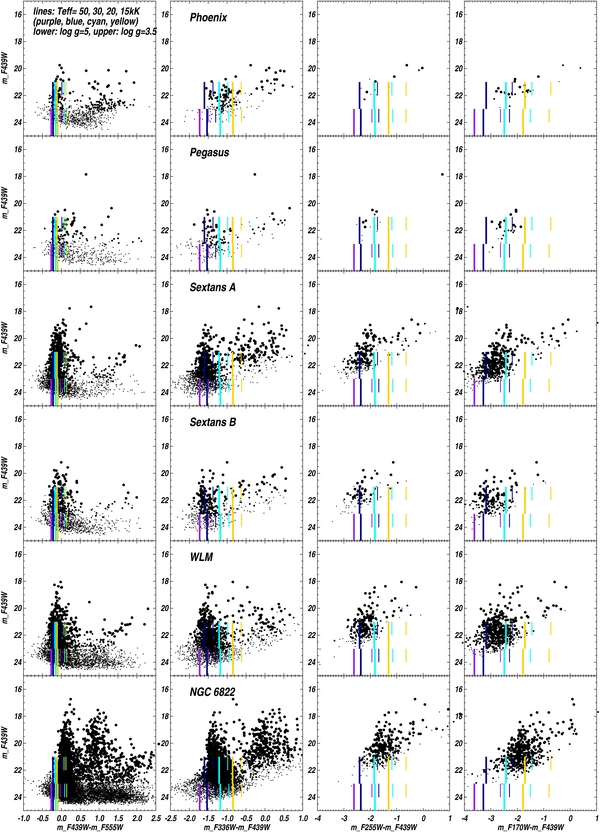
Figure 4. Color–magnitude diagrams in WFPC2 filters. Large dots indicate stars with good photometry (errors <0.15 (UV)/0.10 (B)/0.05 (B, V) mag) in the filters shown in each plot, medium-size dots are sources with errors up to 0.25 (UV), 0.2 (U), and 0.1 (B, V) mag, and the smaller dots are sources with larger errors. Vertical lines mark stellar model colors (z = 0.002) with Teff = 50,000, 30,000, 20,000 and 15,000 K (left to right; purple, blue, cyan, and yellow in the online journal): the long lines mark intrinsic model colors; short lines (displaced redward) are models reddened with E(B − V) = 0.25, assuming MW-type dust. Dust more typical of SF regions would cause higher reddening in the UV filters. The lower set of model colors is for log g = 5.0, and the upper set for log g = 3.5 and does not include Teff = 50,000 K. Note the much higher contamination by foreground stars (seen around B − V ∼ 1) toward the low-latitude galaxy NGC 6822. The paucity of stars in Phoenix and Pegasus reflects their overall intrinsic faintness and small area: only one WFPC2 pointing was used on these galaxies and on Sextans B, while two pointings were used in Sextans A, three in WLM, and seven in NGC 6822 (see Figure 1 and Table 1 for the area coverage of our HST imaging).
Download figure:
Standard image High-resolution image
Figure 5. Stellar model colors (constructed from Kurucz model grids) for the WFPC2 filters, showing the sensitivity of UV filters to the hottest Teff's, and the effects of gravity (thick solid lines for log g = 5.0, dashed lines for log g = 3.5) and metallicity (thick lines for solar metallicity and thin lines for one-tenth solar). Effects of extinction with E(B − V) = 0.5 for MW-type dust (RV = 3.1) are shown as vertical lines on each color. The plot illustrates how including UV measurements increases the sensitivity to hot stellar temperatures, and to extinction, in comparison to optical colors only.
Download figure:
Standard image High-resolution imageFigure 6 shows color–color diagrams with two combinations of WFPC2 filters and models (metallicity z = 0.002) of different gravity for two sample galaxies. Sources with best photometry are shown with larger dots in all figures. The plot emphasizes again the sensitivity of our program to the hottest stars. Color–color diagrams for other galaxies are similar to Sextans A; only for NGC 6822 most stars are more reddened than the model curves with E(B − V) = 0.25 mag.

Figure 6. Color–color diagrams for two sample galaxies: large dots are sources with photometric errors less than 0.15/0.15/0.10/0.05/0.05 mag in F170W/F255W/F336W/F439W/F555W, respectively; the error cuts are applied only to the filters used in each plot, which explains the different number of large dots in each panel. Thick lines are intrinsic model colors (solid for log g = 5, dashed for log g = 3.5, and dotted for log g = 3) for low metallicity. Medium and thin lines are reddened model colors for E(B − V) = 0.25 and 0.50 mag. Thin lines also connect reddened and unreddened models at Teff = 50 kK, 25 kK and 15 kK, indicating the reddening vectors. The left plot corresponds to the classical U − B, B − V diagram.
Download figure:
Standard image High-resolution image4.2. Derivation of Physical Parameters for Stellar Sources and Extinction
We analyze the photometry of individual stars to infer their Teff and radius, as well as the extinction by interstellar dust. The derived parameters will be used in Section 5 to characterize the young populations.
For the stellar sources we have measurements in up to six filters, only the hottest, most luminous massive stars having good photometry in the far-UV filter as well. We derived the stellar physical parameters by fitting the photometry with grids of model colors, computed in the WFPC2 passbands from stellar atmosphere models with a range of Teff and gravity values (and metallicity), progressively reddened by increasing E(B − V) values in small steps. Extinction by interstellar dust is determined concurrently with the stellar parameters. SED-fitting results for sample objects are shown in Figure 7. In practice, our model color grids (computed from Kurucz model spectra from various sources and our own) have the greatest Teff coverage for log g = 5, the hottest temperature models being harder to calculate for lower gravities. In order to gauge accuracy and limitations of the models of the SED-fitting results and the effect of various assumptions (see later), we first compared model colors computed in the U, B, V bands from our grids with canonical U, B, V color calibrations for MW early-type stars; we found the model colors to be in agreement within ≲0.08 mag (U − B) and ≲0.02 mag (B − V) for the hottest stars, and much better for Teff values lower than 20,000 K, Kurucz-model grids showing better agreement than TLUSTY model grids. Part of the discrepancy may be due to the traditional passbands used for the UBV system and the consistency may be better for HST colors (see Maíz-Apelániz 2006). Although colors at a given Teff depend also on metallicity and gravity, for hot stars the difference between model colors and empirical calibrations (e.g., Schmidt-Kaler 1982) are larger than this effect. This was also found by Martins & Plez (2006, see their Figure 6); the color sensitivity to gravity is shown in Figure 5 and discussed later. Our previous comparisons between colors from Kurucz models and models including winds (computed with WM-basic or CMFGEN e.g., by Bianchi & Garcia 2002; Bianchi et al. 2009; Garcia & Bianchi 2004) showed the wind lines to have negligible effect on broadband colors, compared with other effects at play, and typical magnitude uncertainties. In any case, resulting Teff values are necessarily more uncertain at the hottest end of the model range. However, very hot stars are identified as such, more unambiguously from our filter set (extending to the far-UV) than from other combinations commonly used.
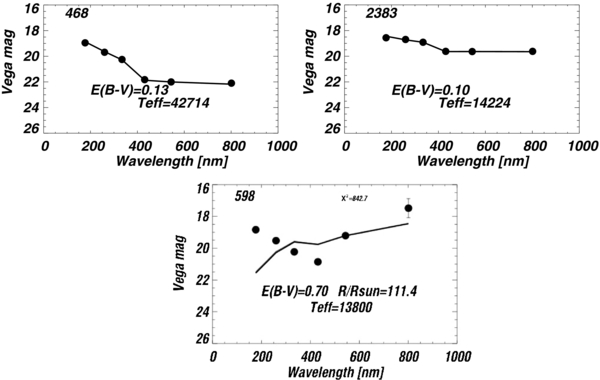
Figure 7. Top: two sample star SEDs (large dots) in Sextans A, with best-fit model SED (model magnitudes connected by line). Error bars (1σ) of the photometry are smaller than the dots. The two examples span a range of Teff in which stars have good photometry in all bands. Bottom: when a binary (or pair superposition) SED is fitted with single-star models, no good solution is found by the procedure, which usually runs to the end of the model grid, and returns the highest or lowest allowed values for one of the parameters (in this case a maximum E(B − V) = 0.7 mag was imposed). Such cases are culled from the sample, since their misleading Teff and E(B − V) would bias the statistical results. On the other hand, when enough measurements are available, the analysis provides a way to detect binary candidates (these will be analyzed in a separate work to infer the parameters of both objects and the ratio of radii and luminosities). See Section 4.2 for a description of the SED model analysis.
Download figure:
Standard image High-resolution imageThe color locus of hot stars has little foreground contamination. Colors for hot stars do not vary much with gravity as they do for A- and later-type stars (see Figure 5; also Bianchi & Efremova 2006; Figure 7 in Bianchi et al. 2007; Figures 3–5 in Bianchi 2009). Their log g can hardly be determined by photometric colors; however, once Teff and extinction are derived, because we know the distance (of their parent galaxy) we can use the extinction-corrected photometry also to approximately separate stars by luminosity class. For cool stars instead, the apparent magnitude of a cool supergiant, e.g., in NGC 6822, does not differ from that of a dwarf of similar temperature in the MW halo (e.g., Bianchi et al. 2001a; Catanzaro et al. 2003). Therefore, their brightness provides a more uncertain separation of galaxy members from MW stars. But cool star colors do differ with gravity, as seen in Figures 5 and 6, and in the above cited papers, and as also shown by Massey et al. (2006) from photometry of objects with known spectral type. Therefore, multi-band photometry also provides some sensitivity to gravity for cool stars.
Once Teff and extinction are determined from SED fitting (i.e., basically from the SED colors), the scaling between observed flux of a source and best-fit model flux provides the stellar radius, hence also Lbol, since the distance is known (to its parent galaxy) and the reddening correction has been derived (Figure 7). In practice, for every galaxy we perform SED fitting for the stars that have good photometry in enough filters; we use both high gravity and lower gravity models, we compare the resulting Teff's to spot spurious or unstable results, then we use the resulting stellar radius to assign a luminosity class, and we adopt the [Teff, E(B − V)] solution from the appropriate set of models. Again, the known distance helps us to choose the most probable solution, by consistency of [Teff, R*] with the photometry. Usually, the difference in derived [Teff, E(B − V)] values from using different log g grids is very subtle for hot stars, and the gravity of the adopted model grid finally does not influence their resulting Teff (as can be expected from Figure 5). We will return to this point later. The χ2 procedure weighs each magnitude by its photometric uncertainty; formal errors in Teff and E(B − V) are determined by χ2 contour levels equal to min(χ2) + 1; for Teff, they are within 20% for the majority of the hot stars, and much less for cooler stars, while most uncertainties in E(B − V) are less than 30%.
In addition to gravity, another secondary parameter that influences the derived [Teff, E(B − V)] values from SED modeling is the adopted metallicity, again the effect being less relevant for hot stars. Figure 5 shows that metallicity does not affect colors dramatically; however, it slightly affects the magnitudes (owing to the different line blanketing) and hence the derived radius. Comparison of model spectra with Teff = 50,000 K, for example, shows a difference of less than 10% in flux between solar and 1/100th solar metallicity (the difference being higher around 2000 Å than in the optical, and about 5% between Lyα and 2000 Å). Below we present more comparisons to illustrate how results depend on the assumed metallicity.
A final issue, quite relevant for hot stars, concerns the extinction by interstellar dust. As mentioned above, our model color grids were obtained by progressively reddening model spectra for E(B − V) values increasing in very small steps (0.01 mag) and computing synthetic magnitudes for each reddened model (this is more accurate than applying an average absorption at the λeff of each filter; see Bianchi 2011). We know from UV spectroscopy of hot stars in the MW, Magellanic Clouds, M31, and M33 (e.g., Misselt et al. 1999; Bianchi et al. 1996; Bianchi et al. 2004 and references therein; see also Bianchi 2011 for comparison of known curves) that the selective extinction Aλ/E(B − V) may vary significantly, especially at UV wavelengths and higher UV Aλ/E(B − V) values being often associated with regions of intense star formation (see also, e.g., Calzetti et al. 2005). Such differences in the properties of interstellar dust have negligible effects on reddening of optical colors, but affect the F255W magnitudes (the passband includes the 2175 Å broad feature) and the F170W magnitudes (the Aλ/E(B − V) steepness in this wavelength range varies according to the properties of small grains, e.g., Mathis 1994).
A precise derivation of the UV extinction curve toward individual stars requires UV spectroscopy, but such studies are necessarily limited to a few sightlines. In order to obtain from the photometry an overall indication of what kind of extinction curve is more appropriate for our targets, we have performed the stellar SED analysis assuming different known curves of selective extinction, from the MW "average" with RV = 3.1 to LMC and SMC UV-steep curves, more representative of SF regions and low metallicity, and compared the results in various ways. In Figures 8–12 we show some of the comparisons. We indicate with "RV = 3.1" results obtained from model grids reddened assuming the MW typical curve with RV = 3.1, taken from Cardelli et al. (1989), "LMC2" indicates that we used the curve from Misselt et al. (1999), "avgLMC" labels results assuming the LMC extinction curve in sightlines excluding 30 Dor from Gordon & Clayton (1998), and "SMC" indicates the very steep curve derived along SMC sightlines by the same authors. First, because variations in the Aλ/E(B − V) curve mostly concern the UV wavelengths, we examined which Aλ/E(B − V) curve produces the best agreement between E(B − V) results derived from optical colors only and from UV-to-optical colors. We expect the difference to be appreciable only where the intrinsic extinction (the component that we expect to be peculiar) is significant compared with the foreground MW component. In Figure 8, we examine the effects of dust type on our results by comparing E(B − V) values obtained for the stars with good photometry in all bands, with results obtained using optical colors only, for the same stars (i.e., neglecting our UV measurements). The latter, however, gives much more uncertain results because optical colors are not a sensitive probe of high Teff's and vary little (typically less than the photometric errors) for stars hotter than ∼18,000 K (see Figure 5; also, e.g., Bianchi 2007 and references therein), which limits the significance of the comparison. In fact, Figure 8 is more illustrative of the effects in which the SED-fitting procedure may incur (for hot stars) when no UV information is available. Results are compared using z = 0.002 models, taken as a reference metallicity value, but in fact both extinction type and metallicity influence the derived parameters and it is not always possible to disentangle their effects. In WLM and Sextans A, neglecting the UV information results in lower Teff's for the hottest stars; it also causes the SED fitting to find, for a number of objects, a solution for Teff equal to the highest value of the model grid (50,000 K) with a gap at Teff ≳ 35,000 K, the extent and the limit of the gap depending on the assumed dust type. The smoothest and most consistent distribution is obtained for "LMC-avg" or "LMC2"-type Aλ/E(B − V). A similar effect seems present in Sextans B and in the smaller Pegasus and Phoenix, but the paucity of stars with good photometry all the way to far-UV and larger scatter makes the comparison inconclusive in these cases. In NGC 6822, the most consistent results (and the least deviations to extreme values) are seen when "LMC2"-type Aλ/E(B − V) is assumed for hot stars, and an effect opposite from the other galaxies is seen when an extremely steep, "SMC"-like Aλ/E(B − V) curve is used. In NGC 6822, however, the total E(B − V) for each source includes a substantial foreground component, and the combination of two components with possibly differing dust properties complicates matters further. In all galaxies, assuming MW-type dust (RV = 3.1) causes a clustering of points around Teff ∼ 40,000 K, in the solution accounting for UV photometry, which is not realistic, and indicates that the procedure may not find a "good" minimum and tends to match the SED primarily with E(B − V) adjustments rather than by variations of both [Teff, E(B − V)]. This is a known pitfall of the χ2 procedure, since both free parameters (in our case Teff and E(B − V)), over the range considered induce changes in photometric colors, but at particular regimes one of the two may drive the changes more than the other; the circumstances when this happens vary according to the parameters range, the model grid, and especially the measured colors available, each color being particularly sensitive to some parameter at some range of values. More colors and finer model grids help averting or mitigating such insidious pitfalls, but finally it is the sensitivity of the available colors to the free parameters that drives the limitations of the results. Of course, for stars cooler than ∼25,000 K the agreement is always excellent in Figure 8; it does not make a difference if UV measurements are neglected, because their optical colors are not saturated, on one hand, and dust properties vary only at the wavelengths of the UV filters. Ultimately, this comparison gives more of a sense of the hidden errors the procedure may incur in when no UV information is available for hot stars.
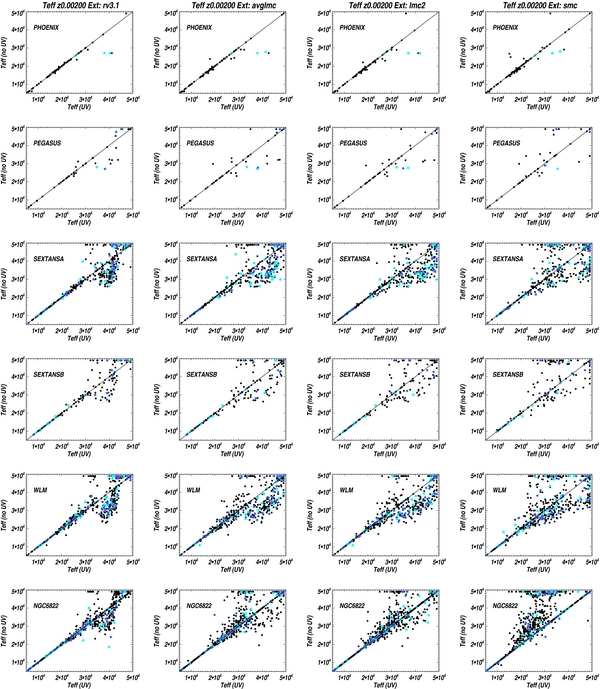
Figure 8. Comparison of derived Teff's from SED fitting, obtained including (x-axis) or neglecting (y-axis) the UV bands. Cyan points mark sources with errors in mF170W and mF255W < 0.15 mag, with smaller inner purple dots if these errors are <0.1 mag. Of course, the comparison has more significance for these sources. More than an indication of which reddening curve or which metallicity is preferable, the comparison highlights known behaviors of the χ2 procedure. For example, when no UV information is used and therefore the E(B − V) parameters are more freely adjustable (the fit is less sensitive to it), the Teff solution tends to fall around preferred values, leaves a gap above 40,000 K, with another cluster of points at Teff = 50,000 K which, however, is the end of the model range, and includes cases where no good fit was achieved. This problem almost never occurs when UV bands are also used (except when the extreme case of SMC-type extinction is assumed). Also, the comparison shows that much lower Teff are inferred for hot stars in WLM and Sextans A when the UV information is neglected, almost regardless of dust-type assumption (similarly, but much less significant, perhaps for Sextans B and the smaller galaxies, when the Teff = 50,000 K points are disregarded). In NGC 6822, this trend instead strongly depends on the assumed extinction curve, and the best consistency is seen for LMC-type dust. It is reasonable to expect very different dust properties within each galaxy, in differing regions and sightlines; however, from the standpoint of a photometric catalog, we can only infer the properties of the majority of the sample. The comparisons shown were made with z = 0.002 models, and differing trends may also reflect different metallicity values to be more appropriate in each case. Obviously, the results are very consistent for cool stars in all cases because the optical colors are not saturated at low Teff and the assumed extinction curves mostly differ at UV wavelengths.
Download figure:
Standard image High-resolution image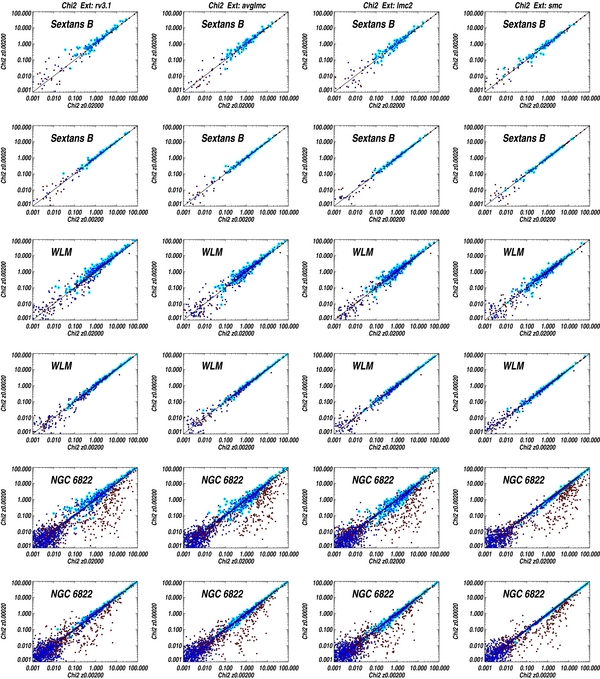
Figure 9. Comparison of χ2 values obtained by including vs. neglecting the UV measurements. Two pairs of metallicity values are compared (first and second row for each galaxy), assuming four different extinction curves (one in each column). Dots circled in cyan have significant measurements in all six bands and good combined errors (this assures reliable photometry but also eliminates highly reddened objects, making the comparison less sensitive to dust properties); red and blue dots mark Teff cooler and hotter than 17,000 K, respectively. MW foreground stars and binary candidates have been excluded. In NGC 6822, a subset of cool stars has clearly better χ2 when low-metallicity models are used (z = 0.0002 or 0.002) regardless of dust type. For the hot stars with good photometry, assuming MW-type dust seems to marginally favor solar metallicity, while χ2 tend to be lower for z = 0.002 if LMC-type dust is assumed. Note that sources with best errors have higher χ2 than those with worse photometry, as expected since χ2 is a measurement of the fit "goodness" relative to the errors. For WLM, solar metallicity gives marginally better χ2 than z = 0.002 for the hot stars (while the comparison between z = 0.002 and 0.0002 is inconclusive). For Sextans B, no significant trend can be discerned, but again there is an indication that the "best" choice of metallicity depends on the assumed dust type.
Download figure:
Standard image High-resolution image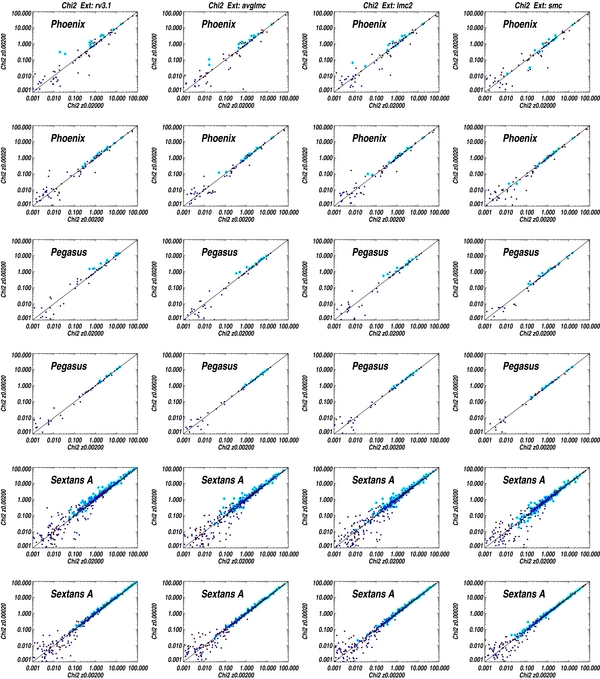
Figure 10. Same as the previous figure, for the other three galaxies of the sample.
Download figure:
Standard image High-resolution image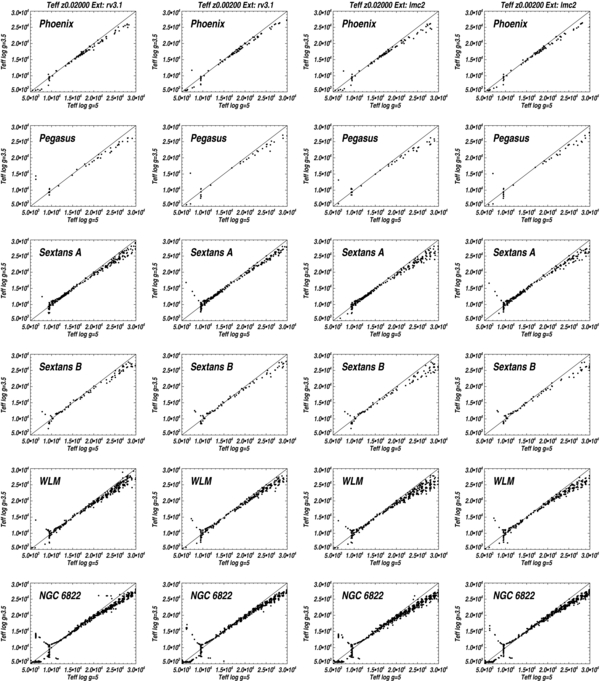
Figure 11. Comparing the Teff values resulting from SED fitting with models with low gravity (y-axis) and high gravity (x-axis). The difference is subtle for stars hotter than 10,000 K, as expected from Figure 5, but for cooler stars two solutions for [E(B − V),Teff] may be possible, a higher E(B − V) leading to hotter Teff, or smaller E(B − V) and cooler Teff, as can be gathered from Figure 6 and from reddening-free indices. When two minima exist in the χ2 distribution, the SED-fitting procedure chooses the formally best one, but the secondary minimum may become the best solution when a slightly different model grid is used. The right gravity can be chosen for cool stars in external galaxies from the derived radius, thanks to the known distance (see the text). The models with log g = 3.5 do not extend to Teff higher than 31,000 K, hence the tendency toward lower Teff solutions near this limit.
Download figure:
Standard image High-resolution image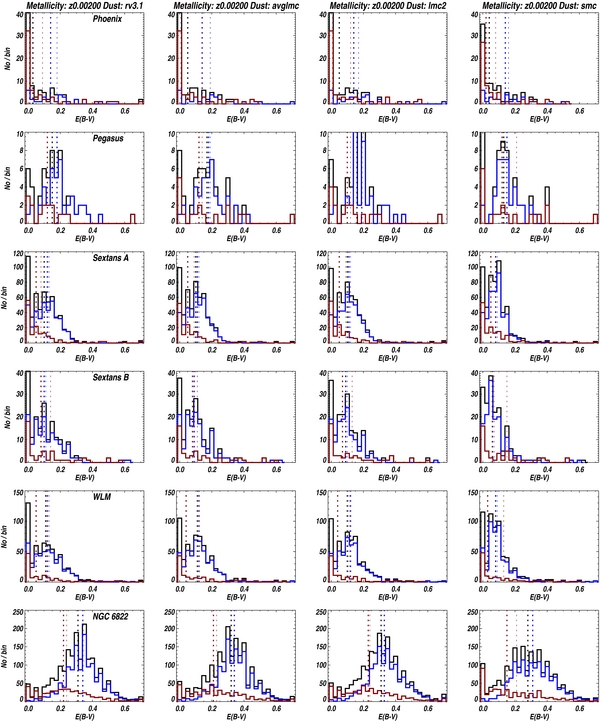
Figure 12. Histograms of E(B − V) values derived from SED fitting of individual stars, assuming different extinction curves. MW foreground stars and binary candidates have been excluded. The distribution and the median value (dotted vertical lines) are shown for all stars (black), for a hot-star subsample (Teff > 22,000 K) and for cool stars (Teff < 12,000 K). When the resulting value from the SED fitting is one extreme of the range allowed in the fitting (E(B − V) = 0 or 0.7 mag in this case), it may be a true value in a few cases but it can also mean that no good fit was achieved and the procedure ran to the end of the grid (especially the E(B − V) = 0.7 mag values). For this reason, we also show median values excluding the sources with E(B − V) = 0 and 0.7 mag (thin dotted lines). Results are stable when a significant sample is available, as is the case for NGC 6822. Not surprisingly, the hot stars are in regions of higher reddening.
Download figure:
Standard image High-resolution imageWe then compared statistically χ2 values from the SED fitting performed under various assumptions (for objects with small photometric errors to avoid blurring the results with "false good" χ2). Figures 9 and 10 show χ2 values to be somewhat reduced for hot stars (in most cases) when solar metallicity is used; it also shows subsolar metallicity to reduce the χ2 for a subset of cool stars in NGC 6822. Note that sources with smaller (combined) photometric errors have larger χ2 (cyan points) because χ2 measures the best-fit-model departure from the data relative to the observational errors, which is a misleading indication of the physical meaningfulness if taken alone, and not considered in conjunction with the photometric errors. Finally, visual inspection of SED fits (such as those shown in the top of Figure 7) for the best cases, and of χ2 contours, indicates, as the other comparisons above, that a UV-steep Aλ/E(B − V) curve often produces better results in the hot star samples, and, in particular, improves the match with the F255W observed magnitudes, in many cases.
We also compared [Teff, E(B − V)] values derived by SED fitting using models with different gravities (Figure 11). In the grids used here, lower gravity models do not extend to Teff hotter than 31,000 K (above which we found UV-steep extinction to be more adequate from the previous comparisons), and this explains in part why log g = 3.5 models tend to give lower Teff toward the upper temperature limit. Over most of the range, the method does not diverge to extreme Teff or E(B − V) values. For cool stars, with Teff < 10,000 K, photometric colors largely differ with gravity (Figures 5 and 6), and the fitting solution may have two actual minima, a lower Teff with lower E(B − V), or a hotter temperature and higher reddening, as one can see, for example, by dereddening the data points along reddening vectors in Figure 6 (the points would intersect the model intrinsic-color curve twice, at two different E(B − V) values), or from classical reddening-free indices, e.g., Bianchi & Efremova (2006) and Romaniello et al. (2002). One or the other of the two minima prevails in the numerical procedure (χ2) when slightly different model grids are used. In such cases, the known distance helps us to assess, by the consistency of Teff and radius, which of the two solutions is more physically meaningful.
It is important, finally, to remember that we cannot expect the dust properties and metallicity to be uniform within the entire sample of each galaxy; in fact, we expect them to largely vary, the UV extinction curves being extreme in regions of high star formation, and the young (hot) stars having possibly higher metallicity than older stars, as indicated also by the existing measurements of metal abundances compiled in Section 1. For this reason, we provide results from our SED analysis obtained under a range of assumptions, the most appropriate combination likely being different case by case. However, from our present standpoint of presenting and examining comprehensive photometric catalogs, we wanted to illustrate the properties of the majority of objects and to look for conspicuous trends and differences among galaxies. Therefore, in the comparisons above and in the following, we only divided the samples in hot and cool stars, which can be taken as a proxy for young/old (most cool stars being low-mass main-sequence objects). When the comparisons show inconclusive trends, they indicate either the limitations of the method and/or actual variations across the galaxy.
5. DISCUSSION: THE MASSIVE STAR CONTENT AND GLOBAL PROPERTIES
In the previous sections we showed how the stellar parameters derived from model analysis of the multi-band photometry depend on the assumed type of reddening and on the assumed metallicity. Such dependence is not very strong for the derived Teff, for hot stars, when average trends are considered. In addition, results over an entire galaxy (or most of a galaxy) population include subsamples with different properties, making the choice of extinction curve and metallicity not unique. Future work, with follow-up spectroscopy, will focus on examining selected regions. For global estimates of the massive star content we adopt, in the discussion that follows, results assuming "LMC2"-type Aλ/E(B − V) curve (mostly based on the comparison of results including versus neglecting UV bands) for stars with Teff > 25,000 K and MW-type dust for the cooler ones; we adopt an average metallicity of z = 0.002 for the sample, but solar metallicity for the very hot stars, except for NGC 6822 where we adopt z = 0.002 (hot stars) and z = 0.0002 (cool, lower mass stars), as suggested by the χ2 comparisons.
5.1. Foreground and Internal Extinction
We examined the resulting E(B − V) values from the SED fitting of individual stars for each galaxy to derive average values and variations across the sample. Our HST fields contain the most conspicuous OB associations and SF regions in each galaxy, except for NGC 6822 (Figure 1), and some small portions of field population. This is reflected in the histograms of the derived E(B − V) values, which are shown in Figure 12. Such histograms show in many cases both a peak around a minimum value, appropriate for the field population (shared by the majority of cool stars), and not surprisingly similar to the foreground value, and another peak at higher E(B − V) values, mostly due to the hotter stars, representative of regions of intense star-formation. The reddening difference between hot and cool stars is more evident when there is a large number of sources; it also depends on the environments sampled by our HST imaging, which include more or less "field" areas in each case. The median values for the total sample, and for the hot and cool stars' subsamples, are shown in Figure 12 and given in Table 3. The average and median values are from the hot and cool stars for which SED fitting was performed (i.e., when sufficient measurements are available, see Table 3). As discussed in the previous section, the exact result depends on the type of extinction curve assumed for hot stars where UV measurements are relevant and therefore various cases are shown in Figure 12 and reported in Table 3. In Table 3, we give values obtained using both the assumption of MW-type dust (RV = 3.1) and "LMC2-type" (Misselt et al. 1999) dust, representing two typical extremes among known extinction curves and for two metallicities. The difference between results from these assumptions again gives an indication of the uncertainty that the lack of detailed information on dust characteristics may cause on the results. Because extinction properties vary along individual sightlines, as is well known in the MW and the MC, uncertainties due to the assumed dust properties somewhat average out in the global results, but can be more severe in individual sources. For all galaxies except NGC 6822, the extinction is very small, and therefore its uncertainties do not heavily weigh on the results and on the estimate of the massive star content. Finally, we recall again that, in more detail, dust characteristics may significantly vary across the galaxy with strong deviations (UV-steep curves) in the cores of SF regions, where the UV radiation from the hottest stars modify grain properties of the "average" ISM. While such level of detail requires spectroscopy, the present photometric characterization is necessarily confined to general terms. In the following discussion and figures, for the stars with good photometry enabling SED fitting we use the individually derived E(B − V) values, and for the rest we adopt the median values from Column 7 or 9 of Table 3 according to their mF439W − mF555W color (bluer or redder than 0.4 mag) or the average between the cool-star and hot-star sample median values. From the SED fitting, we also culled MW foreground stellar candidates and binary candidates (example in Figure 7); these were excluded from the above-derived average values and from the following figures.
5.2. Hertzprung–Russel Diagrams (HRD)
Having derived Teff and extinction for the stars, we can construct HR diagrams for comparison with evolutionary tracks and isochrones, shown in Figure 13. Dereddened absolute magnitudes are scaled using the distances compiled in Column 2 of Table 1. In order to also plot the fainter/redder stars detected in fewer filters where Teff cannot be determined by SED fitting (or by analytical solutions such as reddening-free indices) and therefore would be much less accurate, we plot absolute magnitudes versus dereddened color rather than Teff, Lbol in Figure 13. We overplot isochrones from Padua evolutionary models from Marigo et al. (2008) with the corrections from Case A in Girardi et al. (2010) and Girardi et al. (2008) (which include the isochrones by Bertelli et al. 1994 for initial masses >7 M☉). From the analysis described in the previous sections, we derive the number of hot massive stars within our HST fields in each galaxy. We counted the stars brighter than the MF555W value predicted by the isochrones for (initial) masses of 20 M☉ and 9 M☉ at age = 4 Myr (MF555W = −4.36 and −2.041 mag, respectively) and (MF439W − MF555W)0 <−0.05 mag. We report the hot-star counts in Table 3, with the caveats that (1) they refer not to the entire galaxy, but to the portions included in the HST imaging, which is a fraction of the total area largely varying from galaxy to galaxy; and (2) with this selection, we only count the massive stars of the youngest populations (few Myr), not the evolved ones (given our color cut). In reality, our chosen color cut of (MF439W − MF555W)0 <−0.05 mag may also include some stars on the 10 Myr isochrone, as can be seen from Figure 13; on the other hand, due to the spread from photometric errors, reddening correction uncertainties and metallicity, a more stringent color cut would not be adequate. The uncertainties in the number of massive stars are derived by applying the 1σ error to the photometry and counting how many stars would be included/excluded in our color–magnitude limits. When there is a substantial population along slightly older isochrones, the uncertainty estimated in this way becomes very large. While the HST footprints enclose almost all of the young populations for the small galaxies (except for NGC 6822), as shown in Figure 1, one cannot use these numbers, for example, to infer the density of hot stars and compare it among fields without accounting for the spatial distribution of the star-forming complexes. We will perform further analysis with complementary data and divide the sample in individual star-forming regions, as shown in Bianchi et al. (2011c). In NGC 6822, we observed seven fields (a few others with conspicuous H ii regions were studied in earlier programs by Bianchi et al. 2001b; Bianchi & Efremova 2006), and the stellar counts cannot be directly scaled by area to the entire galaxy, given the great variety of properties and the patchy distribution that the star-forming sites display. For the other galaxies, our HST fields include basically all the regions rich in hot stars, but not the entire galaxy area (Figure 1).
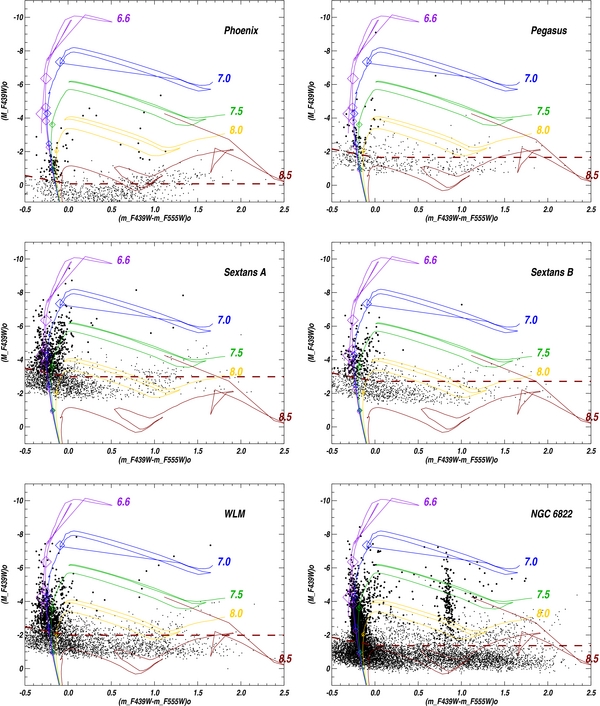
Figure 13. Absolute-magnitude vs. intrinsic-color diagrams. Large dots indicate stars with good photometry (Section 4.2), dereddened with individual E(B − V) values derived from SED fitting; smaller dots are sources with larger errors, dereddened assuming average E(B − V) amounts, as explained in Section 4. The red/dashed line shows the 80% completeness limit of our photometry. Isochrones (Marigo et al. 2008) for z = 0.004 are shown, with log age (yr) labeled. Diamonds on each isochrone mark initial-mass values of 5, 9, 15, 20, 40, and 60 M☉ (from smallest to largest; note that only the youngest isochrone has stars up to 60 M☉ and beyond).
Download figure:
Standard image High-resolution imageBecause Teff and E(B − V) are derived concurrently in the SED-fitting process (both quantities significantly affecting the spectral slope), adopting a different extinction curve results in a different solution for both quantities, as discussed above. For this reason, we report in Table 3 the count of hot stars obtained using different assumptions. Again, variations average out to some extent over large samples, making the differences less relevant than for individual objects.
5.3. Ages of the Young Populations and Massive Star Content
The HRDs in Figure 13 show that all galaxies do have stars along the youngest population tracks, but these are minimal in Phoenix (the only Spheroidal, or transition Sph-Irr galaxy, of the sample) and Pegasus. Note also that the HRD of Phoenix extends to fainter stars, because this galaxy is the closest in our sample (NGC 6822 has similar distance but suffers from higher foreground extinction). Older stars are clearly seen along the 100 Myr isochrone. In this galaxy in particular, the star formation history in older epochs has been studied with HST V − I photometry (which is sensitive to old populations) in the central region by Holtzmann et al. (2000) and Young et al. (2007), who found it to be declining over the past 1.0–0.5 Gyr, with a last SF episode occurring around 100 Myr or 50 Myr (according to these two works, respectively), and a gap before that episode. Such ∼108 yr population was first suspected by Ortolani & Gratton (1988) from ground-based imaging and is clearly confirmed by our HRD, which is more sensitive than V − I even to intermediate age stars. The minimal presence of stars with possible masses above 9 M☉ (Figure 13) would be unnoticeable in these other surveys.
Sextans A and WLM show the most vigorous star-formation in the sample, and two major populations are clearly seen in their HRD (Figure 13), one of a few Myrs of age and the other of a few tens of Myrs. These appear in Figure 14 as concentrations of very hot stars (blue–purple dots) and a more diffuse spread of ∼B-type stars (green dots). In Sextans B we see similar populations, but less conspicuous in numbers than in Sextans A, especially along the youngest isochrone compared with the plume of stars about the log(age) = 7.5 yr isochrone. These differences are reflected in the number of massive stars in Table 3. Remember, however, that in this galaxy only one field was observed, and two and three in Sextans A and WLM, respectively (according to their respective areas of star-formation revealed by GALEX FUV imaging). However, the three galaxies have very similar MV.
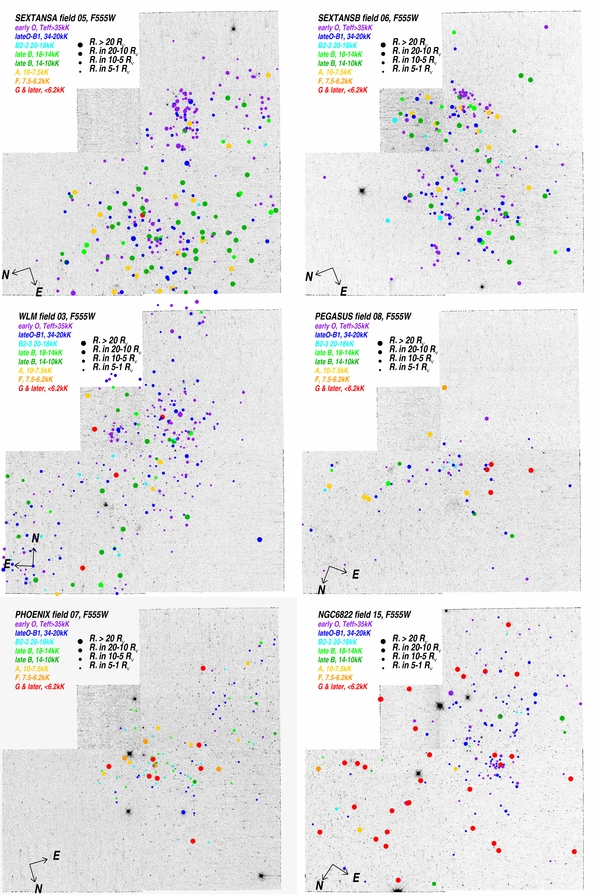
Figure 14.
Sample WFPC2 images (mosaic of the four chips) in the F555W filter; stars with best photometry are overlaid, color-coded by Teff and radius (derived from model analysis, Section 4). All fields are available in the online version and from the author's Web site at http://dolomiti.pha.jhu.edu/LocalGroup. Here we show examples representative of the variety, from youngest compact clumps of hottest stars to sparser slightly older regions. (An extended version of this figure is available in the online journal.)
Download figure:
Standard image High-resolution imageIn the nearer, larger galaxy NGC 6822 where we imaged seven fields, the HRD shows again a very young population stretching along the 4 Myr isochrone up to high masses and older populations as well. We must recall that the higher extinction toward this galaxy also causes larger uncertainty in the extinction correction. MW foreground stars are not negligible at intermediate colors, but not expected at very blue colors.
5.4. Spatial Distribution of the Star-forming Regions
The HST-WFPC2 resolution, from 0.2 pc in Phoenix to 0.7 pc in Sextans B, allows us to examine the spatial distribution of the hot massive stars over entire young associations yet with great detail even in the crowded SF sites. In Figure 14, we overlay the position of the brightest sources with SED-fitting results on the HST images, color-coding the stars by Teff and indicating their derived radius (which means also luminosity) by the symbol size. Only the stars with good photometry in most filters were included in the subsample for SED fitting and are shown, which favors the brightest stars and in particular the hot stars, given our purpose and filter choice; therefore the maps give a snapshot of the youngest populations. Not surprisingly, the youngest and most massive associations also appear more compact (examples in Sextans A, Sextans B, WLM), while lower temperature stars (green and yellow dots), presumably tracing slightly older populations, are more spread out.
Pegasus and Phoenix, by far the poorest in massive stars among our sample, show sparse associations. When looking at Figure 14, one must also take into account that, e.g., Phoenix is three times closer than Sextans A, therefore we are viewing its population comparatively with a zoom-in factor of three, and so for NGC 6822. Moreover, in this galaxy the most massive and compact SF regions were studied by Bianchi et al. (2001b) and Bianchi & Efremova (2006), and the present fields include smaller complexes. Yet, within each galaxy, we invariably find the most massive and youngest associations to be the most compact. Only a subsample of the maps is shown in Figure 14. Similar maps for all fields are posted in the online version and on the author's Web site http://dolomiti.pha.jhu.edu/LocalGroup for this program.
6. SUMMARY AND CONCLUSIONS
We have imaged with HST WFPC2 all the most conspicuous star-forming sites in Pegasus, Phoenix, WLM, Sextans B, and Sextans A, and seven fields in NGC 6822, with a broad-wavelength filter coverage including far-UV and near-UV bands, which enables a better characterization of the hot massive star content than previous photometric surveys. The fields were chosen from GALEX wide-field FUV imaging, which unambiguously reveals the hottest stars (except for heavily dust-embedded star-formation) by minimizing the light contribution from older populations which is conspicuous at optical bands.
For each galaxy we provide a catalog of sources with multi-band photometry, which is complete in wavelength coverage from F170W to F814W for the hottest stars and extends to magnitude ∼24.2 in mF555W and mF439W, with 80% completeness at 22.9 mag. The completeness limit corresponds to at least spectral type B0V on the main sequence for each galaxy, and fainter for the nearest ones. Such limit is fainter by 1–2 mag than Massey et al. (2007) LGGS, enabling a census also of less massive stars. More importantly, the majority of the ground-based sources are resolved into multiple stars at the HST sub-pc resolution, which is critical not only for stellar counts (IMF, total mass estimates) but because measurements of unresolved sources yield composite colors, which bias derivation of physical parameters. Comparison between HST and LGGS photometry shows the latter to be brighter by about 0.08 mag in V and 0.06 mag in B, on average.
We derived stellar parameters and extinction from the multi-band HST photometry, analyzed with model atmosphere grids. We discussed the influence of assumptions regarding extinction curve and metallicity, in the derivation of the stellar parameters. We expounded on such issues both because this paper is the first of a series where the same methods will be applied to the other galaxies of this program, and the results will support further investigations from our published catalogs, but also because they are hardly ever addressed. We find some indication that metallicity of the hottest stars may not be subsolar, or not as low as one-tenth to one-hundredth solar as is found from spectroscopy of old stars (Section 1; see also Mateo 1998), and from our photometry analysis for the cooler stars. Our analysis also suggests that UV-steep extinction curves Aλ/E(B − V) are more appropriate for sightlines where the hottest stars are found. We are pursuing follow-up spectroscopy of the massive star candidates to validate the photometric results for the larger sample and to constrain the choice of dust characteristics. Our future goals include studies of extinction in selected sightlines with UV spectroscopy to complete our understanding of the connection between star formation and dust properties.
Table 3 shows that the hot massive star content varies from a handful of hot massive star candidates in Pegasus and Phoenix to several hundreds in other sample galaxies. We plotted in Figure 15 the number of stars more massive than 9 M☉ versus the galaxy absolute optical magnitude. We recall again that our area coverage is a fraction of the total area (Table 1). However, we do not correct for the area fraction, because our HST fields include virtually all FUV-emitting regions in all sample galaxies but NGC 6822 (Figure 1). In NGC 6822, star formation is patchy (Efremova et al. 2011) and an area correction would be quite arbitrary, therefore we rather indicate the number of hot stars as a lower limit (substantially low) in Figure 15. Over the huge range spanned by our sample, a correlation is evident in spite of the above caveats, between the mass of the very young populations (represented by the number of massive stars) and the overall stellar light from the past epochs (MV). Within this broad trend, however, in more detail Sextans A stands out as having almost twice more hot massive stars (>9 M☉) than WLM with the same MV, and three times more than Sextans B, whose MV is 0.3 mag brighter. The star formation rate in past epochs also differed between Sextans A and Sextans B, the first having an overall substantial rate at all epochs, and substantially higher than Sextans B, which instead formed its stars in two major distinct episodes, one recent and one more than 10 Gyr ago, according to the AGNST systematic study by Weisz et al. (2011a). If we consider the very massive hot stars (>20 M☉), individual variations (with respect to the content of less massive stars) and deviations from a global trend are more evident; however, in addition to the very recent (short time episode) star formation being supposedly irregular in nature (e.g., Skillman 2007), the very small number statistics of the highest-mass stars imply larger uncertainties for their numbers.
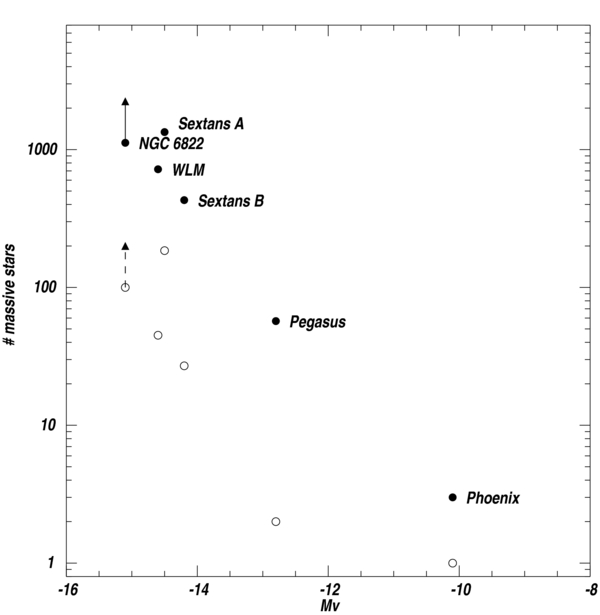
Figure 15. Number of stars more massive than 9 M☉ (filled dots) and more massive than 20 M☉ (circles; the latter being necessarily much more uncertain for the small galaxies) is plotted versus the galaxy optical luminosity. For all galaxies, but especially for NGC 6822, our HST imaging footprint covers an area smaller than the whole optical extent (see Table 1 and Figure 1; Bianchi et al. 2011c). However, our imaging targeted the most conspicuous star-forming regions, in most cases (except for NGC 6822) covering all of them, therefore the number of hot stars counted in our fields and uncorrected by area coverage is more meaningful than applying an area correction.
Download figure:
Standard image High-resolution image
We had also used the preliminary results from this photometric survey, combined with wide-field measurements in far-UV from GALEX, and Hα measurements, to estimate star formation rates for the sample dwarfs (Bianchi et al. 2011c, Bianchi 2010). That work showed, in line with the results on the resolved populations presented in this work, that an accurate knowledge of the extinction properties is a decisive factor in reducing the uncertainties of global estimates, more so when only integrated measurements are available, such as is the case at cosmological distances. We will pursue a further analysis of individual SF regions with corollary data.
Forthcoming papers will present photometry for M31 and M33 from this program, and studies of stellar clusters, continuing the investigations by Hodge et al. (2011, 2010) in M31 with additional corollary data and analysis.
Support for program HST-GO-11079 was provided by NASA through a grant from the Space Telescope Science Institute, which is operated by the Association of Universities for Research in Astronomy, Inc., under NASA contract NAS 5-26555. The data were downloaded from the MAST archive.
Facility: HST (WFPC2) - Hubble Space Telescope satellite
Footnotes
- 5
GALEX, a NASA small explorer, performed wide-field imaging in two UV bands simultaneously: FUV (1344–1786 Å, λeff = 1528 Å) and NUV (1771–2831 Å, λeff = 2271 Å), see Bianchi (2009) and Bianchi et al. (2011a, 2011b) for a characterization of the UV sky surveys; Bianchi (2011) for a review of results on nearby galaxies; and Morrissey et al. (2007) for instrument performance.
- 6
Sextans A and Sextans B are technically not in the Local Group but are included here for consistency with previous surveys.