


ABSTRACT
The complete charge-coupled device light curves in B, V, R, and I bands of the short-period binary system, AE Phe, are presented. It is found that the light curves of AE Phe belong to typical EW-type light variation. Photometric solutions were derived by using the 2003 version of the Wilson–Devinney code. It showed that AE Phe is a W-subtype shallow-contact system (f = 14.6%(±0.5%)) with a mass ratio of q = 2.5491(±0.0092). The temperature difference between the two components is 227 K. Analysis of the O − C curve suggests that the period of AE Phe shows a long-term continuous increase at a rate of dP/dt = +6.17(±0.44) × 10−8 days year−1. The long-term period increase, the marginal-contact configuration, and the astrophysical parameters of the binary system, all suggest that it is a shallow-contact binary undergoing a thermal relaxation oscillation evolving into a detached binary.
Export citation and abstract BibTeX RIS
1. INTRODUCTION
The variability of AE Phe (GSC 08043-00440, HD 9528) was initially detected on Bamberg plates and was reported by Strohmeier et al. (1964). Since its discovery as a W UMa variable in the southern hemisphere by Avery & Sievers (1968), AE Phe has been studied fairly regularly by photoelectric photometry. The photometric investigations of Duerbeck (1978) indicate that the orbit of AE Phe is elliptical. The first photoelectric observations in the UBV system were published by Williamon (1975) who determined system elements by the Russell–Merrill method (Russell & Merrill 1952). By combining 35 photographically determined times of minimum reported by Avery & Sievers (1968), Williamon determined a period of 0 36237459(±0.00000025) for AE Phe and did not find any period change over a short period of time. It was suggested that the two following light elements should be used for time of minimum calculations:

Williamon (1975) and Grønbech (1976) found that the light curves of AE Phe were asymmetric from their observations. Grønbech (1976) found that a maximum brightness occurs at phase 0.25, which is 0.02 mag brighter in the I band. Williamon (1975) found that the secondary eclipse was asymmetric. One year later, Grønbech (1976) used all available times of primary minimum and improved the linear ephemeris as

Because of the asymmetries and the variability of the light curves of AE Phe, comparison with synthetic light curves was difficult. Niarchos & Duerbeck (1991) analyzed four B, V light curves of AE Phe observed between 1970 and 1978 using the Wilson–Devinney (W–D) code. System parameters derived from light-curve fitting showed that although results were in good agreement, the mean photometric mass ratio of qphot = 0.391 was 13% lower than the mean spectroscopic mass ratio qsp ∼ 0.45. Whereas the earlier unspotted modeling by Maceroni et al. (1981) obtained reasonable model fits to B and V band light curves, a later paper (Maceroni & van't Veer 1994 (hereafter M94)) resulted in much improved fits by allowing for the presence of either hot or cool spots. They also gave a linear ephemeris in JD

The most recent analysis of the AE Phe system was reported by Barnes et al. (2004). They presented high-resolution Doppler images of AE Phe. They used Doppler imaging through use of high-resolution spectroscopy to analyze the AE Phe system.
2. THE CCD PHOTOMETRIC LIGHT CURVES
The observations of AE Phe in the B, V, R, and I bands were carried out on 2007 November 3, 4, 5, 6, 7, and 8 with the 0.6 m Helen Sawyer Hogg reflector telescope (f/15 Cassegrain) at Complejo Astronómico El Leoncito observatory, San Juan, Argentina. The field of view of the charge-coupled device (CCD) photometric system is 4 arcmin × 4 arcmin. The comparison star, TYC 8043-424-1, is 4.3 mag fainter than AE Phe (at maximum). It was the only reasonable choice, considering the field of our frames 4' × 4'. The check star, 2Mass J01324426-4931146, is about 1.7 mag fainter than the comparison star. This star is so faint that it is of limited use when assessing the comparison star for non-variability. The scatter (check–comparison) is about 0.1 mag, but there are no measurable systematic variations. The coordinates of the variable star, the comparison star, and the check star are listed in Table 1. Calibrations images (sky flats, darks, bias) were not available for every night, mainly because of bad weather conditions to acquire sky flats at twilight. Also, this telescope does not have a reliable system for acquiring dome flats and hence we do not calibrate the images. In case of any second-order flat-fielding errors (arising from use of limited calibration frames from night to night), the three stars (AE Phe, comparison, and check) were kept on the same pixels of the frame throughout the observing run. The PHOT task (which measures magnitudes for a list of stars) in the IRAF6 aperture photometry package was used to reduce the observed images. The complete CCD light curves in B, V, R, and I bands with respect to the linear ephemeris of Equation (5) are shown in Figure 1. By using a least-squares parabolic fitting method, the CCD times of light minimum were determined and listed in Table 2.
Table 1. Coordinates of AE Phe, the Comparison, and the Check Stars
| Stars | α2000 | δ2000 |
|---|---|---|
| AE Phe | 01h32m32 9 9 |
−49°31'40 8 8 |
| The comparison | 01h32m334 |
−49°28'543 |
| The check | 01h32m443 |
−49°31'137 |
Download table as: ASCIITypeset image
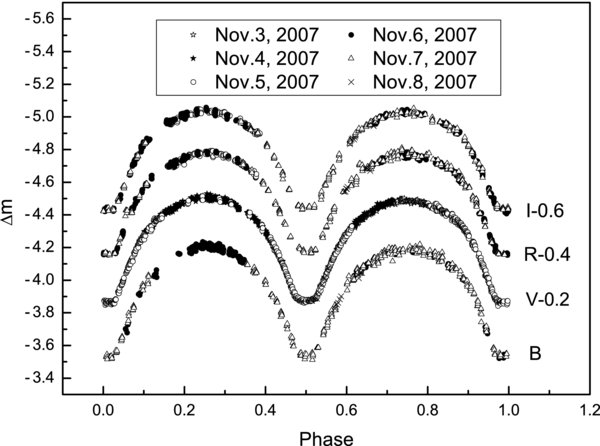
Figure 1. CCD photometric observations of AE Phe obtained in 2007.
Download figure:
Standard image High-resolution imageTable 2. New CCD Times of Light Minimum for AE Phe
| No. | JD (Hel.) | Error (days) | Method | Min | Filter |
|---|---|---|---|---|---|
| 1 | 2454409.6791 | ±0.0001 | CCD | I | V |
| 2 | 2454410.5842 | ±0.0002 | CCD | II | V |
| 3 | 2454410.7661 | ±0.0001 | CCD | I | V |
| 4 | 2454411.6718 | ±0.0003 | CCD | II |  |
| 2454411.6714 | ±0.0003 | CCD | II | R | |
| 2454411.6719 | ±0.0002 | CCD | II | I | |
| 5 | 2454412.5780 | ±0.0003 | CCD | I | B |
| 2454412.5781 | ±0.0002 | CCD | I | R | |
| 2454412.5779 | ±0.0002 | CCD | I | I | |
| 6 | 2454412.7589 | ±0.0003 | CCD | II | B |
| 2454412.7583 | ±0.0003 | CCD | II | R | |
| 2454412.7589 | ±0.0003 | CCD | II | I |
Download table as: ASCIITypeset image
3. ORBITAL PERIOD CHANGE OF AE PHE
To study the variations of the orbital period, we collect all the available photoelectric and CCD times of light minimum from the literature (Williamon 1975; Grønbech 1976; Walter & Duerbeck 1988 (hereafter W88); M94). We revised the M94 published JD times of light minimum to HJD. All the photoelectric and CCD times of light minimum are listed in the first column of Table 3. Using all the available times of light minimum, we obtained a new ephemeris

The (O − C) values (observational times of light minimum-calculational times of light minimum) calculated by Equation (5) are listed in the fourth column of Table 3 and plotted in the upper panel of Figure 2. In Table 3, the first six minima are taken over a period of around 11 days. And yet, the scatter in the O − C is around 0.005. We believe that this scatter is in fact very likely due to measurement uncertainty. And the uncertainty of all the O − C points will effect on the uncertainty of result. As shown in this figure, the orbital period of AE Phe is visible. A least-squares solution yields the following ephemeris

Table 3. (O − C) Values of Light Minimum Times for AE Phe
| 2400000+ | Min | E | (O − C) | Residual | Reference |
|---|---|---|---|---|---|
| 40857.6355(4) | II | −19303.5 | 0.00456 | 0.0015 | Williamon (1975) |
| 40857.8125 | I | −19303 | 0.00037 | −0.0027 | Williamon (1975) |
| 40858.5391 | I | −19301 | 0.00222 | −0.0009 | Williamon(1975) |
| 40860.7137(2) | I | −19295 | 0.00259 | −0.0005 | Williamon (1975) |
| 40867.5979 | I | −19276 | 0.00170 | −0.0014 | Williamon (1975) |
| 40867.7817(2) | II | −19275.5 | 0.00431 | 0.0012 | Williamon (1975) |
| 41969.57079(6) | I | −16235 | −0.00192 | −0.0031 | Grønbech (1976) |
| 41972.65165(6) | II | −16226.5 | −0.00123 | −0.0024 | Grønbech (1976) |
| 41972.83204(6) | I | −16226 | −0.00203 | −0.0032 | Grønbech (1976) |
| 41973.73875(6) | II | −16223.5 | −0.00125 | −0.0024 | Grønbech (1976) |
| 42634.8892 | I | −14399 | −0.00047 | −0.0008 | W88 |
| 42654.8197 | I | −14344 | −0.00048 | −0.0008 | W88 |
| 42662.7922 | I | −14322 | −0.00019 | −0.0005 | W88 |
| 42663.8793 | I | −14319 | −0.00021 | −0.0005 | W88 |
| 42667.8656 | I | −14308 | −0.00001 | −0.0003 | W88 |
| 42671.8517 | I | −14297 | −0.00002 | −0.0003 | W88 |
| 42996.9009 | I | −13400 | 0.00054 | 0.0006 | W88 |
| 43003.7860 | I | −13381 | 0.00055 | 0.0006 | W88 |
| 43020.8177 | I | −13334 | 0.00072 | 0.0008 | W88 |
| 43040.7512 | I | −13279 | 0.00370 | 0.0038 | W88 |
| 43053.7950 | I | −13243 | 0.00207 | 0.0022 | W88 |
| 43064.6664 | I | −13213 | 0.00227 | 0.0024 | W88 |
| 43080.6108 | I | −13169 | 0.00226 | 0.0024 | W88 |
| 43442.6206 | I | −12170 | 0.00136 | 0.0018 | W88 |
| 43732.8819 | I | −11369 | 0.00183 | 0.0025 | W88 |
| 43753.8998 | I | −11311 | 0.00209 | 0.0027 | W88 |
| 43777.8166 | I | −11245 | 0.00227 | 0.0029 | W88 |
| 43797.7474 | I | −11190 | 0.00255 | 0.0032 | W88 |
| 47851.79213(4) | −2.5 | −0.00002 | -0.0008 | M94 | |
| 47852.69841(4) | 0 | 0.00028 | −0.0005 | M94 | |
| 48213.62149(4) | 996 | 0.00002 | −0.0013 | M94 | |
| 48214.70932(7) | 999 | 0.00067 | −0.0006 | M94 | |
| 48215.61454(4) | 1001.5 | −0.00009 | −0.0014 | M94 | |
| 48216.70165(4) | 1004.5 | −0.00016 | −0.0014 | M94 | |
| 48217.60758(4) | 1007 | −0.00021 | −0.0015 | M94 | |
| 48218.69470(4) | 1010 | −0.00027 | −0.0016 | M94 | |
| 48219.60063(4) | 1012.5 | −0.00032 | −0.0016 | M94 | |
| 54409.6791(1) | II | 18094.5 | 0.02008 | 0.0007 | This paper |
| 54410.5842(2) | I | 18097 | 0.01925 | −0.0001 | This paper |
| 54410.7661(1) | II | 18097.5 | 0.01997 | 0.0006 | This paper |
| 54411.6717(3) | I | 18100 | 0.01963 | 0.0003 | This paper |
| 54412.5780(3) | II | 18102.5 | 0.02000 | 0.0006 | This paper |
| 54412.7587(3) | I | 18103 | 0.01951 | 0.0002 | This paper |
Download table as: ASCIITypeset image
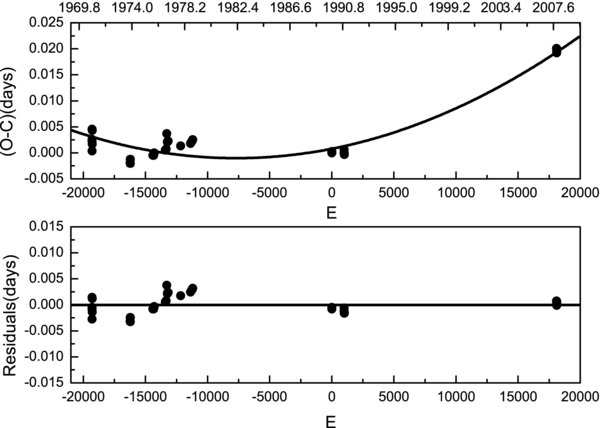
Figure 2. (O − C) diagram of the short-period close binary AE Phe based on all available photometric and CCD times of light minimum. The quadratic fit (solid line) showed a long-term period decrease. Residuals with respect to the quadratic ephemerides are shown in the lower panel.
Download figure:
Standard image High-resolution imageWith the quadratic term of this ephemeris, a continuous period increase, at a rate of dP/dt = 3.06(±0.22) × 10−11 × 2 × 365.24/0.36237354 = +6.17(±0.44) × 10−8 days year−1 is determined. The residuals from Equation (6) are showed in the lower panel of Figure 2.
4. PHOTOMETRIC SOLUTIONS OF AE PHE
The light curves displayed in Figure 1 are almost symmetric (the differences of the two light maximum in all light curves in four bands are all less than 0.01 mag) and show typical EW-type variations, which enable to determine reliable photometric parameters of the binary star. In order to obtain photometric solutions and understand the evolutionary state of the binary system, we analyze the present B, V, R, and I light curves with the fourth version of the W–D code (Wilson & Devinney 1971; Wilson 1990, 1994; Wilson & Van Hamme 2003). The temperature of star 1 (star eclipsed at primary light minimum) was chosen as T1 = 6310 K (Barnes et al. 2004). As shown in Figure 1, the light curves are typical EW type where the depths of both minima are nearly the same indicating the nearly same temperature of both components. Therefore, we take the same values of the gravity-darkening coefficients and the bolometric albedo for both components, i.e., g1 = g2 = 0.32 (Lucy 1967) and A1 = A2 = 0.5 (Rucinski 1969). The limb-darkening coefficients were used according to Claret & Gimenez (1990) (x and y are the bolometric and bandpass limb-darkening coefficients). The adjustable parameters were the orbital inclination i; the mean temperature of star 2, T2; the monochromatic luminosity of star 1, L1B, L1V, L1R, and L1I; and the dimensionless potential of star 1 (Ω1 = Ω2, mode 3 for overcontact configuration). A q-search method was used to determine the mass ratio of the system. Solutions were carried out for a series of values of the mass ratio. For each value of q, the calculation started at mode 2 (detached mode) and we found that the solutions usually converged to mode 3 (overcontact configuration). The relation between the resulting sum Σ of weighted square deviations and q is plotted in Figure 3.
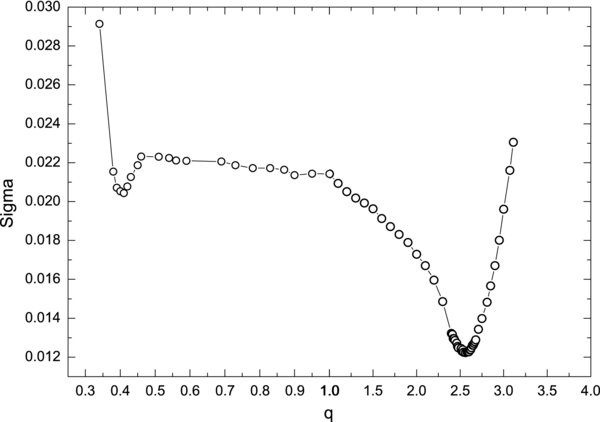
Figure 3. Relation between Sigma and q for AE Phe.
Download figure:
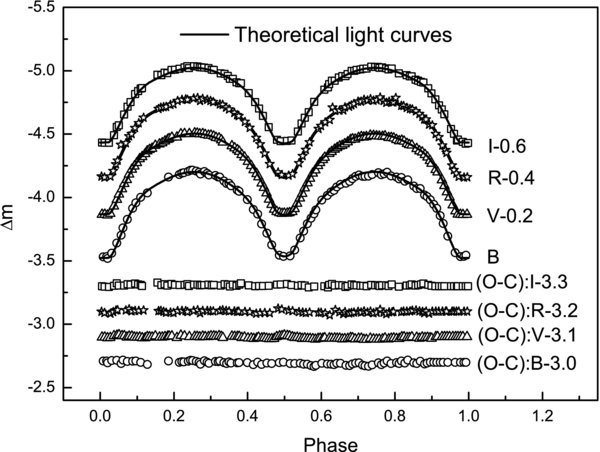
Standard image High-resolution imageA minimum value was obtained at q = 2.56. Therefore, we chose the initial value of q as 2.56 and made it an adjustable parameter. Then, we performed a differential correction until it converged and final solutions were derived. The solution converged at q = 2.5491(±0.0092). The photometric solutions are listed in Table 4 and the theoretical light curves computed with those photometric parameters are plotted in Figure 4. The solution reveals that AE Phe is a shallow-contact binary system with a low degree of overcontact of f = 14.6%(±0.5%).
Table 4. Photometric Solutions for AE Phe
| Parameters | Photometric Elements | Errors | Parameters | Photometric Elements | Errors |
|---|---|---|---|---|---|
| g1 = g2 | 0.32 | Assumed | q (M2/M1) | 2.5491 | ±0.0092 |
| A1 = A2 | 0.5 | Assumed | Ωin | 6.0120 | ⋅⋅⋅ |
| x1bol | 0.644 | Assumed | Ωout | 5.4011 | ⋅⋅⋅ |
| x2bol | 0.646 | Assumed | T2 | 6083K | ±4K |
| y1bol | 0.233 | Assumed | i | 86.45 | ±0.24 |
| y2bol | 0.224 | Assumed | L1/(L1 + L2) (B) | 0.3475 | ±0.0028 |
| x1B | 0.814 | Assumed | L1/(L1 + L2) (V) | 0.3357 | ±0.0022 |
| x2B | 0.825 | Assumed | L1/(L1 + L2) (R) | 0.3288 | ±0.0019 |
| y1B | 0.221 | Assumed | L1/(L1 + L2) (I) | 0.3234 | ±0.0017 |
| y2B | 0.195 | Assumed | Ω1 = Ω2 | 5.9230 | ±0.0031 |
| x1V | 0.724 | Assumed | r1(pole) | 0.2879 | ±0.0003 |
| x2V | 0.739 | Assumed | r1(side) | 0.3011 | ±0.0003 |
| y1V | 0.271 | Assumed | r1(back) | 0.3388 | ±0.0005 |
| y2V | 0.260 | Assumed | r2(pole) | 0.4408 | ±0.0002 |
| x1R | 0.631 | Assumed | r2(side) | 0.4723 | ±0.0003 |
| x2R | 0.647 | Assumed | r2(back) | 0.5014 | ±0.0004 |
| y1R | 0.278 | Assumed | f | 14.6% | ±0.5% |
| y2R | 0.270 | Assumed | Σω(O − C)2 | 0.01220 | |
| x1I | 0.539 | Assumed | |||
| x2I | 0.554 | Assumed | |||
| y1I | 0.264 | Assumed | |||
| y2I | 0.258 | Assumed | |||
| T1 | 6310K | Assumed |
Download table as: ASCIITypeset image
Figure 4. Observed light curves of AE Phe in B, V, R, and I bands and their fits by theoretical light curves by using the W–D code. The lower parts are the scattering of observed light curves and theoretical light curves.
Download figure:
Standard image High-resolution image
5. DISCUSSIONS AND CONCLUSIONS
Williamon (1975) and Grønbech (1976) found that the light curves of AE Phe were asymmetric from their observations. Grønbech (1976) found that a maximum brightness occurs at phase 0.25, which is 0.02 mag brighter in the I band. Williamon (1975) found that the secondary eclipse was asymmetric. In Figure 1, one can see that the asymmetries of the B, V, R, and I bands are all less than 0.01 mag.
Our light-curve solution using W–D code indicates that AE Phe is a shallow-contact binary system with a mass ratio of q = 2.5491(±0.0092) (or q = m1/m2 = 0.3923). The mass ratio obtained by us is close to the spectroscopic mass ratio q = m1/m2 = 0.3935 obtained by Barnes et al. (2004) and qphot = 2.5332 for 1970, 2.6067 for 1973, 2.5226 for 1975, and 2.5675 for 1978 obtained by Niarchos & Duerbeck (1991) who analyzed four B and V light curves of AE Phe observed between 1970 and 1978 also using the W–D code. The orbital inclination of i = 86 45(±024) obtained by us is close to the spectroscopic orbital inclination of i = 8625(±005) obtained by Barnes et al. (2004) and i = 84402 for 1970, 86006 for 1973, 86172 for 1975, and 85339 for 1978 obtained by Niarchos & Duerbeck (1991). We have shown that the W–D code can be used to search for the mass ratio of the binary system using an iterative algorithm from the CCD photometric study for the high orbital inclination contact binary system. The less massive component has a temperature up to ΔT = 227 K higher than the more massive one. The temperature difference of two components 227 K is lower than 410 K obtained by Barnes et al. (2004) from their spectroscopic observations. The degree of geometrical contact, defined by f = (Ωin − Ω)/(Ωin − Ωout), is 14.6%(±0.5%), meaning that AE Phe is a W-subtype shallow-contact binary system. The degree of contact 14.6% is less than these obtained by Niarchos & Duerbeck (1991) (28% for 1970, 25% for 1973, 19% for 1975, 20% for 1978). We believe our solutions are more reliable because they are based on four different band light curves and all the light curves are almost symmetric.
The period analysis in Section 3 indicates that the period of AE Phe is increasing continuously at a rate of dP/dt = +6.17 × 10⁻⁸ days year−1, which can be explained by mass transfer from the secondary to the primary component. Based on the period changes of 30 W-subtype contact binaries, Qian (2001) found that systems showing period increase usually have a higher mass ratio (q > 0.4), while the period of low-mass ratio systems (q < 0.4) show secular decreases. The conclusion was later expanded by Qian (2003) to both W- and A-subtype contact binaries who gave the relations between the period variation and the mass ratio and the orbital period. And the long-term period increase of AE Phe is in agreement with the conclusions. Secular period variations, both decreasing and increasing, are common for W UMa-type binaries. Qian (2003) obtained some statistical relations of contact binaries and pointed out that the combination of the thermal relaxation oscillation (TRO) and the variable angular momentum loss (AML) should drive W UMa-type binaries to oscillate around a critical mass ratio, while the critical mass ratio varies with the mass of the primary component. The long-term period increase may suggest that AE Phe is on the TRO-controlled stage of the evolutionary scheme. As shown in the residual plot of Figure 2, we do not know whether AE Phe shows shorter timescale variations because of the insufficiency of times of light minimum between epochs −11190 and epochs −2.5 and between epochs 1012.5 and epochs 18094.5. To further understand the properties of the variation of the light curve and the orbit period of the south hemispheric contact binary AE Phoenicis, long-term photometric monitoring is needed.
This work is partly supported by Yunnan Natural Science Foundation (Nos. 2005A0059M and 2008CD157), the National Key Fundamental Research Project through grant 2007CB815406, and Special Foundation of President of the Chinese Academy of Sciences. CCD photometric observations of AE Phe were obtained with the 0.6 m Helen Sawyer Hogg telescope at Complejo Astronómico El Leoncito, Argentina.
Footnotes
- 6
IRAF is distributed by the National Optical Astronomy Observatory, which is operated by the Association of Universities for Research in Astronomy, Inc., under cooperative agreement with the National Science Foundation.