
Abstract
Light pollution is a growing concern at many levels, especially for the astronomical community. Indeed, not only does artificial lighting veil celestial objects, it disturbs the measurement of many atmospheric phenomena. The sky brightness is one of the most relevant parameters for astronomical site selection. Our goal is to evaluate the sky brightness of two Argentinian observation sites: LEO ++ and El Leoncito. Both sites were preselected to host the Cherenkov Telescope Array. This project consists of an arrangement of many telescopes that can measure high-energy gamma ray emissions via their Cherenkov radiation produced when entering the earth's atmosphere. In this paper, we describe the measurement methods used to determine whether those sites are valuable or not. We compared our results with the sky radiance of different renowned astronomical sites (Kitt Peak, Arizona, and Mont-Mégantic, Québec, Canada). Among our results, we found that LEO ++ is a good site, however the presence of a low layer of local aerosol can introduce uncertainties in the measurements. Consequently, El Leoncito would be a better option for such an installation. This latter site shows very low sky brightness levels, which are optimal for low light detection.
Export citation and abstract BibTeX RIS
1. Introduction
The Cherenkov Telescope Array (CTA) is the outcome of an international interest in high-energy gamma rays. In order to study this phenomenon, a certain variety of Cherenkov telescopes must be installed to assure accurate and complete data. The CTA is an arrangement of more than 100 telescopes of 23, 12, and 6 m, in both hemispheres. Needless to say, such an infrastructure requires a vast territory. Furthermore, as determined by the CTA consortium,6 the candidate sites must optimize the annual number of hours with suitable observing conditions, and emphasize the expected sensitivity of the telescope arrays, which varies with the elevation, the local geomagnetic field, the darkness of the night sky, and the atmospheric aerosol content (CTA Consortium 2011; Actis et al. 2011).
These characteristics assure data of greater quality, thus maximizing the scientific benefits of the investment. The project's preparatory phase has brought up a number of candidate locations based on an extensive analysis of these key features. Amongst these possibilities, LEO ++ and El Leoncito are sites located in Argentina, LEO ++ (S31°24'22'', W69°29'33'') is found in the Valley of Calingasta, a flat area with an altitude of roughly 1600 m above sea level. El Leoncito (S31°47'58'', W69°17'36'' west), on the other hand, is positioned near the site of the Complejo Astronómico El Leoncito (CASLEO), where the altitude reaches 2600 m above sea level. Figure 1 shows both sites and the nearest cities and towns, as well as the capitals of the provinces of San Juan and Mendoza. Several weather studies were preformed at both sites using similar equipment during the period of 2012–2014. According to De la Vega et al., the sites are very dry, with temperature between -10°C and 35° C, and wind speed below 50 km h-1 (De la Vega 2013). One of the requirement for the sites is the quality of the night sky, and one measure of this is the sky background brightness (SBB). The objective of this study is to provide independent evaluations of the sky brightness at the preselected sites in San Juan province using traditional techniques, such measurements made using sky quality meters (SQM) and from the spectrometer for night aerosol detection (SAND), developed by the Cégep de Sherbrooke group.
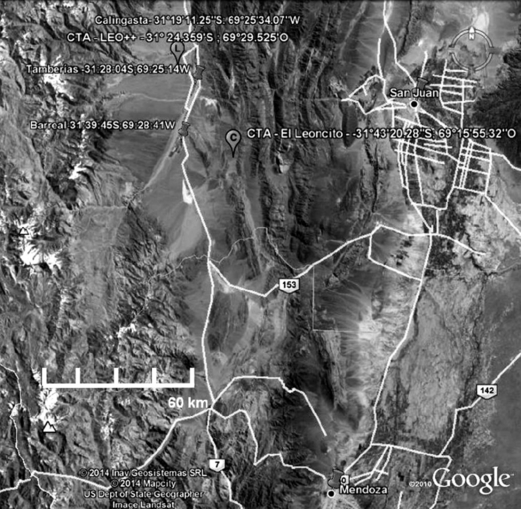
Fig. 1. Map of LEO ++ and El Leoncito locations. Near cities, capitals and main roads are indicated.
To achieve this goal, we gathered data taken with SQM-LR (Sky Quality Meter-Lens RS232) at El Leoncito for 1 year (March 2012–March 2013) and with similar equipment at LEO ++ for 10 months (October 2013–May 2014). On the other hand, we gathered the night sky's spectral measurements with the SAND-4 portable spectrometer (Aubé 2007).7 This procedure is preferable to the classic SQM because, with this method, we can determine precisely the composition of the light sources and also where it comes from (by the addition of a modeling experiment with the ILLUMINA model (Aubé 2007; Aubé et al. 2005). The SQM measures the magnitude of the night sky without providing any information in regards to whether or not the radiation comes from natural sources such as OI sky lines or from nearby cities lights.
Beyond the CTA, the characterization of different sites for astronomical purposes, using complementary techniques, is part of a long-term project of our groups.
In the following sections we present the experiment and the scientific context (§ 2) with a description of the techniques used as part of the presents study: SQM-LR measurements (§§ 2.1 and 2.2) and SAND-4 spectrometer (§ 2.3); the Discussion is in § 3, where the results are organized by technical approach and studied site (§§ 3.1 to 3.3). Finally, the Conclusions are in § 4.
2. Experimental Context
In order to install a telescope, the general requirements for the sky quality of a site involve certain limits for the sky background brightness. In the case of the CTA, the value is 21.5 mag arcsec-2 or better in the V-filter (according the matrix of requirements proposed by CTA Consortium), but this can also be valid for any other astronomical facility. However, the main contribution to this measurement comes from street lights, which in most cities are produced by lamps with Hg, Na, or a mix of both. In the case of an optical observatory, all these elements are problematic, but for the CTA, the Hg contribution must be especially considered, because of the wavelength range in which Cherenkov radiation can be detected. This study demonstrates that the quality of the sky should be studied not only through the standard devices which provide a "global" result for the SBB, but also in a more detailed way, to discriminate the different chemical contents of the outdoor illumination.
To achieve this, we used two different techniques to sample the sky brightness. The first one makes use of Unihedron's well-known sky quality meter, which basically measures the Johnson-V band magnitude inside a large field of view of about 20°. The second technique uses the SAND-4 spectrometer, a low-resolution long-slit spectrometer (spectral resolution of 1 nm) with a much more restricted field of view.
2.1. SQM-LR Instruments and Calibration
We have intercalibrated the two SQMs, comparing simultaneous measurements in order to know the zero point differences, which allows correcting the data for systematic errors. This is equivalent to having all the measurements coming from the same instrument. We collected a large amount of data and calculated the average of the measurements. The average should indicate whether there are some systematic differences between the two SQM-LRs, while the standard deviation is a result of the small temporal changes in the experimental conditions. The systematic differences are lower than the instrument resolution, at least, for the two SQM-LR tested.
The SQM uses a solid state detector with a linear response, which compensates the measurements for the temperature of the detector. Their behavior and characteristics have been studied by P. Cinzano.8 The SQM is designed to measure the sky background brightness in a band encompassing the photometric bands B and V of the Johnson photometric system. The units used by the SQM to measure the surface brightness of extended objects are mag arcsec-2. This astronomical unit is equivalent to the apparent magnitude of the flux emitted by a square arcsecond of the sky. In the case of a sky background brightness measurement, a value of 21 mag arcsec-2 means you have a glow similar to a 21 mag star spread over an area of 1 arcsec-2.
In order to protect the instrument from the environment, it is placed inside an IP55 plastic box. An opening was carved on top of the box and a glass was attached and sealed (see Fig. 2). The glass results in some attenuation of the incoming light, which was measured by pointing the SQM to a black surface under stable light conditions. The glass was alternately removed and replaced to measure its effect. It turned out that the difference between having or not having the glass is 0.19 mag arcsec-2.

Fig. 2. SQM-LR inside a waterproof plastic box (left); window with sealed glass (right).
2.2. SQM-LR Installation
To accurately characterize the night sky conditions at the sites, SQM-LR photometers, which come with an RS232 interface, were used. Its dedicated microprocessor can measure the output frequency of the sensor with high precision, and as the sensor is powered on all the time, the measurements are also more stable. During the laboratory evaluation, we tested the SQM performance according to the temperature changes, taking into account a recent study by Schnitt et al. (2013). The variation in the measurements are lower than the systematic errors of the device reported by the manufacturer. As at El Leoncito and LEO ++, the air temperature ranges from -10°C to +35°C. Under these weather conditions, we thought that a correction to the measurements was not needed. Figure 3 shows the waterproof box, containing the SQM-LR, mounted on the meteorological tower at the extreme of an arm whose function is to avoid the eventual influence of the tower on the measurements. The installations at both potential sites are identical.
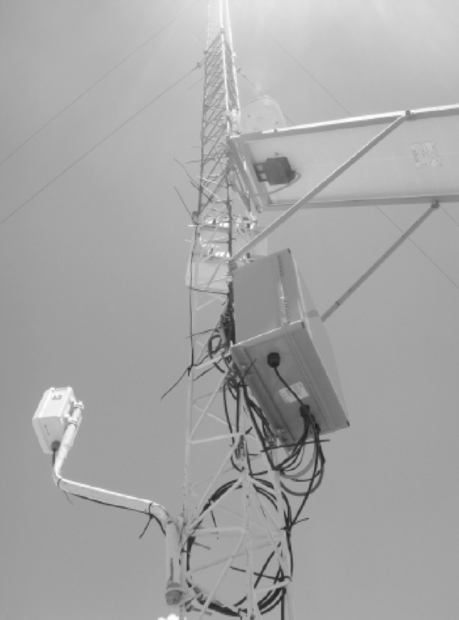
Fig. 3. SQM box mounted at the tower at El Leoncito.
2.3. SAND-4 Spectrometer Measurements
Spectral measurements were made with an instrument that has proven its capacities over the years in various contexts. This instrument, the SAND-4 spectrometer (unit B), is the fourth generation of its kind.9 The SAND platform was introduced in 2005 to evaluate the sky brightness levels for the Mont-Mégantic International Dark-Sky Reserve (IDSR). The device itself is basically composed of a charge-coupled device (CCD) camera and SBIG's DSS-7 long-slit spectrograph. The spectral resolution of the SAND-4 is 1 nm. The slit covers a field of view of ∼2° 22' × 5'. As the DSS-7 is now discontinued, we are looking to replace it with the Alpy 600 spectrograph manufactured by Shelyak Instruments. If successful, this transition will lead us to version 5 of the SAND.
Five specific wavelengths have been identified for being ideal for measurement amongst the visible spectrum emitted by street lights. These correspond to the following sodium and mercury lines: 436 (Hg), 498 (Na), 546 (Hg), 569 (Na), and 615 (Na) nm. They are preferred for analysis because they are not in competition with the Fraunhofer lines or with the atmospheric OI lines, and they are not absorbed by the constituents of the atmosphere. As a matter of fact, except for the 546 nm wavelength, no Fraunhofer line influences the radiance outcome. The 546 nm line overlaps with a secondary Fraunhofer line, the E line. This results in the sum of their radiances, which influences the actual value. However, the impact is restricted to a single condition, the presence of light from the Sun. Indeed, the mercury absorption line comes from the interaction of the lights with the Sun's atmosphere. For this reason, the E line will interfere with the sky brightness only at dawn or in the presence of the Moon. In brief, our radiance will be slightly underevaluated when the measurements are taken in the presence of the Moon or at dawn. Secondly, the atmosphere does not absorb these particular wavelengths. This is vital to an accurate measurement of the sky brightness. Indeed, any atmospheric absorption would reduce the perceived radiance, thus falsifying the results.
For our analysis, we chose to focus on the radiance of two specific wavelengths, 546 and 569 nm. In that order, they correspond with the sodium and mercury lines emitted by the region's artificial lighting. These particular wavelengths were chosen for three reasons. First, artificial lighting is substantially composed of sodium and mercury-based lamps. Thus we can assume that our measurements represent the actual light pollution. Second, the spectral proximity of these two wavelengths is such that we can assume that the atmosphere almost identically affects them. Third, these wavelengths correspond well with the eye's most sensitive region of the spectrum. Therefore, we may validate in a qualitative way the measurements by comparing our results with the visual observation logs we produced while at the sites.
Our data was collected under very specific conditions and time periods in order to have the most representative information of the artificial sky brightness over time according to the orientation in elevation and azimuth. The spectrometer was positioned in order to measure the sky radiance above the surrounding sources of light pollution. The elevation of our instrument varied between 15°, 30°, and 90° above the sources to determine their impact with the greatest precision. These elevations were chosen because they furnish a global view of the sky's light pollution. The exposure time was 3600 s, except for a few captures where the brightness was insufficient to gather a clean spectrum, in which case the exposure time was doubled. This procedure concerns mostly the measurements taken at zenith in the absence of the Moon. As for the direction, we collected the radiance directly over the surrounding cities but also to each side in order to determine the impact of the luminous halos produced by the city's light on our measurements. We attached the spectrometer unit to a robotic mount (Fig. 4) and automated the process of measurement at different elevation and azimuth angles. Before each measurement, individuals validated the orientation and angular level each time there was a change in direction. Also, the lens was checked frequently to ensure that there was no dew or dust. The resulting images are automatically reduced by the program inspectre.bash available from the Google code repository.10 All the control and analysis software can be found on the same site. Subsequently, the spectral sky radiance was approximated using a sixth-order polynomial and six Gaussian functions over the spectral range from 530 to 580 nm. The polynomial was used to remove the continuum radiation (stars, Moon) while the Gaussian functions were used to estimate the fluxes of the spectral lines. Indeed, the area of the Gaussian approximations of the target lines corresponding to the 546 and 569 nm wavelengths determines the radiance. These manipulations were made with Fityk, a powerful open-source curve fitting program. We constrained the full width half-maximum (FWHM) of the Gaussian functions to be fixed at a constant value, since with SAND, the FWHM is determined by the spectral resolution of the instrument. Note that these final manipulations using Fityk were repeated several times in order to validate the radiance and establish a part of the uncertainty of each measurement. Two examples of fit are given in Figs. 5 and 6 for, respectively, the cases of an observation made 30° above Tamberías (9 km distant from LEO ++, population 860) with the Moon up, and 30° above San Juan (80 km away from El Leoncito, population 471,389) without the Moon. It was not possible to have only moonless nights, because of limitations from availability of observing run periods at the observatory.
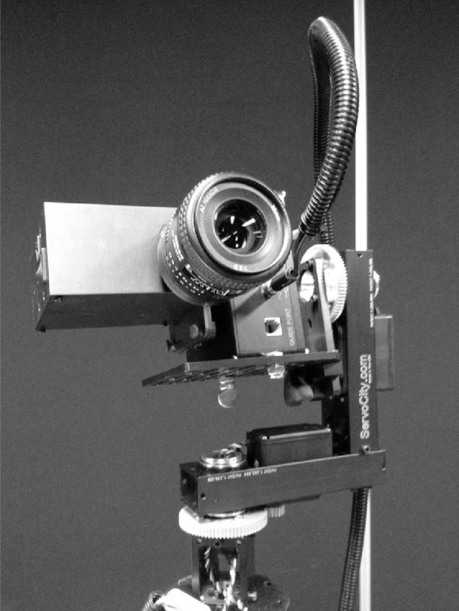
Fig. 4. SAND-4 spectrometer and its robotized mount.
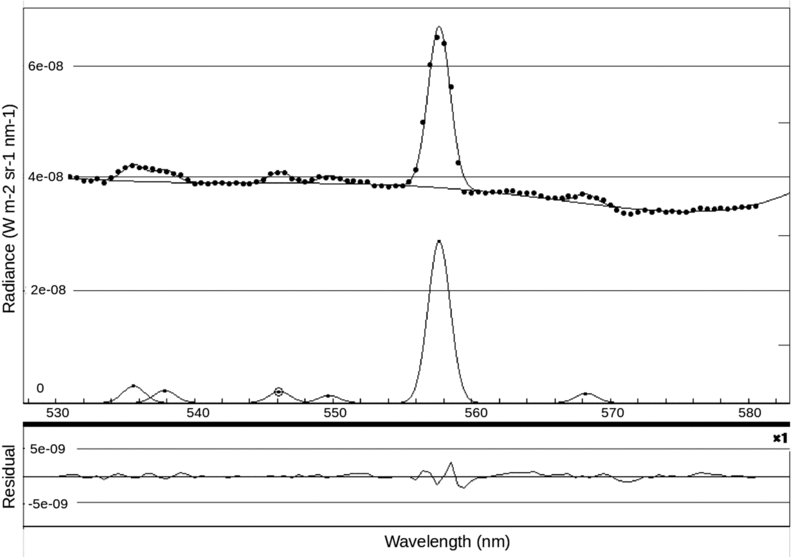
Fig. 5. Multi-Gaussian and polynomial fit of the 530–580 nm region at LEO ++ toward Tamberías 30° above horizon, azimuth 134°. Dots are for the spectral data and black lines show the resultant fit and individual components. The black line in the lower panel is the residual of the fit.
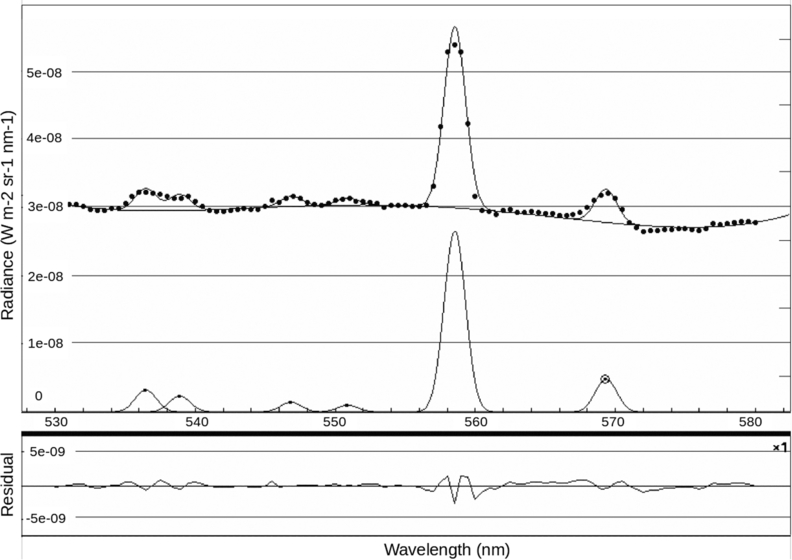
Fig. 6. Same as Fig. 5 but for El Leoncito toward San Juan 30° above horizon, azimuth 67.
3. Results And Discussion
3.1. Sky Background Brightness at El Leoncito
The observations were taken every 15 minutes and were selected taking into account the period of time between the beginning and the end of the astronomical twilight, during clear (without clouds, according images from a full-sky camera installed at CASLEO) and moonless nights. In the histograms, the extreme values correspond to few observations in the limit of the night, which were taken into account only to determine the limit of the twilight by visual inspection, and to small fluctuations produced inevitably by stars, and were accepted. The data obtained with SQM after one year of measurements in El Leoncito are presented in Table 1 and in the histograms of Figures 7 (the average over a year) and 8 (seasonal study), where average values and standard deviation are indicated in the figures. All the measurements at El Leoncito were made with the SQM pointed to zenith. The effect of a single star of low magnitude is negligible in the measurements of SBB, but (for example) 15 stars of magnitude 4 would increase the background by 0.23 mag arcsec-2. This situation is evident during the transit of the Milky Way across the FOV of the instrument: the bulge of the Galaxy contributes nearly one magnitude. By definition, the SBB is a measurement of the general conditions of the night sky, with the lower natural light (stars, Moon) contribution; for this reason, the effect of the Milky Way on this quantity must be removed. The seasonal study (see Fig. 8) provided evidence for the effect of the Milky Way on the SBB measurements; for example, in autumn the contribution by the stars changes the average value of the SBB by almost 0.5 mag.
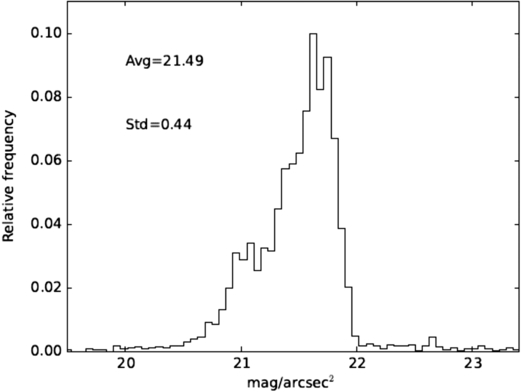
Fig. 7. Histogram for sky background brightness data at El Leoncito.
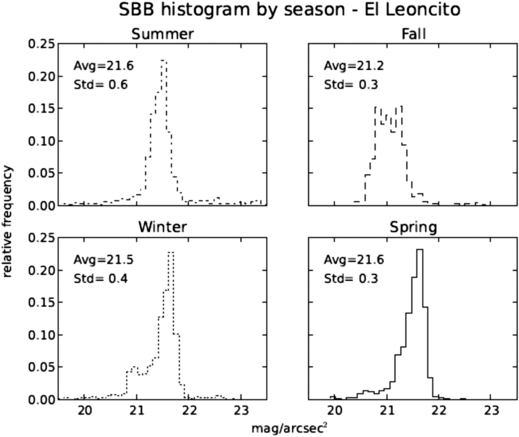
Fig. 8. Seasonal behavior of SBB at El Leoncito.
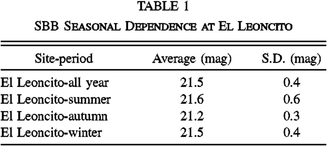 |
Finally, if we apply all the corrections mentioned above, the average of the sky background brightness result is 21.6 ± 0.4 mag arcsec-2 for El Leoncito. This measurement is in agreement with the data obtained at CASLEO, using similar equipment installed at Burek Hill (P. Pereyra 2014, private communication), 9 km distant from the preselected site.
3.2. Sky Background Brightness at LEO ++
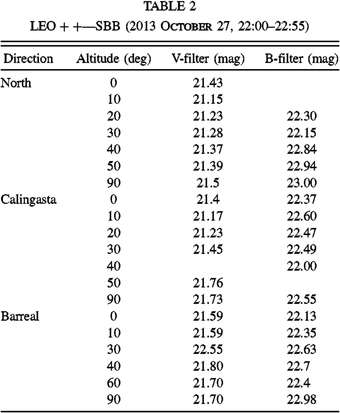
In order to study the dependence on the altitude and the influence of the nearby cities of Barreal (30 km away, population 3202) and Calingasta (12 km away, population 2039) on LEO ++ SBB, we performed observations with an SQM-LU (similar to the SQM-LR but with a USB port). We used the V-filter (standard SQM filter) and a B narrow band filter (with central = 420 nm; FWHM ∼10 nm), for one night (2013 October 27). The results are presented in Table 2.
 |
3.3. Spectral Measurement of the Sky Brightness
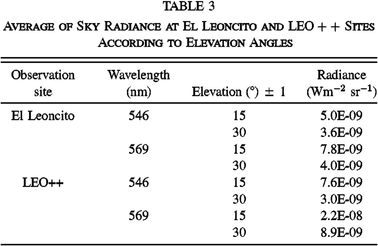
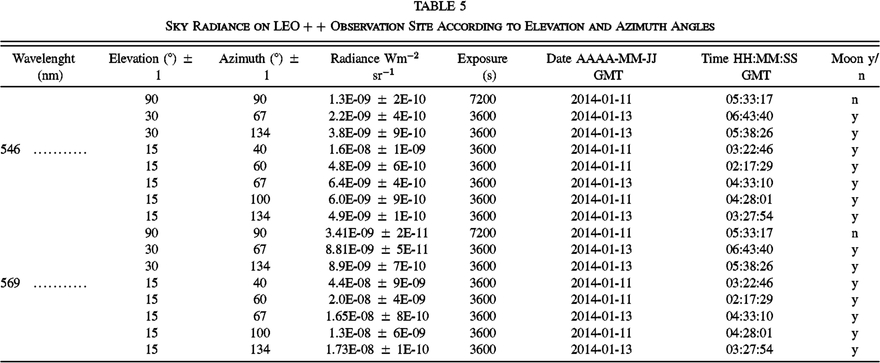
Typical spectrum taken with SAND at MMO (toward Notre-Dame-des-Bois), El Leoncito (toward San Juan), and LEO ++ (toward Tamberías) are shown in Figure 9. Our measurements revealed themselves to be consistent for each site: the relative radiance was, the majority of the time, of the same order of magnitude (10-9 Wm-2 sr-1). As anticipated, the highest values were collected at an elevation of 15° both for El Leoncito and LEO ++. For this elevation, as we can see in Table 3, El Leoncito 15° elevation average a radiance of 5.0 × 10⁻⁹ Wm-2 sr-1 for the 546 nm line and 7.8 × 10⁻⁹ Wm-2 sr-1 for the 569 nm line. As for LEO ++, the 546 nm line averaged a 15° elevation radiance of 7.6 × 10⁻⁹ Wm-2 sr-1 and the 569 nm line 2.2 × 10⁻⁸ Wm-2 sr-1. From this finding, we can deduce that there is a significant difference between the use of sodium lighting and mercury lighting. Indeed, the radiance is greater in the sodium 569 nm line, no matter the elevation angle. However, this difference is less noticeable with increasing elevation angle. Radiances are higher for both wavelengths at LEO ++, but the most important difference is for the 569 nm line. In that case, LEO ++ has a radiance almost 3 times higher than El Leoncito.
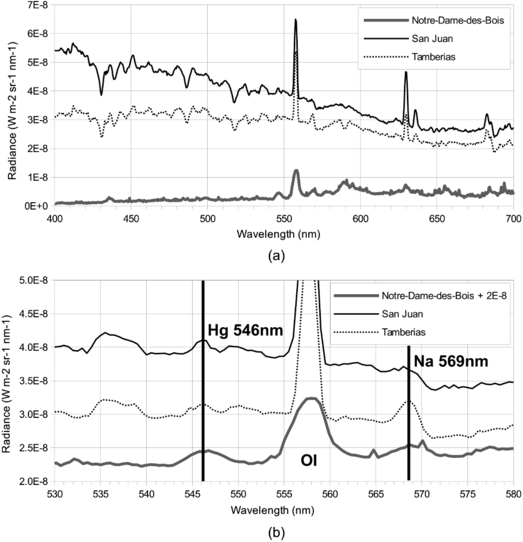
Fig. 9. Comparison of spectrum for MMO, El Leoncito, and LEO ++ for three equivalent orientations 30° above horizon. (a) Different slopes for each curve of upper panel come from the different levels of moonlight scattering in the sky. The case of Notre-Dame-des-Bois corresponds to a Moon-free sky. (b) Zoom on the 530–580 nm region. Note that on the lower panel, we can see that the spectral resolution has changed from 2006 (Notre-Dame-des-Bois) to 2014 (Tamberías and San Juan). In 2006, we used version 2 of SAND that had a spectral resolution of 2 nm, whereas SAND-4 has a resolution of 1 nm.
 |
3.3.1. Spectral Measurement of the Sky Brightness at El Leoncito
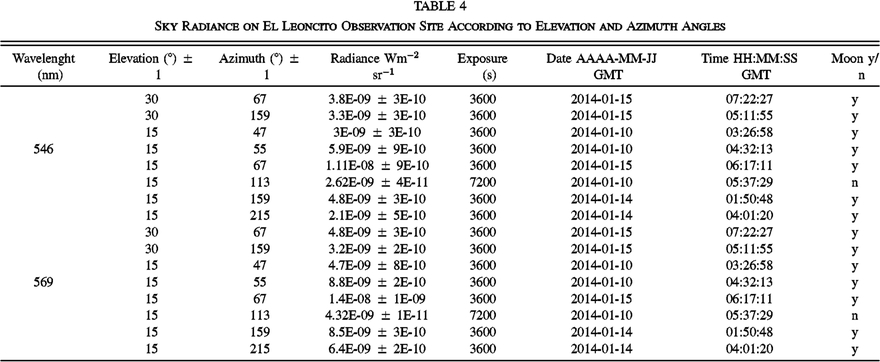
San Juan is the most important source of light for El Leoncito. The ground being rocky, the wind did not produce as much aerosol as it did at LEO ++. As a matter of fact, the presence of aerosols was negligible during our experiment. The presence of mountains surrounding the location partly hid the luminous halos from the nearby cities. The last two nights of our experiment were partly cloudy; this affected our measurements by slightly decreasing the actual value of the radiance. The line fluxes acquired at this site are shown in Table 4.
 |
3.3.2. Spectral Measurement of the Sky Brightness at LEO ++
The small town of Calingasta was the most influential for this particular site. Two factors where particularly detrimental to the sky's quality. First, there was a considerable amount of aerosol due to the presence of dusty soil entrained by winds. This layer of aerosol was principally influential on the measurements at the low angles of elevation. Second, we noticed an excessive amount of artificial lighting on the streets at certain points. Without a doubt, this unnecessary illumination is the primary source of the luminous halo observed. This said, there is a positive outcome to having the majority of the light coming from one source: it is particularly easy to control. There are many ways to reduce the effect of this lighting, such as abolishing the source, reducing its power, redirecting the emission toward the ground, and installing yellow filters. The line fluxes acquired at this site are shown in Table 5.
 |
3.3.3. Comparison with Other Astronomical Sites
These values are compared with some others taken over the last few years at two well documented observation sites to establish whether or not the site is proper to welcome the Cherenkov Telescope Array. These sites are Kitt Peak National Observatory (KPNO) and Mont-Mégantic Observatory (MMO). KPNO is situated in Arizona. Its altitude is 2098 meters above sea level, and the nearest city is Tucson (population 980,263 and lying 70 km away). Tucson is under strict regulation as to the usage of mercury lighting: for this reason the radiance at this wavelength (546 nm) is significantly less than that for other comparable sites. MMO, the first IDSR, is found in Québec, Canada. The city of Sherbrooke is the most important source of light pollution (population 201,980 and 60 km away). MMO is at an altitude of 1111 m above sea level.
As we can see in Table 6, the sky radiance at KPNO in the direction of Tucson is 5.0 × 10⁻⁹ Wm-2 sr-1 for the 546 nm line and 1.66 × 10⁻⁸ Wm-2 sr-1 for 569 nm. The radiance due to the sodium artificial lighting is greater than the radiance due to the mercury line, as expected. With the MMO, the radiance of the 546 nm line is 1.26 × 10⁻⁸ Wm-2 sr-1 and 1.29 × 10⁻⁸ Wm-2 sr-1 for the 569 nm line, in the direction of Sherbrooke. The night sky sodium radiance is similar for MMO and KPNO, but we must stress that the MMO measurements were made during the lamp replacement program, before the region was officially declared the first IDSR. The comparison will employ the values of our measurements at an elevation angle of 30 deg with an azimuth corresponding to a certain city. This elevation is also more or less the limit of the observable sky for many astronomical measurements. As demonstrated in Figure 17 of J.-D. Giguère's M.Sc. thesis (Giguère 2010) and in Garstang (1986), the relative sky brightness decreases logarithmically according to the elevation angle. For this reason, measurements at an elevation angle of 30° are slightly sensitive to specific position of the light domes along the horizon, but higher than that, they do not vary considerably with further change in azimuth. In brief, aiming the spectrometer on top or beside a luminous halo has a small influence on the measured radiance.
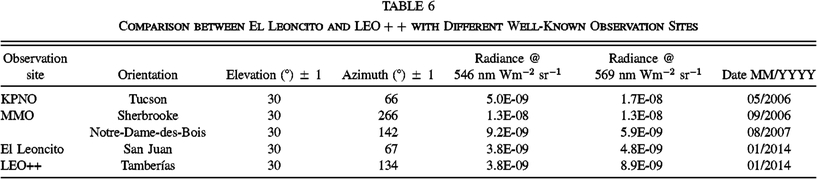 |
Table 5 confirms the resemblance of the radiance of the 569 nm line measured at KPNO and MMO while directed toward the city of greatest influence. Consequently, we can affirm that MMO can be compared with the candidate sites. Due to the lack of measurements at an elevation angle of 30° for a comparable city at El Leoncito and LEO ++, we took notice of the radiance at this elevation angle for Notre-Dame-des-Bois (Canada), which showed similar characteristics to Tamberías. We established a link between those two sites. In fact, as we can see in Table 6, the 546 nm radiance of Tamberías, 3.8 × 10⁻⁹ Wm-2 sr-1, is approximately one-third that of Notre-Dame-des-Bois, 9.2 × 10⁻⁹ Wm-2 sr-1. However, for the 569 nm line, the radiance was higher over Tamberías, 8.9 × 10⁻⁹ Wm-2 sr-1, in comparison with 5.9 × 10⁻⁹ Wm-2 sr-1 over Notre-Dame-des-Bois. As said, it is interesting to know that the light conversion on the Mont-Mégantic IDSR had not been completed at the time of the measurements, which means that, actually, the night sky radiance would probably be significantly lower, especially for the 546 nm line, because mercury-based lamps are now forbidden inside a radius of 25 km centered on MMO. As for the El Leoncito observation site, in the direction of San Juan the radiance for the 569 nm line is 4.8 × 10⁻⁹ Wm-2 sr-1. For a comparable direction, MMO's radiance for the 569 nm line is 5.9 × 10⁻⁹ Wm-2 sr-1. For those same directions, the 546 nm line has a radiance of 3.8 × 10⁻⁹ Wm-2 sr-1 for San Juan and 9.2 × 10⁻⁹ Wm-2 sr-1 for Notre-Dame-des-Bois. The two candidate sites have very similar 546 nm radiances at an elevation angle of 30° above the city of greater influence. In fact, the difference between El Leoncito and LEO ++ is lower than the uncertainties for the 546 nm line. For the 569 nm line, the difference is 4.1 × 10⁻⁹ Wm-2 sr-1 (LEO ++ being the brightest). The 569 nm radiance at LEO ++ is therefore almost double that of El Leoncito. This said, it is important to point out that the measurements are of the same order of magnitude for the sites taken in comparison. Nonetheless, aerosols impact the measured radiance at LEO ++.
4. Conclusion
In this paper, we briefly presented the two locations studied. After which we explained our method of characterization for the CTA's candidate sites in Argentina in addition to the physics fundamentals supporting it. The instruments used for the measurements (SAND-4, SQM-LR, and SQM-LU) were also introduced.
Through our analysis, we demonstrated the legitimacy of the Mont-Mégantic Observatory as a comparison figure for LEO ++ and El Leoncito. This analysis revealed that the three sites were similarly light polluted (in orders of magnitude). In general, both Argentinian sites have an appreciable potential for astronomical installations. However, El Leoncito was distinguished for its lower average radiance (especially for the 569 nm line), for characteristics such as the very low presence of aerosols (lower extinction), and for the presence of the mountains to reduce the impact of the surrounding luminous halos.
We wish to thank the personnel from the CASLEO for their welcome and support during the experiment, and Gonzalo de la Vega from CNEA, who made the first design for the SQM installation and data acquisition and the laboratory tests of the equipment. We also wish to thank our colleagues who helped with the acquisition of the spectral data: B. Hélie, C. Gagné-Deland, A. Torres, J. Dore, and J. Rivard. This scientific misssion would not have been possible without the financial support of: (1) Les Offices jeunesse internationaux du Québec; (2) Cégep de Sherbrooke's international program; (3) Fond de Recherche du Québec–Nature et Technologies; (4) Ministerio de Ciencia, Tecnología e Innovación Productiva, Argentina; (5) Comisión Nacional de Energía Atómica, Argentina; and (6) Consejo Nacional de Investigaciones Científicas y Tecnológicas de la República Argentina.
Facilities: CASLEO
Footnotes
- 6
See https://portal.cta-observatory.org/public/Pages/Instrument.aspx.
- 7
See http://cegepsherbrooke.qc.ca/∼aubema/index.php/Prof/SandEn.
- 8
See http://www.unihedron.com/projects/darksky/sqmreport−v1p4.pdf.
- 9
SAND project [website], consulted May 13, 2014. See http://cegepsherbrooke.qc.ca/∼aubema/index.php/Prof/IllumEn.
- 10
See https://code.google.com/p/sand.