
ABSTRACT
Fourier coefficients are a valuable tool in the study of a wide variety of pulsating stars. In the case of RR Lyrae stars they, can be used to estimate various physical parameters, such as mass, luminosity, metallicity, and effective temperature. They are frequently used to discriminate between different pulsation modes for both RR Lyrae stars and Cepheids. Fourier coefficients have been published for stars based on many different photometric systems as well as for radial velocity measurements. With the release of coefficients from large‐scale surveys and the availability of these data on the Internet, the number of Fourier coefficients available for study has significantly increased, and it is difficult to obtain all available data for individual stars or a given subset of stars. To assist researchers in obtaining and making use of Fourier coefficients, an on‐line archive of published values of Fourier coefficients has been established. Users can search the database using a variety of tools, and the data sets extend beyond the Milky Way to include extragalactic variables. The archive is located at the Web site http://nitro9.earth.uni.edu/fourier/.
Export citation and abstract BibTeX RIS
1. INTRODUCTION
In order to understand some of the physical phenomena associated with variable stars, some have relied upon the data that can be derived from fitting their light curves with a Fourier series and examining the coefficients. Currently, the most common form of the Fourier function used is that given by Simon & Lee (1981), which for V measurements would be defined by
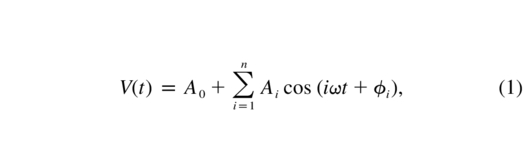
where ω = 2π/period, n is the order of the fit, and t is a time or time interval measured from a certain epoch. The Fourier coefficients are composed of the amplitude values Ai and the phase values ϕi. The amplitude and phase coefficients are frequently combined to provide the following terms:

where the value of j is often set to 1. There are many variations of equation (1) including the use of a series with sine functions, negative amplitude, or negative phase values. The manner in which the Rij and ϕij values vary with period or are related to one another can provide useful information on variable stars. In the case of RR Lyrae stars, the coefficients can be used to estimate metallicities (Jurscik & Kovács 1996), luminosities (Kovács & Jurscik 1996; Kovács & Walker 2001), and other basic physical parameters (Simon & Clement 1993). They can help distinguish between the different pulsation modes—overtone versus fundamental—for both Cepheids and RR Lyrae stars, and they can also indicate the presence of resonances among different pulsation modes (Antonello & Mantegazza 1984; Antonello & Morelli 1996; Antonello 1998; Kienzle et al. 1999).
To assist others in accessing these coefficients, a Web site with published Fourier coefficients has been created.1 The database is composed of values for Galactic, globular cluster, and extragalactic variables. SX Phe stars, δ Scuti stars, RR Lyrae stars, and Cepheids are included. There are several tools available at the Web site to help users find the coefficients that would be of interest to them. A brief history of the use of Fourier coefficients is provided here, followed by a description of the database contents and resources. Some of the aspects of the coefficients will also be discussed here.
2. HISTORY OF COEFFICIENTS
In order to construct a comprehensive database, it was necessary to search for all available coefficients in the literature. A thorough history of the use of Fourier coefficients in astronomy will be provided in another paper (Morgan 2003), although a brief outline is presented here. Generally, a sine or cosine series has been used to obtain the period of a variable star, and the coefficients, Ai and ϕi, were often ignored and not published. The first published use of a Fourier series to parameterize the light curves of variable stars can be traced back to Edward Pickering's adaptation of a formula that he had previously used to define the light variation of Iapetus. When he applied it to variable stars, it was in an effort to discern the cause of their variability. His formula was a low‐order (n = 2) Fourier series,
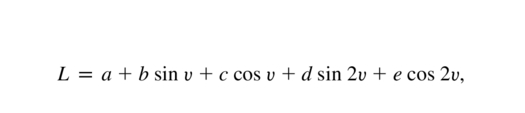
which assumed that the angle of rotation υ and an unevenly illuminated surface were the cause of the light variation (Pickering 1881). Pickering's values compare favorably to current values, in spite of the use of an unusual light measurement system. For example, his value for ϕ21 for η Aql is 4.7, very similar to the value derived by Zakrzewski, Ogloza, & Moskalik (2000), 4.77. He applied this method to four variables, ζ Gem, η Aql, δ Cep, and β Lyr (an eclipsing variable), to test his theory for the cause of variability, which he believed was rotation. Edmund Whittaker (Whittaker & Martin 1911) was the first to use a more contemporary version of a Fourier series and applied it to RW Cas (Cep, P = 14.7949 days). The formula he applied to the photographic magnitudes was extended to n = 6 terms. The photographic‐based coefficients obtained made a very good fit to the observational data, and the phase terms, ϕ21, ϕ31, and ϕ41, are within 6% of the currently derived values (Antonello & Morelli 1996), even though they used a period of 14.81 days for RW Cas.
Over the next 70 years the method was used sporadically, mainly by Martin & Plummer (1913) and briefly by Phillips (1916). Phillips provides us with the first use of the Fourier terms as a method for categorizing variables based upon the values of their coefficients, although he was not certain as to why the stars fell into these various groups when plotted. His classification method was then used by Martin & Plummer (1919; expanding on Plummer 1919) to examine the variables in the globular clusters ω Cen, M3, M5, and M15. They attributed the differences in the Fourier terms (as defined by Phillips) mainly to the number of c‐type RR Lyrae stars in each cluster.
The use of a Fourier series to fit light curves continued, but in only a few cases were the coefficients published—generally the method was applied to test period values and not as a method of analyzing light‐curve characteristics. It is also likely that the lack of any quick and simple methods of computation made the process unappealing to most observers. In spite of these problems, work in this area did continue. Payne‐Gaposchkin (1947) compared the coefficients of a large number of stars including Galactic and Large Magellanic Cloud Cepheids, and both field and cluster RR Lyrae stars. She noted the variation of the Fourier coefficients over period. Although Payne‐Gaposchkin speculated on the cause for the different distributions of the stars in her graphs, she did not reach any firm conclusions.
After Payne‐Gaposchkin's study, the use of Fourier coefficients was not widely applied as a means of studying the physical characteristics of stars. This changed in the early 1980s however when the "modern" form of the Fourier coefficients was presented by Simon & Lee (1981). Since then, there have been numerous investigations that applied the method of Simon & Lee, which involves the fitting of light curves to a cosine formula (eq. [1]) and then using the coefficients to derive the Rij and ϕij values. In those cases where the use of alternative forms of the Fourier series are used, i.e., the use of a sine function or negative amplitudes, the ϕi terms are adjusted by adding or subtracting π/2 or π. The most common alteration in the ϕi terms is changing from a sine function to a cosine, which requires that π/2 be subtracted from the individual ϕi values. The addition (or subtraction) of π to ϕi removes the negative amplitude values. Every effort is made to limit the range of the ϕi values to be between 0 and 2π. Any changes in the ϕi values are also made to the corresponding ϕij values, as defined in equation (3).
As previously mentioned, the coefficients have been applied to numerous problems, including finding resonance effects in variable stars and discriminating the different pulsation modes. Subtler effects such as metallicity variations have been observed in the coefficients of variable stars of clusters and external galaxies. With the advent of large‐scale surveys of the sky, most notably the EROS, MACHO, and OGLE collaborations, the amount of data from these surveys makes the need for an easily accessible database both appealing and practical.
3. DATABASE CONTENT
The Fourier coefficient database is an attempt to place all currently available data into a central location as well as providing bibliographic references and search tools for researchers. The database includes all data concerning intrinsic variables such as RR Lyrae stars, Cepheids, SX Phe, and δ Scuti variables. Wherever possible the original data are provided, although for meaningful comparisons (such as in graphs) the individual ϕi and ϕij values have been transformed to the common system that was defined in Simon & Lee (1981). Radial velocity data are also provided, but are based upon the use of a sine function in equation (1). The database provides the following for each Galactic variable star:
- 1.General Catalogue of Variable Stars (GCVS; Kholopov et al. 1985–1988) data on period, variable type, right ascension, and declination.
- 2.Magnitude‐based coefficient data, including bibliographic source, system of measurement, degree of fit, period used, and coefficients A0, R21 - R41, and ϕ21 - ϕ41.
- 3.Radial velocity and color coefficients, when available, in the same format as the magnitude based coefficients.
- 4.Access to all of the Fourier coefficients for a star, including errors and individual amplitude and phase terms.
- 5.A JAVA graphing utility to display the light curves based upon the coefficients.
Galactic variables are sorted by both constellation and variable type. Type is generally defined by that given in the GCVS, but where this is in error (usually for stars listed as eclipsing variables in the GCVS), a correction is made. For those stars that have uncertain type, most often short‐period δ Scuti, RR Lyrae c‐types or SX Phe stars, the GCVS type is usually used, although it is possible that some have subsequently been identified as a different type. In the case of Galactic variables discovered by large‐scale surveys, e.g., MACHO, EROS, and OGLE, the original survey name and designation are provided, along with a constellation identifier. For example, EROS II survey variable J132412−623424 is listed as EROS2J132412−623424_cen, since it is in Centaurus. Once a name for such a variable is designated in the manner consistent with the GCVS, that name will be used in the database.
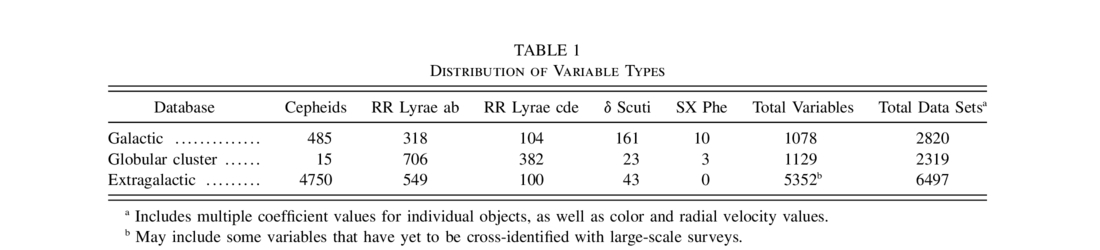
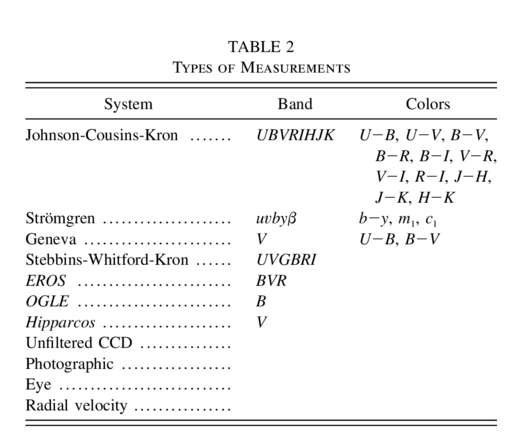
For variables in clusters, the stars are sorted by cluster name, and then are accessible on the individual cluster pages. Data for variable stars in clusters are ordered according to the listing from the on‐line database of Clement2 for the Helen Sawyer Hogg Catalogue of Variable Stars in Globular Clusters. Only magnitude and color coefficients have been published for cluster variables. Extragalactic data are sorted by host galaxy and then ordered by increasing period of the variables. Extragalactic variables that are overtone‐mode Cepheids are noted as such, although suspected Galactic overtone‐mode Cepheids, generally those denoted in the GCVS as CEPS or DCEPS, are not identified as overtone pulsators, since the pulsation mode for many of these is still debatable. At the present time there are data on over 1000 Galactic variables, more than 1100 cluster variables (in 35 different clusters), and over 6500 extragalactic variables. The current distribution of variable types for each database is provided in Table 1. Table 2 indicates the different types of measurements included in the databases.
 |
 |
For every variable in the databases, all coefficient data are accessible by various search engines. One method of searching the data is through the use of a basic search engine that allows the user to select stars according to several criteria including database (Galactic, globular cluster, or extragalactic), period range, type of variable, or type of measurement. There is also a more advanced database search engine that can search according to author code, R21 range, ϕ21 range, specific type of measurement (U,B, radial velocity etc.,), as well as period range and variable type. Output can also be controlled so that only amplitude or phase values are presented by a search. Where ever a value is missing in the database, such as an error value for a coefficient, a value of 99.99 is used. This allows users to maintain consistent columns of data for use in graphs or spreadsheets.
Another search method is through interactive R21 and ϕ21 graphs that users can click on to produce lists of variables. These are divided among the three databases: Galactic, globular cluster, and extragalactic variables. Users may also download graphs of all the photometric values showing how the R21, R31, and R41 vary with log P as well as the log P distribution of the ϕ21, ϕ31, and ϕ41 values. Graphs are available in encapsulated Postscript, PDF, and JPG formats and variable type is designated by a color coding.
4. CHARACTERISTICS OF COEFFICIENTS
The more than 10,000 data sets of Fourier coefficients in the databases can be combined to produce graphs showing the distribution of the amplitude and phase values for the different types of variables. Since the number of coefficients decreases significantly with higher order fits, and often the higher order terms are not available, only the ϕ21 and R21 graphs are discussed here. These are shown in Figures 1 and 2, respectively, and display the RR Lyrae stars and Cepheids in the Galactic and extragalactic data sets. The globular cluster data are dominated by RR Lyrae stars and are not included here, however those graphs, along with the corresponding R31, R41, ϕ31, and ϕ41 graphs for all the variables, are available at the Web site. Only the photometric values are presented in these graphs. This does cause a spread in the data, especially in the case of infrared photometric systems which tend to produce slightly different values compared to the more commonly used V‐band–based values. There is also an artificial clustering of data points at certain periods caused by the inclusion of multiple values for individual stars in the graphs.
R21 (Fig. 1): One rather interesting result is the way that the RR Lyrae ab‐types and the fundamental‐mode Cepheids are located relative to one another in the two data sets. It is clearly seen that the Galactic RR Lyrae ab‐types have values close to 0.5, while the Cepheids are found closer to 0.4. This is not seen in the extragalactic data, which are dominated by variables from the Magellanic Clouds. In this case the RR Lyrae stars are found in a slightly lower range of R21 values, and the Cepheids tend to have similar values as the RR Lyrae stars. The well‐known effect of a lower metal content in the Magellanic Cloud is the main cause for this distribution. The metal deficiency of the Magellanic Clouds results in an increase in the number of short‐period fundamental‐mode Cepheids and consequently their Fourier coefficients follow the trend of larger R21 value with decreasing period. The Magellanic Cloud Cepheids can also be easily divided between fundamental and overtone modes in this graph, in part due to the large number of overtone pulsators. In the Galactic graph, the suspected overtone (CEPS and DCEPS types) are not as numerous as in the extragalactic graph, although they occupy a similar location in the graph. There is also the complication of the inclusion of the Population II Cepheids in the Galactic graph, especially at short periods, which overlap with the suspected overtone‐mode Cepheids. The well‐known amplitude dip near log P ≈ 1 is also apparent in both the Galactic and extragalactic variables, with virtually no difference in its location in the two graphs.
ϕ21 (Fig. 2): In these graphs the photometric systems for the coefficients play a role in the location of the data points. The Galactic variables are based mainly upon the V‐band measurements, while the Magellanic Cloud variables were measured predominantly in the I band. As a result, the extragalactic Cepheids and RR Lyrae ab‐types are found at slightly higher values of ϕ21 compared to the Galactic Cepheids. In spite of these subtle differences, the distribution of variables, particularly the Cepheids, is worth noting. The overtone‐mode Cepheids show a "tilde"‐like distribution similar to the fundamental‐mode Cepheids, although the large amount of overlap makes it difficult to see the distribution clearly. There is also the resonance point for both groups of Cepheids, near log P ≈ 0.2 for the overtone Cepheids, and log P ≈ 0.95 for the fundamental Cepheids. The large number of short‐period Cepheids also causes the distribution of those stars and the RR Lyrae stars to overlap in the Magellanic Clouds, something that is not seen in the Galactic variable graph.
Figures 1 and 2 show how the different Fourier coefficients are influenced by different effects. The Rij terms are most susceptible to changes in metallicity while the ϕij values vary due to differing photometric system. There is also the well‐known variation of the RR Lyrae ϕij values due to metallicity, which is apparent in different globular cluster data sets. These effects have been previously examined in RR Lyrae stars (Morgan, Simet, & Bargenquast 1998) and Cepheids (Simon & Moffett 1985; Andreasen 1988a). Typically light curves observed at longer wavelengths have lower amplitudes (Ai values), and the corresponding Rij values tend not to show any systematic variation since all of the Ai values are similarly altered. Andreasen (1988b) shows how the ϕij values are strongly influenced by the photometric system, mainly in the value of ϕ1, which tends to decrease with increasing wavelength, while the higher order terms (ϕ2, ϕ3, etc.,) are not affected. This results in larger ϕ21, ϕ31, etc., values for longer wavelengths. It should be noted that Andreason's value of ϕ1 is based on fitting equation (1) to light curves where the midpoint of the pulsation cycle is set to the phase where the magnitude is the median value, (Vmin - Vmax)/2. A more detailed analysis of the Fourier coefficients in the galaxy and those in the Magellanic Clouds will be presented in a forthcoming publication (Morgan 2003).
5. CONCLUSIONS
The availability of an on‐line Fourier coefficient database of variable stars will be of use not only to researchers in the areas of observation of Galactic and extragalactic variables but also to those comparing observations to hydrodynamic and nonlinear models of pulsating variables. The coefficients are also useful as a means of deriving physical characteristics of some of the variables and may also help to follow the light‐curve evolution of variables that have varying amplitudes, such as V473 Lyr or Blazkho effect RR Lyrae stars. As more data are made available, they will be added to the database to maintain its usefulness. The coefficients of complex pulsators such as multimode δ Scuti variables will be included in the near future. Anyone who is interested in contributing to the database or who has suggestions to help improve it are invited to contact the author at siobahn.morgan@uni.edu.
This work would have been impossible without several vital Internet resources, including the NASA Astrophysics Data System Abstract Service (http://adswww.harvard.edu) for previously published articles and data, the Strasbourg Astronomical Data Center (http://cdsweb.u‐strasbg.fr) for on‐line access to numerous data files, the Simbad service (http://simbad.u‐strasbg.fr) for cross‐referencing variables, the Sternberg Astronomical Institute (http://www.sai.msu.su/groups/cluster/gcvs) for providing on‐line access to the latest version of GCVS, and Christine Clement's on‐line Catalogue of Variable Stars in Globular Clusters (http://www.astro.utoronto.ca/~cclement). A Professional Development Assignment from the University of Northern Iowa is also gratefully acknowledged for providing support for this project.
Footnotes
- 1
The archive is located at the Web site http://nitro9.earth.uni.edu/fourier/.
- 2
C. Clement 1997, Catalogue of Variable Stars in Globular Clusters, http://www.astro.utoronto.ca/~cclement.