
ABSTRACT
The fraction of light removed from a star's spectrum by the spectral lines, the line absorption, is shown to be a precise empirical indicator of metallicity. We measured the line absorption in 89 class III giant stars in a 42.5 Å window between 6219.0 and 6261.5 Å and then calibrated these values against published metallicities. We show that the line absorption can be measured precisely enough to improve the metallicity precision about fivefold over the original calibration metallicities, reaching a precision of 0.01 dex in favorable cases.
Export citation and abstract BibTeX RIS
1. THE CONTEXT
The general chemical composition of stars is of interest in studies of chemical evolution within our Galaxy and other nearby galaxies, in understanding subtle differences between groups of stars such as open clusters, for opacity effects that produce granulation and absolute magnitude differences, and in numerous other situations. Although a detailed line‐by‐line chemical analysis is necessary for certain studies, a single abundance parameter is often useful, especially when many stars are under investigation. Traditionally, the logarithm of the iron‐to‐hydrogen abundance, normalized to the Sun and denoted as [Fe/H], has been dubbed metallicity. Catalogs of spectroscopic iron abundances have been compiled (e.g., Cayrel de Strobel et al. 1985, 1992; Taylor 1998). In this paper we use the total absorption by spectral lines within a specified wavelength interval as a metallicity index, suitably calibrated with catalog values of [Fe/H]. Our line absorption technique is similar in some respects to a photometric index; it consists of one number per star and requires calibrating the number using stars with known [Fe/H]. Photometric indicators of metallicity have been commonly used, for example, δ(B−V) in the Johnson & Morgan (1953) system (see Jaschek & Jaschek 1990, p. 270, table based on Malyuto & Traat 1981) or δm1 in the Strömgren system (Strömgren 1966; Bond 1980). These and other photometric systems are reviewed by Straizys (1985, 1999). At the same time, line absorption is fundamentally spectroscopic; equivalent widths of spectral lines are simply measured collectively over the specified spectral interval, and no photometric response calibration is needed. In addition, much of the astrophysics, i.e., curve‐of‐growth analyses, oscillator strengths, and model atmospheres, is left in the calibration‐star domain.
The precision with which metallicity can be established is our primary concern in this investigation. Since temperature is the dominant variable determining line strength, a precise and consistent temperature scale is a prerequisite. Our investigation uses earlier work on giant stars (Gray & Brown 2001) in which precise temperatures were established for essentially the same sample of stars we discuss here. The line absorption technique presented here can be applied to virtually any group of normal stars provided one has this kind of precise temperature information.
Metallicity error in the spectroscopic context often falls in the range 0.05–0.10 dex. Taylor (1998) indicates that the characteristic [Fe/H] error in his tabulation is 0.1 dex. Photometric metallicity errors are generally of this size or larger. For instance, Bond (1980) found errors of ≈0.15 dex using the m1 index, while Crawford & Perry (1976) found ≈0.22 dex with their photometric index. Using very narrowband photometry, Nissen (1981) got errors of 0.1 dex. Edvardsson et al. (1993) encountered errors of ≈0.074–0.098 dex when photometric and spectroscopic studies were compared. We show below that line absorption measurements are capable of improving the resolution in metallicity for giant stars to about 0.01 dex in favorable cases.
2. PROGRAM STARS AND OBSERVATIONS
As explained in Gray & Brown (2001), G and K giants were selected using Hipparcos parallaxes to discriminate against non–class III stars. We used 213 exposures on 89 stars of spectral types G5 III–K3 III. The program stars and their dates of observation are listed in the first three columns of Table 1. All observations were taken at the Elginfield Observatory at the University of Western Ontario. Most of the spectra were recorded with a Reticon self‐scanned diode array mounted in the 668 mm focal length camera (see Gray 1986). A few additional exposures were taken with a CCD detector mounted in the 2080 mm focal length camera (see Gray 2001). The resolution was approximately 100,000, but substantially lower resolution would have served just as well for this work. Each exposure was divided by a flat‐field lamp to remove diode‐to diode differences in sensitivity. The signal‐to‐noise ratio in the continuum ranged from 185 to 905 with a mean of 584 and a median of 599.
 |
The chemical species within this spectral band are dominated by neutral iron and vanadium, but there are also significant lines of nickel, titanium, silicon, and scandium. For most stars, these lines span all portions of the curves of growth. Excitation potentials lie between 0.3 and 5.6 eV. In Table 1, the temperatures and their errors are from Gray & Brown (2001) while the [Fe/H] values and their errors in column (5) are from Taylor (1998). The average [Fe/H] error for our program stars is 0.0525 dex.
3. MEASUREMENT OF LINE ABSORPTION
Twenty continuum windows were selected within the 6219.0–6261.5 Å section of the exposures. At each continuum position, three contiguous data points were averaged. A cubic spline was used with these averages to normalize to unit continuum. Figure 1 shows a sample exposure and the selected points. The number of points is not crucial, but their placement and precise replication in each exposure are. We sought out continuum sections that remained relatively untouched by lines at all levels of line absorption. This becomes increasingly difficult toward the coolest, most metal rich stars in our sample. It is worth noting that consistency is the important thing; the normalization points need not be true continuum. This is an important point to bear in mind if the line absorption technique is applied to faint stars using relatively low spectral resolving power.
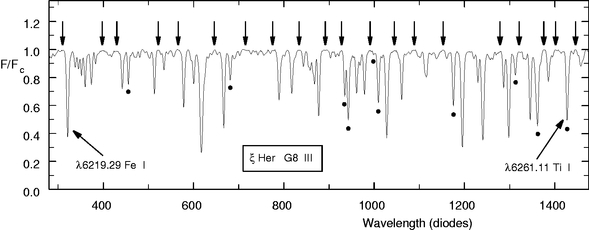
Fig. 1.— This exposure shows the region over which the line absorption was measured. The continuum was set by cubic spline interpolation between the points indicated by the arrows. The first and last indicated points set the integration limits. Lines masked out for the masked line absorption measurements are marked with filled circles.
After continuum normalization, the spectrum is integrated by simple summation between the first and the last points, and the fraction or percentage of light lost to line absorption is obtained. These values are listed in Table 1 in column (6). Repeated measurements of the same spectrum show that consistency errors are ≈0.03%. For 71 stars we have more than one exposure. The standard deviations from these multiple exposures are given in Table 1 following the line absorption entry for the first exposure; the average standard deviation per exposure is 0.09%.
As expected, the strengths of spectral lines vary strongly with temperature. Figure 2 (open circles, solid line) shows this dependence and the least‐squares straight‐line fit to the observations. All 213 exposures are shown separately in the figures. The scatter in line absorption about this line arises largely from differences in metallicity, with combined measurement and temperature errors (temperature errors converted to line absorption errors through the slope in Fig. 2) contributing only 0.18% of the scatter on average, which is smaller than the symbol size in Figure 2. The contribution from the temperature error is actually 0.14% on average, i.e., substantially larger than the line absorption measuring error. It therefore became clear that reducing the slope in Figure 2 would be advantageous. To this end, we measured the line absorption a second time using a mask to remove the most temperature‐sensitive features, mainly vanadium lines. These lines are marked with filled circles in Figure 1. The mask is simply a tabulation of ones and zeroes, with blocks of zeroes running across the span of the temperature‐sensitive features. The spectrum is multiplied by the mask prior to integration for the line absorption, so the process amounts to omitting small wavelength intervals from the integration. The results are in Table 1 in column (7). The temperature relation for the masked line absorption is also shown in Figure 2 (plus signs, dashed line), and the translation of temperature errors through this new relation gives an average scatter of 0.08%, an improvement of nearly a factor of 2. When combined with the measurement error, the gain from masking is still ≈25%. This improves by the same factor the metallicites we infer from the line absorption in the next section.
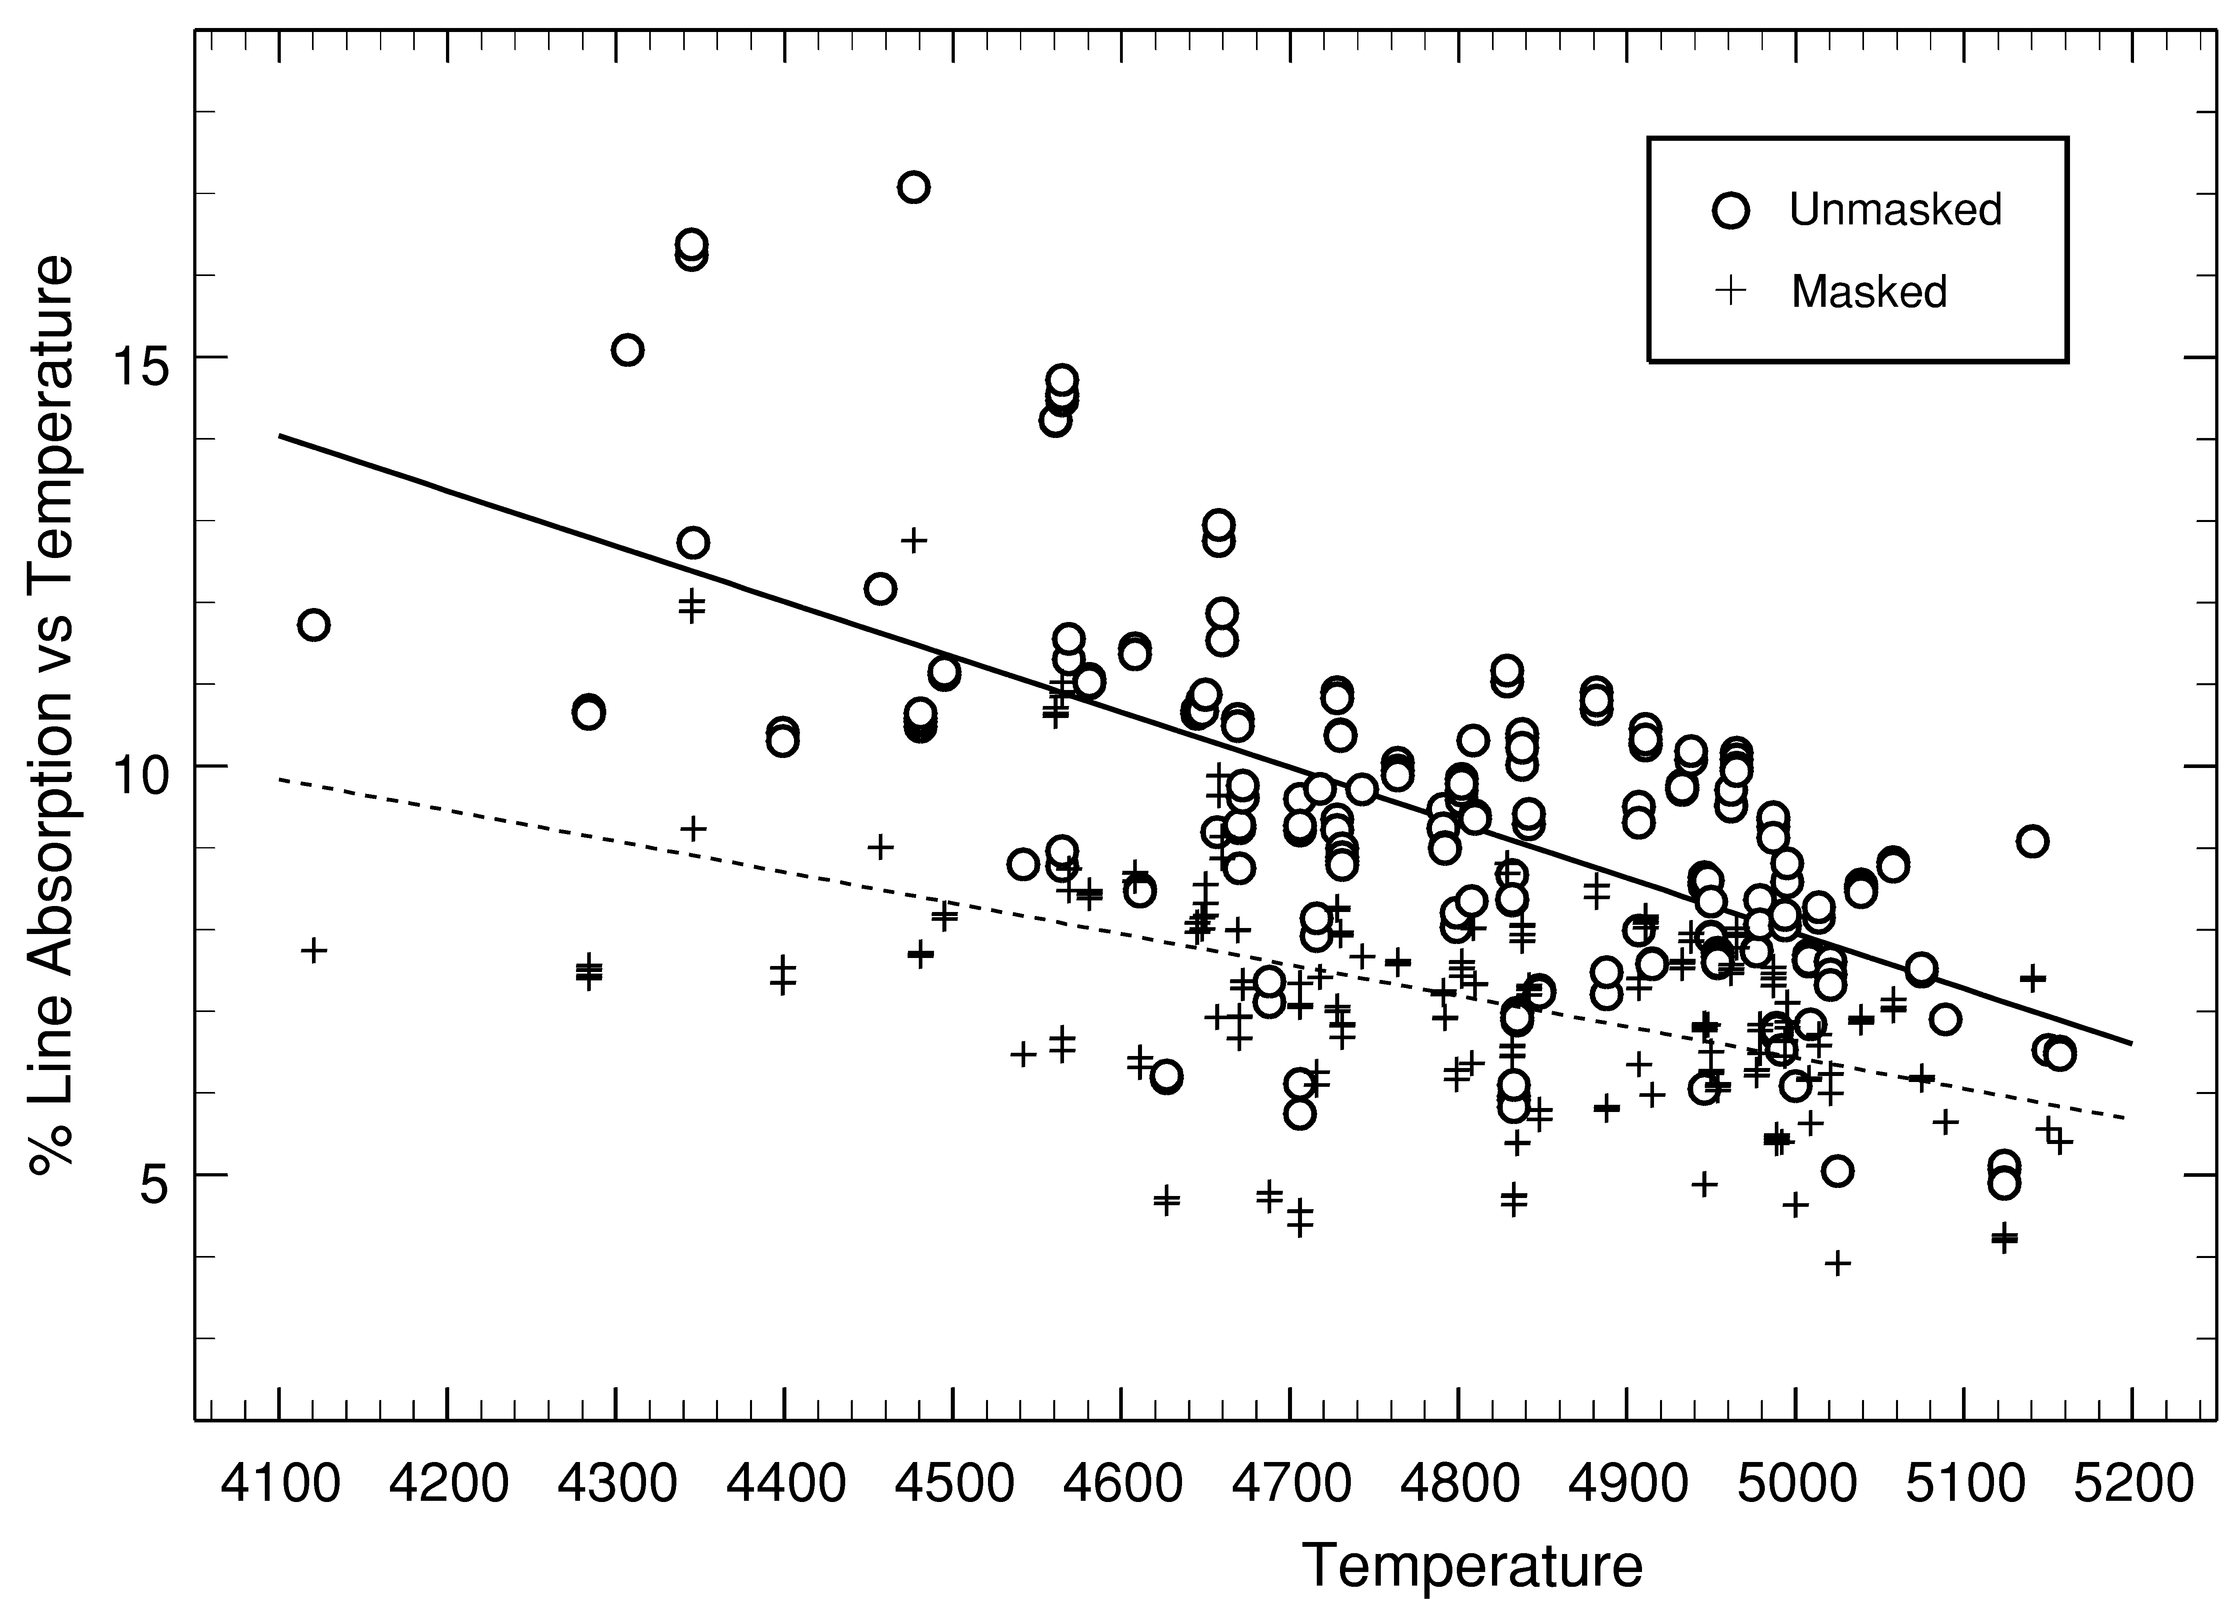
Fig. 2.— Basic temperature variation of the line absorption is shown here. The open circles are the unmasked measurements; the solid line is a least‐squares fit. The plus signs are the masked values, and the dashed line is the least‐squares fit for them. Scatter about these lines is the metallicity index.
We note in passing that while the slope of the correlation affects how temperature errors propagate, the actual nature of the correlation is not critical because calibration with known [Fe/H] is not done until the next step in the analysis.
4. LINE ABSORPTION AND METALLICITY
In Figure 3, we show the deviations from the temperature dependence, given by the dashed line in Figure 2 (masked line absorption), as a function of metallicity. The bifurcation of the points toward higher metallicities results from line absorption having different dependence on metallicity in different temperature regimes. Although the dependence of line absorption on metallicity changes smoothly and continuously with temperature, two temperature classes adequately allow for the differences seen in our program stars, and a more‐or‐less arbitrary choice of 4830 K was used as the boundary between them. In this way, the data are adequately represented by two polynomials that are essentially the same for [Fe/H ]< -0.1. There are too few measurements for [Fe/H ]< -0.5 to adequately define the relation(s), but with this caution, we use the curves as shown for the following analysis.
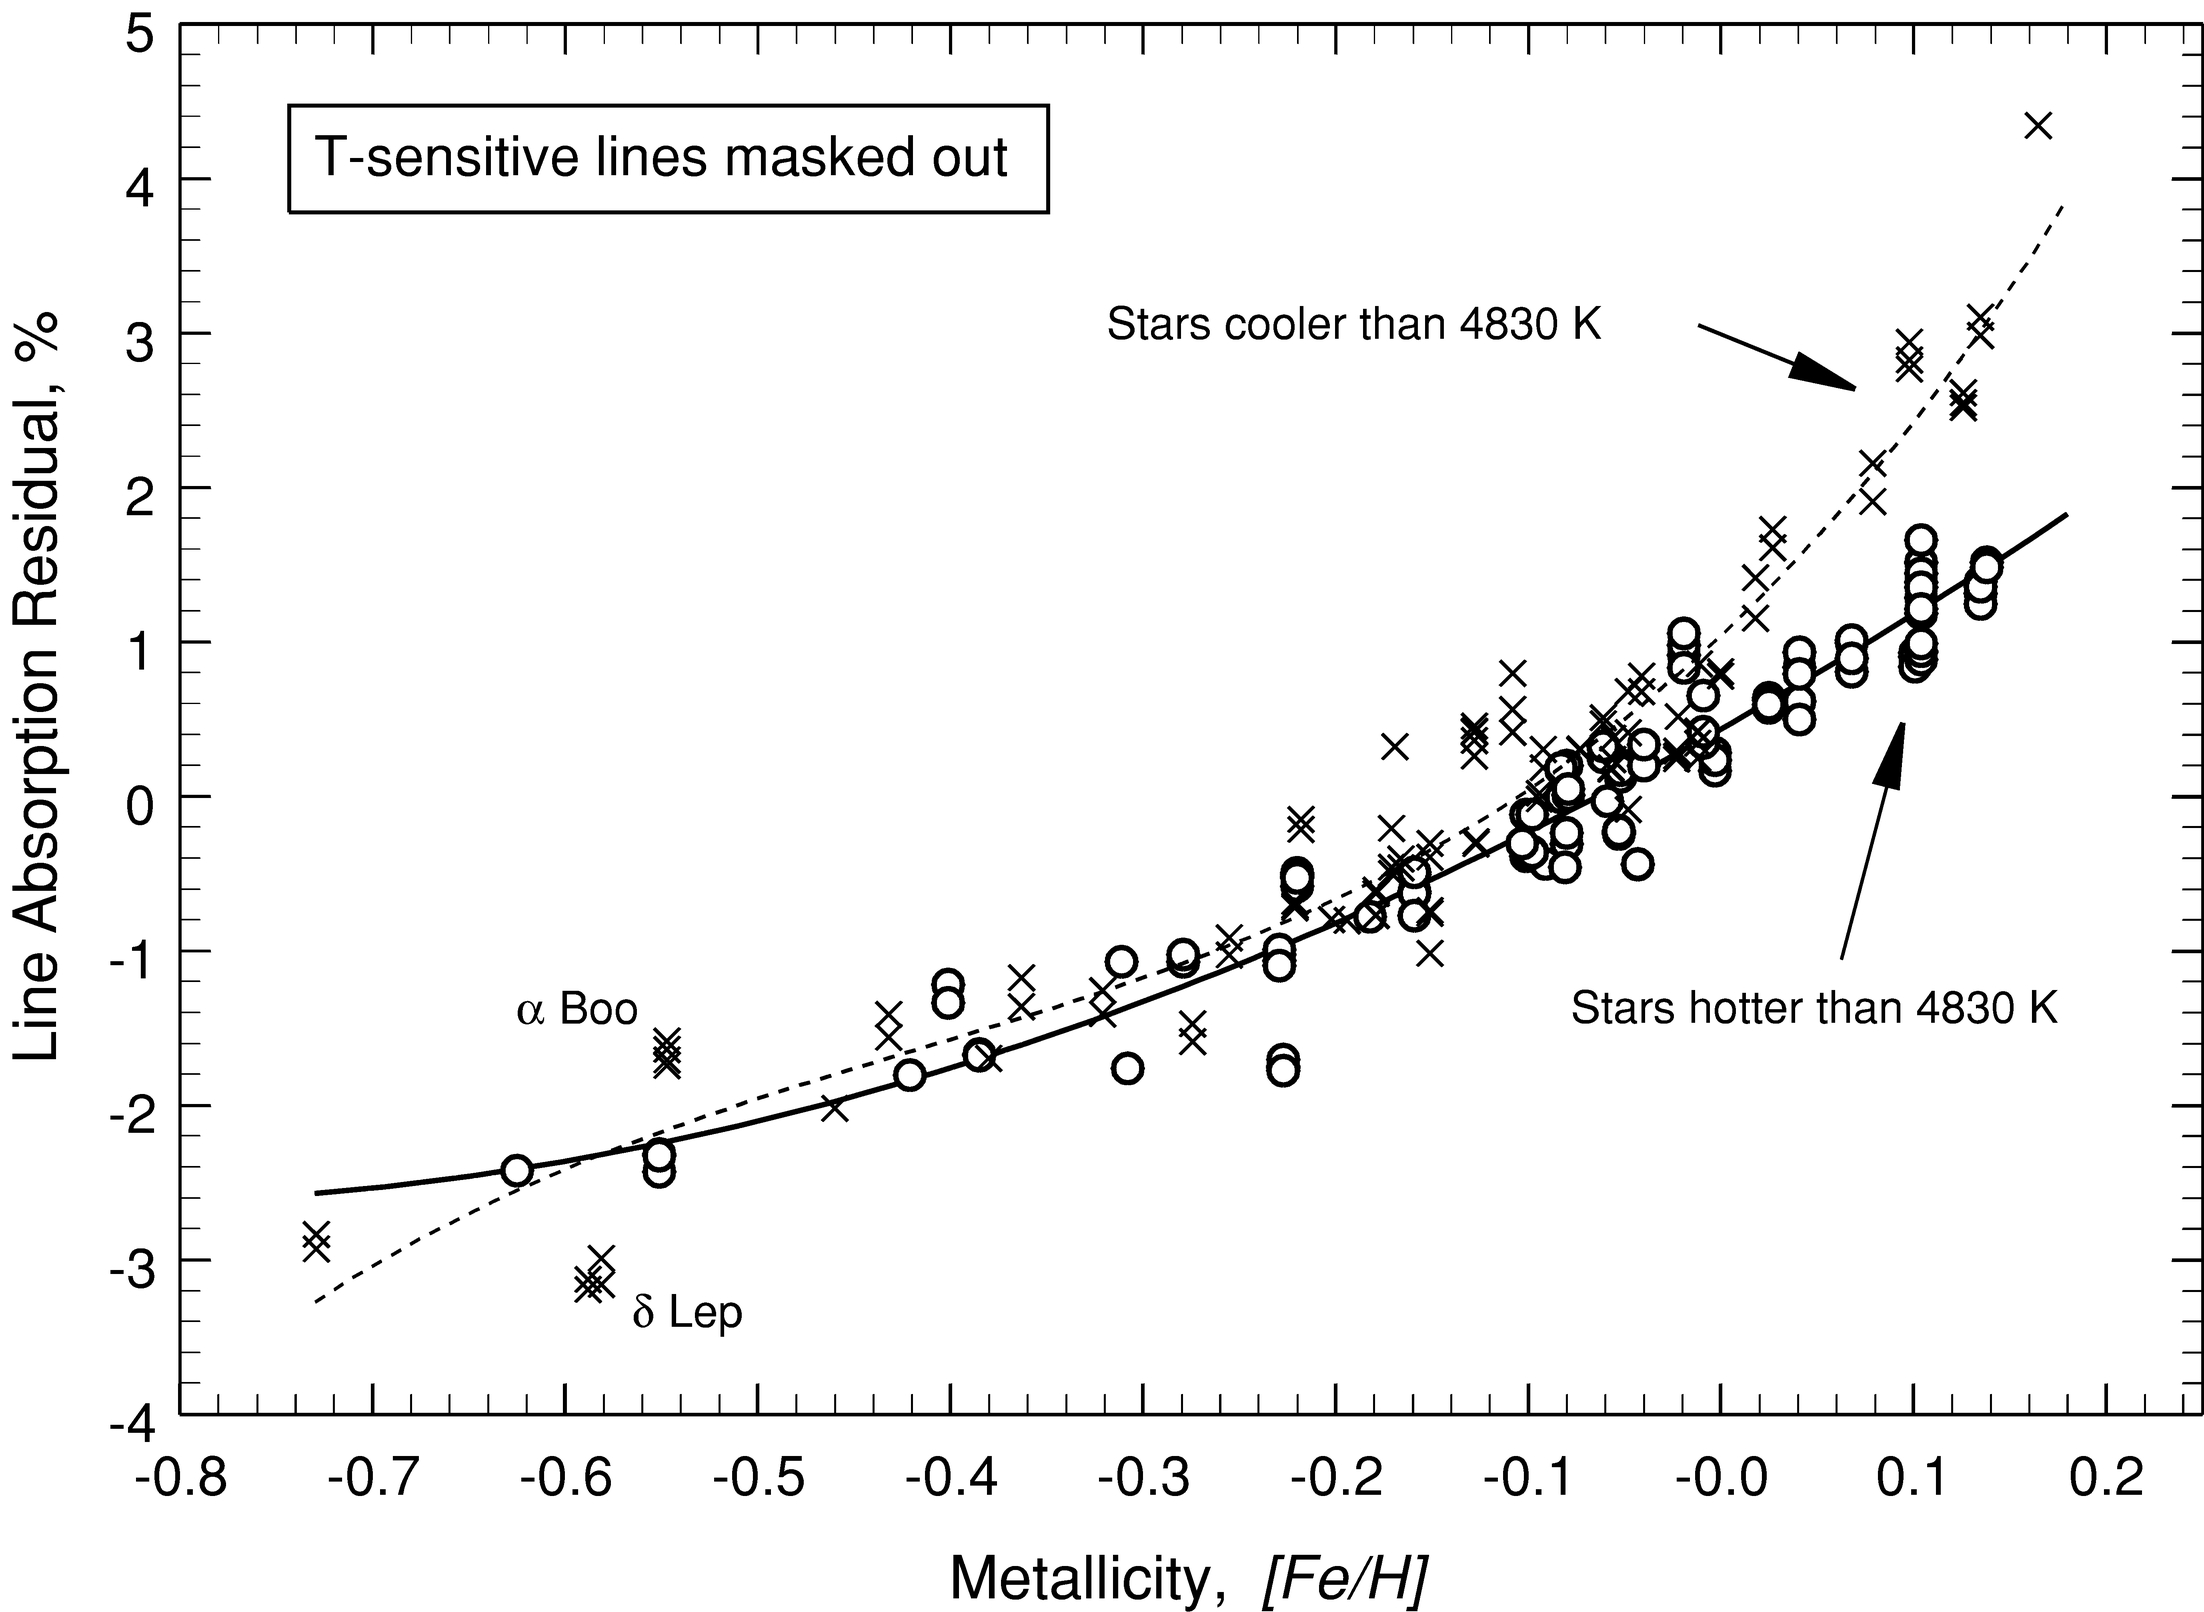
Fig. 3.— Masked line absorption residuals from Fig. 2 are plotted against [Fe/H] from the catalog of Taylor (1998). The relation between these two variables changes slowly with temperature, but two temperature classes are sufficient for our program stars. The boundary between them is taken to be 4830 K. The lines are polynomials fitted to the two groups. There are too few points with [Fe/H ]< -0.5 to adequately delineate the curves.
We now turn the relations in Figure 3 around and use the line absorption to infer metallicity. The gain here comes from the fact that the line absorption errors are relatively small, leading to errors in the inferred metallicities that are several times smaller than the original metallicity errors. Moreover, the line absorption measurements from additional stars can now be run through the process, and their metallicities can be determined without a detailed abundance analysis.
Quadratic polynomials expressing metallicity as a function of line absorption were derived. (These differ slightly from those shown in Fig. 3 because the least‐squares process is now minimizing the squares of metallicity errors instead of line absorption errors.) Our measured line absorption values were read into the polynomials to obtain the inferred metallicities. Figure 4 shows the correlation between the original metallicities and the inferred values. The agreement is generally good. The least‐squares line has a slope of 0.996 and an intercept of 0.000. The standard deviation about the least‐squares line is 0.0543 compared to the average error in the original metallicities of 0.0525. Thus, if the Taylor catalog errors are correct, the errors in the inferred metallicities must be much smaller, in agreement with our error estimates.
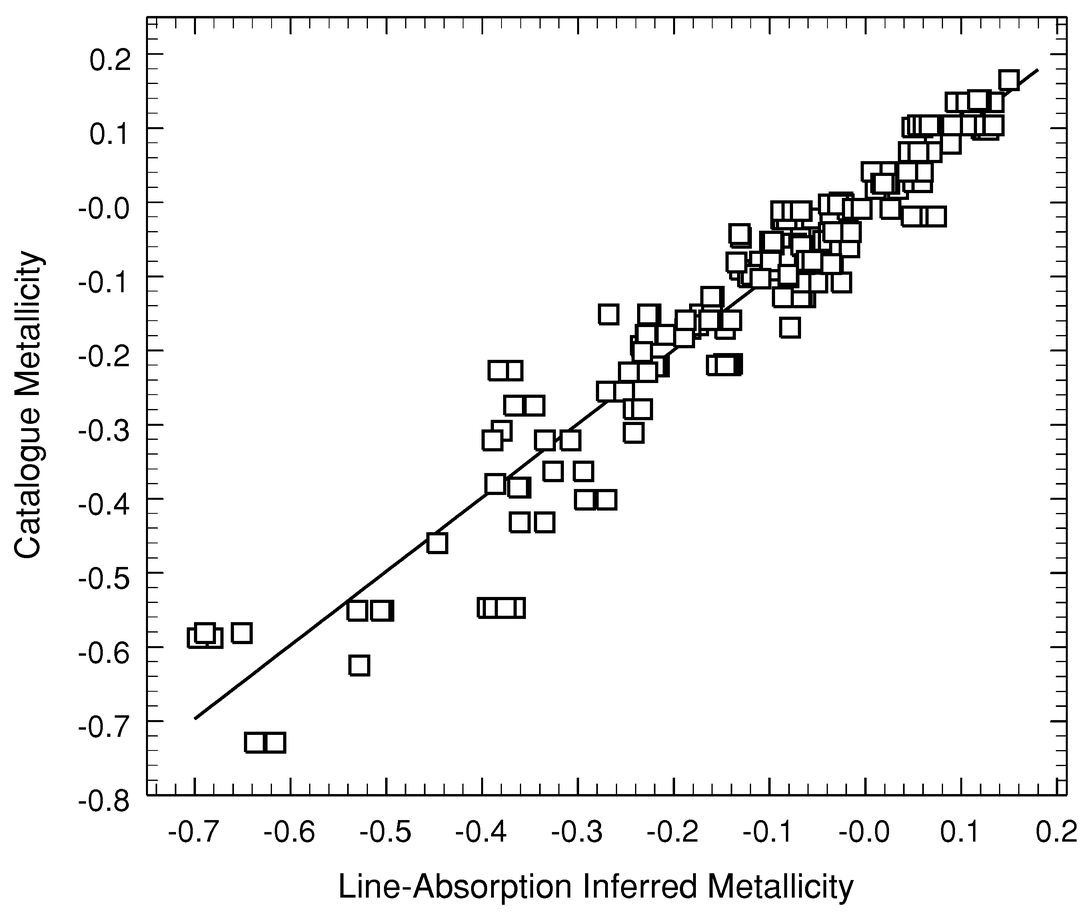
Fig. 4.— Catalog metallicity values are compared with metallicity inferred from the masked line absorption. The line is a least‐squares fit to the data and has a slope of essentially unity and an intercept of zero, confirming the consistency of the line absorption method. The scatter is only slightly larger (see text) than the errors specified by Taylor for his catalog values, which implies that the line absorption process has comparatively much smaller errors.
5. ERRORS AND COMMENTS
The behavior of the errors is of some interest. There is no significant trend with temperature, but there is with metallicity. The nonmasked and masked measurements show almost identical errors of just under 0.011 dex when expressed as equivalent metallicity errors, i.e., measurement errors divided by the slope in Figure 3. These values are compared with the Taylor catalog errors in Figure 5a. If line absorption measurement errors were the only errors, there would be an average gain of a factor of about 5 of the line absorption technique over the original catalog values. The measurement errors themselves are independent of metallicity, but when translated through the slope in Figure 3, the corresponding metallicity errors increase slightly toward lower metallicities as the slope becomes smaller. It may be possible to choose a better spectral range to steepen the relation between line absorption residual and metallicity.
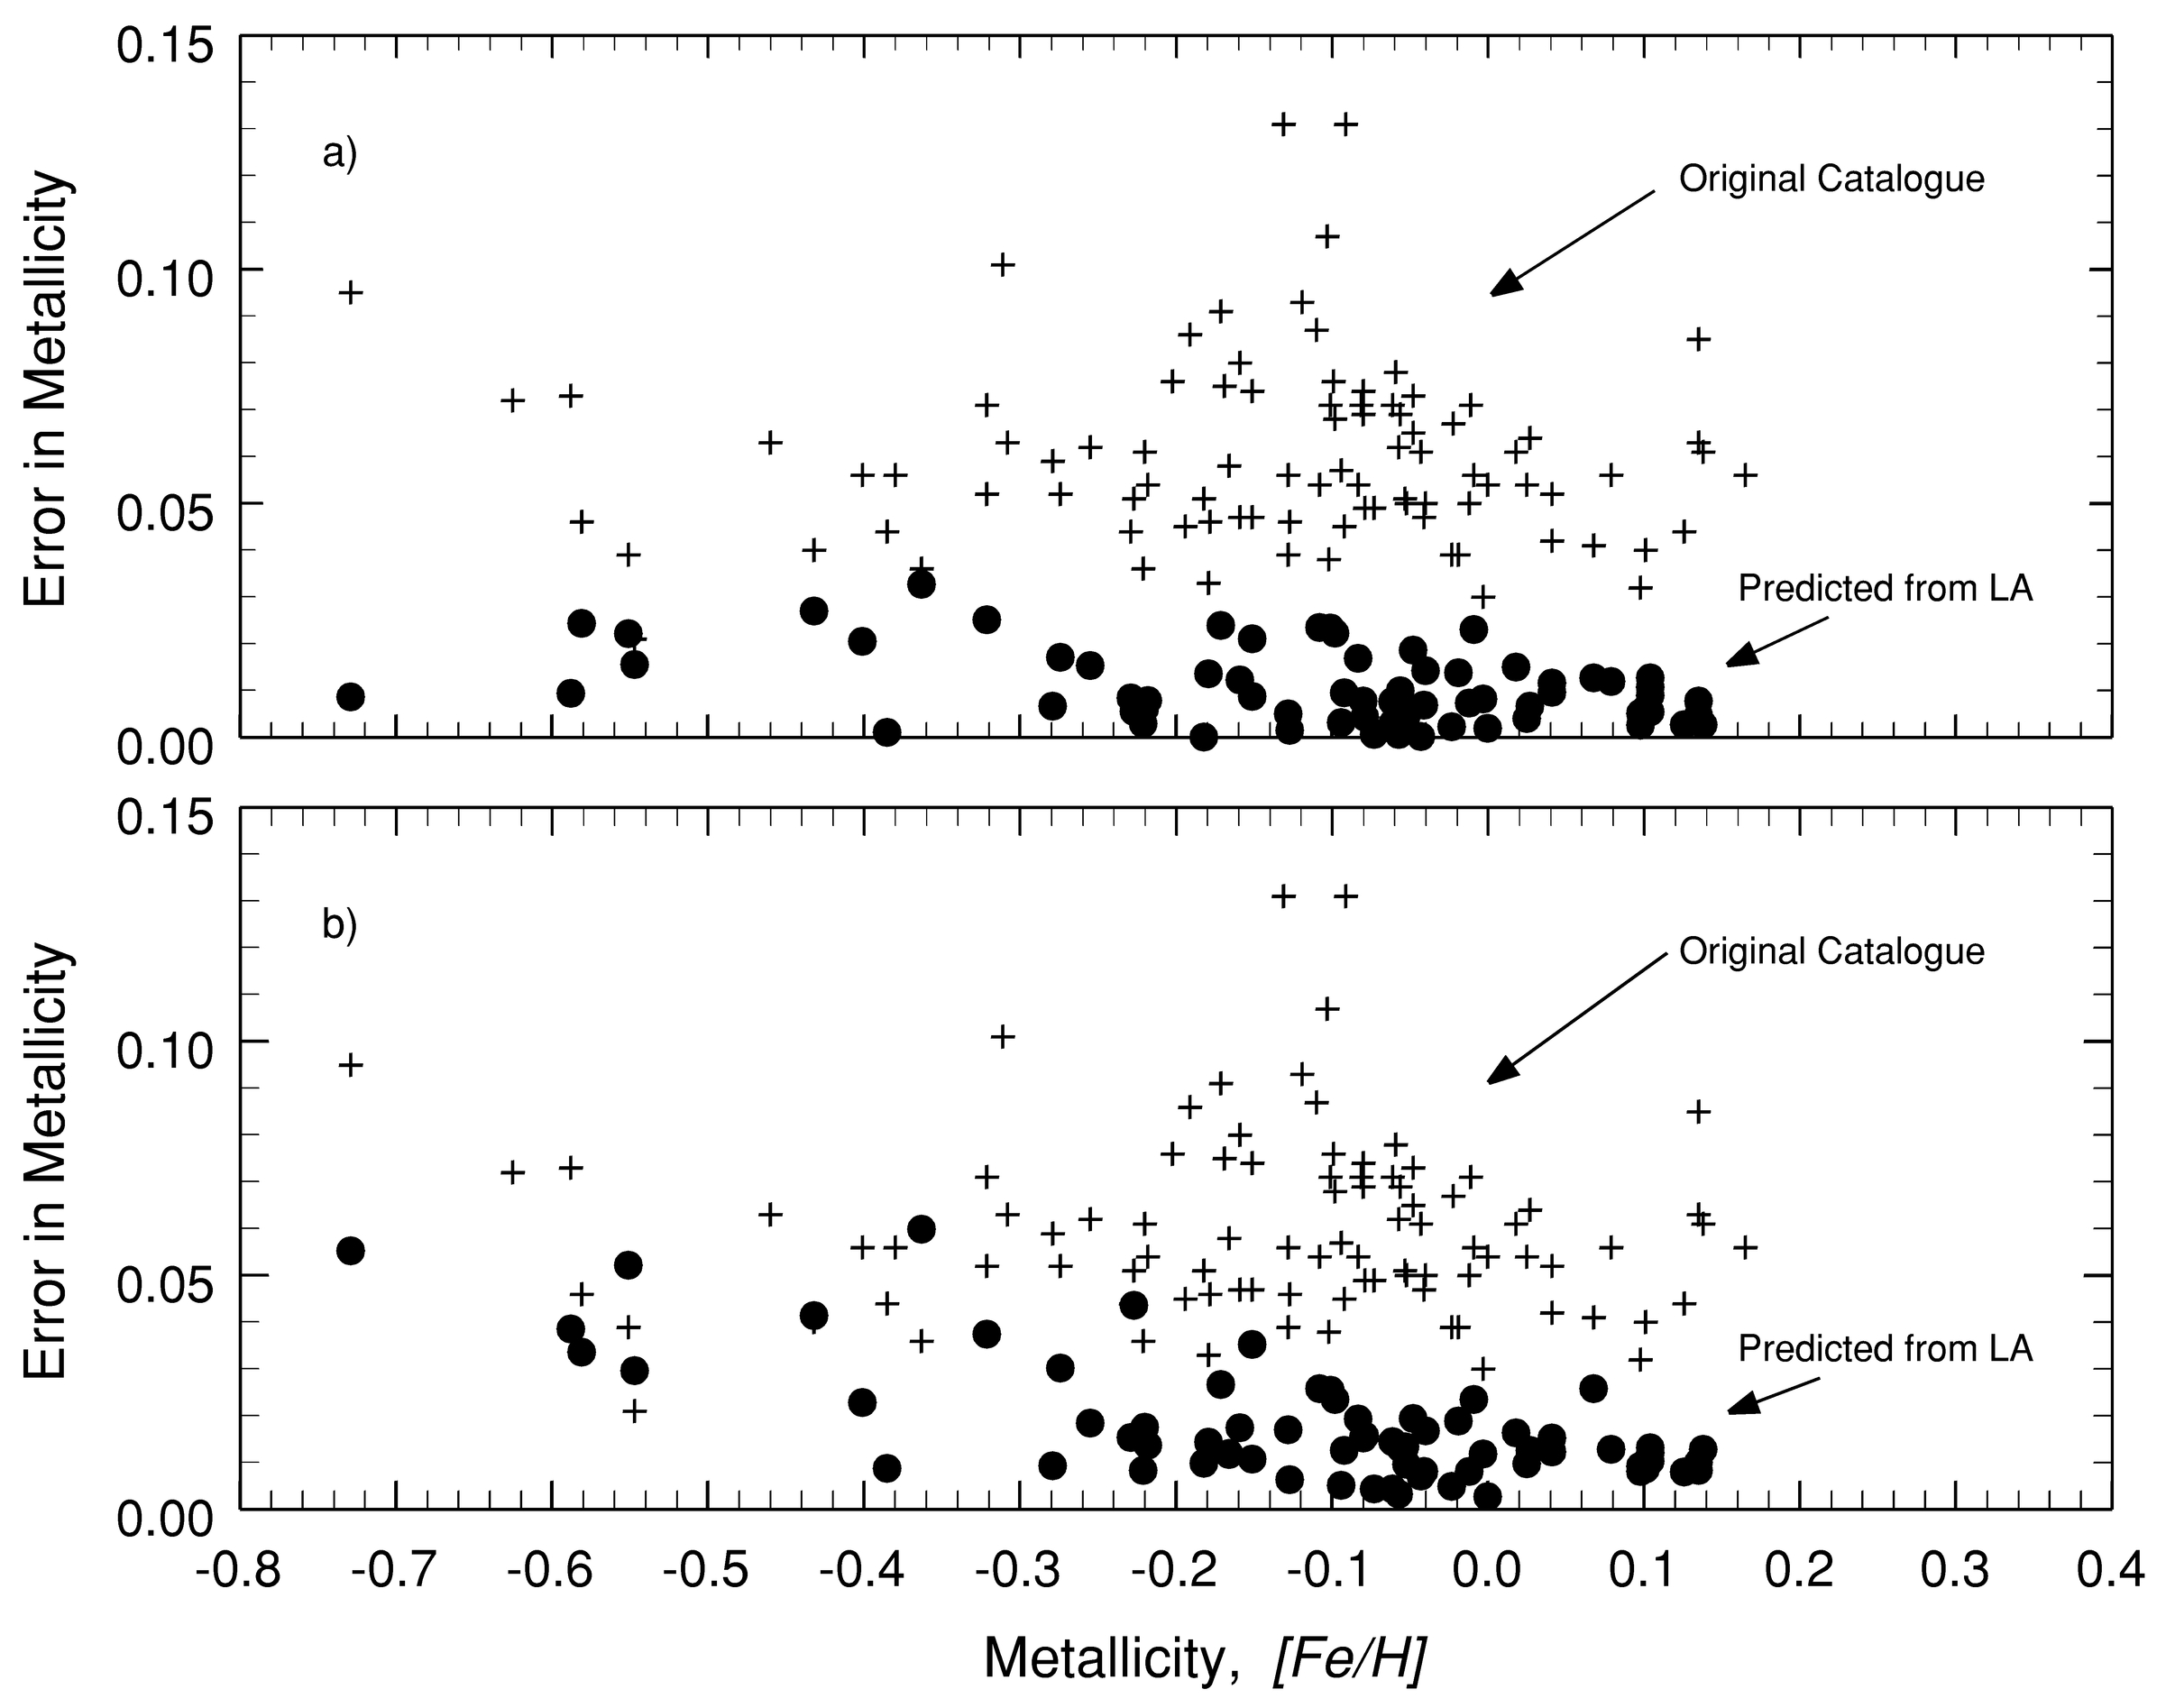
Fig. 5.— Catalog metallicity errors (plus signs) are compared to those from the masked line absorption (filled circles). (a) Line absorption errors include only line absorption measurement errors. (b) Line absorption errors include both measurement errors and temperature errors.
In addition to the errors of line absorption measurement, there are temperature errors. Temperature errors enter through the relation in Figure 2. Using the slope in this figure, temperature errors were converted to equivalent line absorption errors. Under the standard assumption of Gaussian distributions of errors, the temperature errors were then combined with the line absorption measurement errors by adding variances; this combined error was in turn run through the slopes of the polynomials in Figure 3. When the temperature errors are included in this way, the predicted metallicity errors increase noticeably toward lower metallicity values, as illustrated in Figure 5b. There is a slight inverse correlation of temperature error with metallicity for our program stars, which, in addition to the slope effect from Figure 3, accounts for the increase in errors with declining metallicity. The factor of 5 gain is still realized for [Fe/H ]>0.0, but toward the lower metallicity the advantage deteriorates to perhaps a factor of 2. More precise temperatures or new line absorption measurements from a different spectral region and having less temperature sensitivity would push the errors back toward the preferable situation in Figure 5a.
We also investigated any correlation of deviations from the polynomials in Figure 3 with absolute magnitude but found none. Although absolute magnitude is only a proxy indicator of the more relevant physical variable of surface gravity, most of the spectral lines (those from neutral species) in G and K stars show little or no direct gravity dependence (Gray 1992, p. 289), so this result is not surprising.
There is apparently a problem with the current data for α Boo and/or δ Lep, since they disagree well beyond the expected internal errors (Fig. 3). The temperatures given by Taylor (1998) agree with those found by Gray & Brown (2001) to within 2 and 24 K, respectively, so it seems unlikely that temperature errors are the problem. Possibly the metallicity values of one or both of these stars are in error. We see no way to resolve this anomaly with the data we have in hand.
The narrow spectral band we use means that interstellar reddening will not affect the results. This is an advantage over many photometric metallicity indices. In addition, as we have noted above, the typical metallicity errors for photometric indices are an order of magnitude less precise than we obtain here using line absorption. Naturally, the faint‐star limit with the line absorption technique is brighter than with photometric systems because one must be able to gather enough light in each spectral resolution element to record the spectrum. When one works toward fainter stars, the precision of the deduced metallicity will decline as the photon noise in the observed spectra increases. This can be partially compensated by working at lower spectral resolving power. Additional gains will come with the large‐aperture telescopes outfitted with multiobject spectrographs now coming into use (Barden et al. 1993; Conti et al. 2001; Allington‐Smith et al. 2000; Doyon et al. 2000; Maihara et al. 2000; Parry et al. 2000, among others). The advantages of the line absorption technique should be realizable for a large number of stars.
We are grateful to various observers who over many years have helped to collect the data. We express our appreciation to M. Debruyne for technical support and to the Natural Sciences and Engineering Research Council of Canada for financial support.