

Abstract
The influence of sintering temperature and the quantity of lithium content on microstructure and microwave dielectric properties of the Ca5−yLi2yNi4(VO4)6 were investigated. All samples were fabricated by the solid-state reaction method with a sintering temperature of 935 °C–995 °C for 4 h. The results showed no second phases formed from the XRD pattern in all samples and dense surface morphology with a sintering temperature of 965 °C. For specimens with y = 0.10 sintered at 965 °C, the permittivity, quality factor (Qf), and temperature coefficient of resonant frequency (τf) were 9.7, 25,000 GHz –52 ppm/°C, respectively. Thus, these modified dielectric materials possess a high potential for applications in low-temperature co-fired ceramic.
Export citation and abstract BibTeX RIS
Ever-growing requirements for high-frequency electronic components demand the development of ceramic-based materials 1–8 used in satellite communications, including DBS TV, GPS, Internet of Things (IoT), etc., and 5G telecommunications, including cell phones, cell site, etc. Furthermore, developing high integration of circuits and high density of packages is urgent for industrial applications. The low-temperature co-fired ceramics (LTCC) technology has attracted more and more attention due to the advantages of low cost, miniaturization for microwave components, and so on. Substrate materials for LTCC adopted in industrial production require a low permittivity (εr ), a high-quality factor (Qf), an approaching zero temperature coefficient of resonance frequency (τf ), and a lower sintering temperature as compared to the melting point of Ag (961 °C) and Cu (1080 °C).
Recently, many researchers pay attention to develop genuine low-firing ceramics 9–13 instead of the low-melting glass addition method. 14–18 Among them, garnet vanadates 19,20 revealed the high potential to fit the most requirements of LTCC applications. The cubic structure Ca5Mg4(VO4)6 was first reported by Slobodin et al. 21 Yao et al. 22 first reported The Ca5A4(VO4)6 ceramics sintered at below 900 °C demonstrated good microwave dielectric properties. The crystal structure, magnetic, and photocatalysis properties of Ca5A4(VO4)6 were firstly published by He and Seo et al. 23,24 Furthermore, low-temperature sintering, tunable microwave dielectric properties, and chemical compatibility with Ag of Ca5Ni4(VO4)6 ceramics were documented by Yao et al. 25 and Wang et al., 26 respectively. In these documents, the Ca5Ni4(VO4)6 ceramics was reported to belong to an A-site deficient garnet structure and possesses beneficial MW dielectric properties such as a permittivity of 10.9, a quality factor (Qf) of 96,500 GHz, and a τf value of −63.6 ppm/°C. 27 Lithium is commonly used to synthesize dielectric materials to obtain good microwave properties. 27–29 In this study, Ca5−yLi2yNi4(VO4)6 ceramics composed of Li2CO3 stoichiometric addition to Ca5Ni4(VO4)6 were prepared by the traditional solid-state reaction route, and the principal motivation is to investigate the physical and microwave characteristics of Ca5−yLi2yNi4(VO4)6 with appropriate dielectric properties and low-sintering temperature for LTCC applications. The sintering behavior, crystal structure, and microwave dielectric properties of Ca5−yLi2yNi4(VO4)6 ceramics were studied in detail for the first time. We found that Ca5−yLi2yNi4(VO4)6 with y = 0.1 sintered at 965 °C, comparable to Ag's melting point, possessed the highest Qf with moderate permittivity and temperature coefficient through adjusting y value.
Experimental
The specimen of Ca5−yLi2yNi4(VO4)6 ceramics with various y values (y = 0.02 − 0.10) were produced with high-purity chemical powders. The stoichiometric percentages of raw oxide powders were weighted and ball-milled in alcohol using zirconia balls as a grinding medium. Afterward, the slurry was dried at 90 °C and calcined at 775 °C for 3 h in air. The calcined powder was ground in alcohol solution using zirconia balls. After drying, the polyvinyl alcohol was dropped into the powders as a binder and then crushed into a fine powder through a sieve. The powder was pressed into pellets under 200 MPa with 1 cm in diameter and 0.5 cm in thickness. The binder was evaporated at 550 °C for 2 h at the heating rate of 1.5 °C min−1 and then sintered at 935 °C–995 °C for 4 h.
The X-ray diffraction (XRD) patterns of bulk were obtained by using CuKα radiation and a graphite monochromator in the 2θ range from 10° to 80°. The crystallization of the sintered bulks was checked by XRD using CuKα (λ = 0.15406 nm) with a Siemens D5000 diffractometer (Munich, Germany). The lattice constant was calculated using software with the Rietveld method to fit the XRD patterns. 16 The microstructural observation of the sintered surface morphology was carried out using scanning electron microscopy (SEM, Philips XL-40FEG) equipped with Energy-dispersive X-ray spectroscopy (EDS), and grain sizes in the samples were obtained from SEM images by the image analysis software.
The absolute and relative densities of pellets were measured and calculated by using the Archimedes method. The definition of relative density is the ratio of absolute to theoretical densities, which can be obtained from relative JCPDS. The εr and Qf were measured using the Hakki-Coleman dielectric resonator methodology, 30 as improved by Courtney. 31 This method utilizes parallel conducting plates and coaxial probes in TE011 mode. TE represented transverse electric waves. The first two subscript integers denote the waveguide mode, and the subscript the third integer indicates the order of resonance in an increasing set of discrete resonant lengths. The measurement system was connected to Anritsu network analyzer with model MS46122B. The τf value was measured with an identical setup but in the thermostat ranging from 20 °C to 80 °C. The following formula was utilized to obtain τf value (ppm/°C)

where f1 and represented the resonance frequencies at T1 = 20 °C and T2 = 80 °C, respectively.
Results and Discussion
Figures 1a and 1b depict the phase formation of the Ca5−yLi2yNi4(VO4)6 ceramics sintered at 935 °C–995 °C for 4 h with y = 0.1 and sintered at 965 °C with atomic ratios of Lithium (y) = 0.00–0.10, respectively. The diffraction peaks at 2θ = 28.8, 32.3, 35.5, 53.3, and 55.5° are identified using JCPDS file No. 00-052-0469 as (400), (420), (422), (640), and (612) planes of Ca5Ni4(VO4)6, respectively. The XRD results are well-matched with the pure Ca5Ni4(VO4)6 structure in the previous report. 25 All peaks are well indexed to the cubic garnet structure with a space group of Ia–3d (230). Resembling results of XRD with different sintering temperatures and y is determined to be a single phase without any impurity, indicating that the Ca5Ni4(VO4)6 was the only phase. The lattice parameters with different y at 965 °C were evaluated and summarized in Table I. The lattice parameters are ranging from 12.38 (y = 0) to 11.90 (y = 0.1) and refined to a = 11.90 Å, Vol = 1685.159 Å3 for Ca5−yLi2yNi4(VO4)6 at y = 0.10. Furthermore, Fig. 1c illustrated the refinement results of Ca5−yLi2yNi4(VO4)6 at y = 0.10 and 965 °C; these results also confirmed the formation of monolithic structure phase as compared to Ca5Ni4(VO4). 25 The possible cation mechanism after lithium substitution is that Li+ does not occupy the position of Ca2+ in the crystal structure 32 because the ionic radii of Li+(0.078 nm) are much smaller than that of Ca2+(0.106 nm).
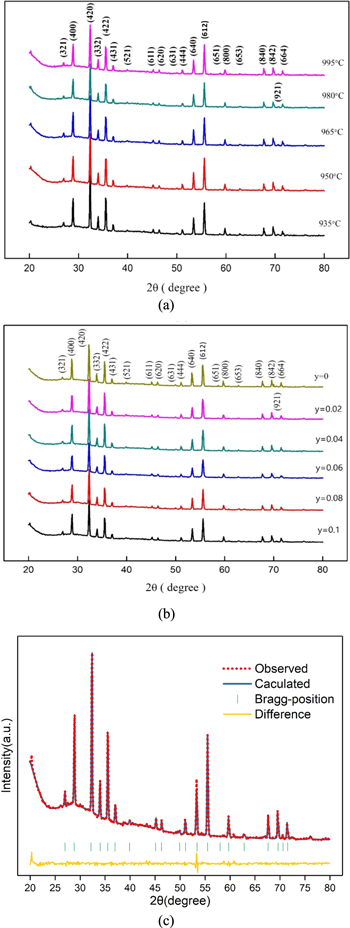
Figure 1. X-ray diffraction patterns of Ca5−yLi2yNi4(VO4)6 with different (a) sintering temperatures under y = 0.10 and (b) Li contents at 965 °C for 4 h. (c) refinement patterns of Ca4.8Li0.2Ni4(VO4)6 sintered at 965 °C.
Download figure:
Standard image High-resolution imageTable I. Cell parameters of Ca5−yLi2yNi4(VO4)6 with different Li contents (y).
| Compounds | Cell Parameter (Å) |
|---|---|
| y = 0.00 | 12.38 |
| y = 0.02 | 11.89 ± 2.27 |
| y = 0.04 | 11.89 ± 2.25 |
| y = 0.06 | 11.89 ± 2.25 |
| y = 0.08 | 11.90 ± 2.25 |
| y = 0.10 | 11.90 ± 2.25 |
Figures 2a–2i show the SEM images of Ca5−yLi2yNi4(VO4)6 prepared by different sintering temperatures and Li contents, and (j) depicts grain size distribution with y = 0.1 various sintering temperatures. It is noted that the grain size increased with rising y. Undesirable pores were obtained at y < 0.04 and 965 °C, but homogeneous grain growth can be found at y = 0.10. Moreover, small grains (∼2.7 um) were observed at 935 °C from Table II, indicating a higher sintering temperature was needed to increase grain sizes. Homogeneous grain growth (∼4.6 um) and dense-packed grains were seen at 965 °C. However, inhomogeneous grain growth (∼6.8 to 8.4 um) appeared with increasing sintering temperature because the high sintering temperature may degrade grain uniformity in the samples at 980 °C and 995 °C. The abnormal grain growth was founded especially approaching 995 °C, and the trend of grain growth increases in nonlinearity as temperature rises. This phenomenon may directly affect the dielectric properties. Well-densified samples with tiny porosity were observed when sintered at 950 °C–965 °C with x = 0.1, but the surface morphology of the Ca5−yLi2yNi4(VO4)6 ceramics varied significantly, and more porosity was observed with sintering 965 °C under y = 0.02–0.1.
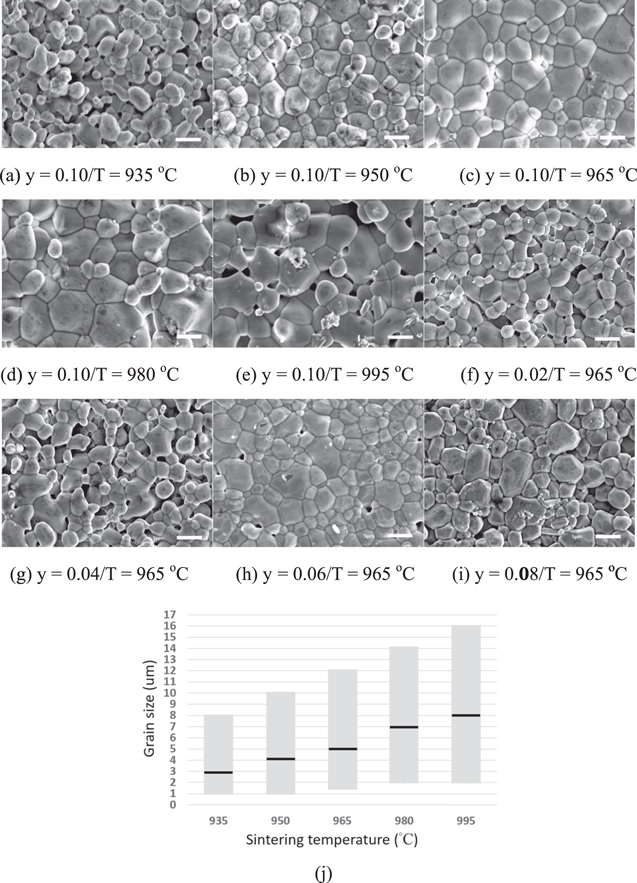
Figure 2. (a)–(i) SEM photographs of Ca5−yLi2yNi4(VO4)6 with different sintering temperatures and Li contents. (j) Grain size distribution of Ca5−yLi2yNi4(VO4)6 with y = 0.1 and various sintering temperatures. Where the black bar in each rod means the average grain size.
Download figure:
Standard image High-resolution imageTable II. The grain size of Ca5−yLi2yNi4(VO4)6 with various sintering temperatures.
| y | Temp (°C) | AVE (um) | STDEV (um) |
|---|---|---|---|
| y = 0.10 | 935 | 2.94 | 1.266 |
| 950 | 4.12 | 2.277 | |
| 965 | 5.02 | 2.933 | |
| 980 | 6.96 | 3.726 | |
| 995 | 8.04 | 4.181 |
Figure 3a shows the EDS analysis for Ca5−yLi2yNi4(VO4)6 ceramics; the radii of Li is too small, which leads to the inability to observe it. It can be seen that the C and E points have a higher proportion of oxygen atoms; A, B, and D have a higher proportion of vanadium atoms. All points contain the O, Ca, V, and Ni ingredients, indicating Li dopant is suitable for Ca5Ni4(VO4)6. The results are well matched with XRD without impurity phase formation. Therefore, we could further confirm the single-phase crystallization formed in the samples from EDS analysis, which is consistent with XRD analysis. Furthermore, XPS analysis of Ca5−yLi2yNi4(VO4)6 ceramics with y = 0.1 and sintered at 965 °C was shown in Fig. 3b, all processed elements can be observed, and Lithium can be traced around 56.5 V (inset of Fig. 3b). Therefore, the lithium amount of this ceramic can be further calculated and confirmed using XPS data.
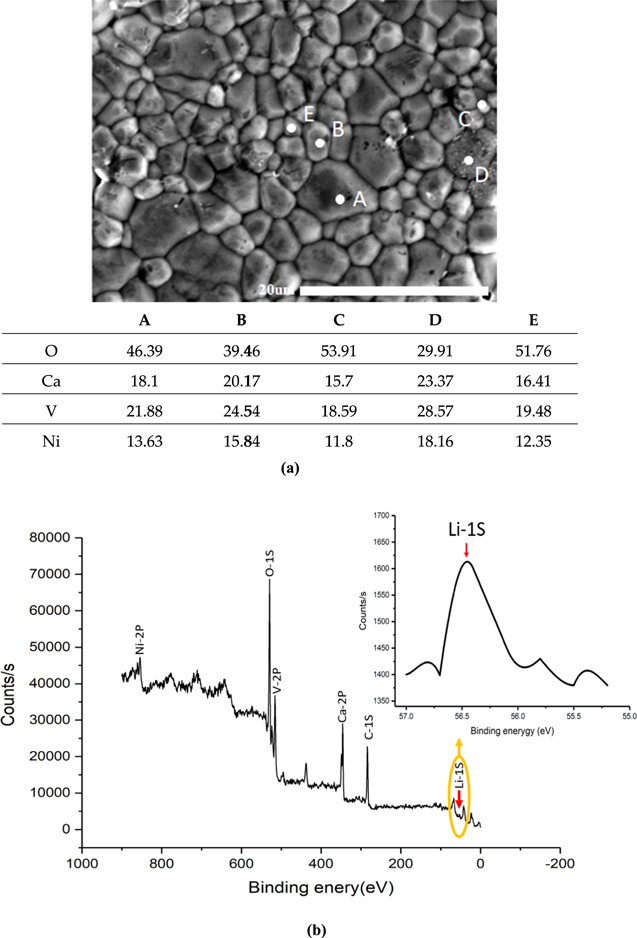
Figure 3. (a) Element analysis for different 5 points in SEM image of Ca4.8Li0.2Ni4(VO4)6 with the sintering temperature of 965 °C. (b) XPS analysis of Ca4.8Li0.2Ni4(VO4)6 with sintering temperature of 965 °C. The inset shows a peak from lithium.
Download figure:
Standard image High-resolution imageThe absolute density and relative density of the Ca5−yLi2yNi4(VO4)6 ceramics sintered at various temperatures for 4 h with y = 0.02–0.10 are shown in Fig. 4. The density increased slightly with temperature for all values of the y variables, and its trend is consistent with permittivity (Fig. 5). For example, with y = 0.10 at 965 °C, an absolute density was 3.65 (g cm−3) and a relative density of 93.2%.

Figure 4. Absolute and Relative density of Ca5−yLi2yNi4(VO4)6 ceramics vs. sintering temperatures under y = 0.02–0.10.
Download figure:
Standard image High-resolution image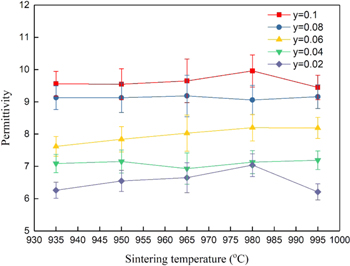
Figure 5. Permittivity curves of Ca5−yLi2yNi4(VO4)6 ceramics vs. sintering temperatures under y = 0.02–0.10.
Download figure:
Standard image High-resolution imageIn Fig. 5, the permittivity curve with y = 0.10 increased with increasing sintering temperature to a maximum of around 10 at 980 °C and then slightly decreased. It is documented that permittivity is mainly relative to the composition, grain size, and density. 33 Therefore, the permittivity also increased with increasing y. However, the trends for the sintering temperature > 965 °C were irregular. It could be attributed to undesirable pores in SEM observation from Fig. 2.
Figure 6 shows the Qf of Ca5−yLi2yNi4(VO4)6 ceramics, and it can be observed that the Qf was strongly dependent on the sintering temperature. As we know, the sintered densification, crystal imperfections, microstructure, impurity phase, etc., are regarded as the factors that degraded the Qf. 34 As the sintering temperature increased, the Qf increased to a maximum of 25,000 GHz with y = 0.10 sintered at 965 °C. Thereafter, the Qf decreased with a further increase in sintering temperature. The lower Qf may be partly caused to the lower density, and it was documented that the lattice imperfections and dielectric losses of the samples depend on fine grain size. 34 As shown in Fig 2 and Table II, when y = 0.10 and the sintering temperature higher than 965 °C, grain expansion started to appear. Oversized grains in dielectric ceramics generally comprise more imperfections, such as planar defects, dislocations, and even dislocation networks, which result in the degradation of Qf to some extent. 35

Figure 6. Qf values of Ca5−yLi2yNi4(VO4)6 ceramics vs. sintering temperatures under y = 0.02–0.10.
Download figure:
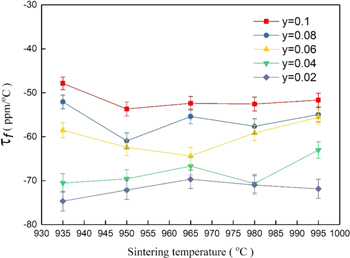
Standard image High-resolution imageFigure 7 represents that variation of τf was slight with sintering temperatures ranging from 935 °C–995 °C and Li content, and τf values increase with the rising amount of Li. In general, the τf of ceramics is correlated to the additive and composition. 36 As the results, indicates the Li dopants in Ca5Ni4(VO4)6 ceramics were useful to improve the τf from −63.6 ppm/°C to −52.4 ppm/°C (with y = 0.10, sintered at 965 °C). Furthermore, we also fabricated a sample with y = 0.2/T = 965 °C, which demonstrated permittivity and τf of this compound of 10.3 and −33.4 ppm/°C, respectively. However, Qf degraded significantly from 25,000 GHz (y = 0.1) to 14,800 GHz (y = 0.2). The complete microwave characteristics of Ca5−yLi2yNi4(VO4)6 with increasing Lithium (y) content were shown in Table III.
Figure 7. τf value of Ca5−yLi2yNi4(VO4)6 ceramics system vs. sintering temperatures under y = 0.02–0.10.
Download figure:
Standard image High-resolution image
Table III. Microwave dielectric properties of Ca5−yLi2yNi4(VO4)6 with different Li contents (y).
| Composition | Sintering temperature (°C) | Density (g cm−3) | permittivity | Qf (GHz) | τf (ppm/℃) |
|---|---|---|---|---|---|
| y = 0.00 | 980 | 3.78 | 10.9 | 96,500 | −63.6 |
| y = 0.02 | 965 | 3.2 | 6.7 | 13,500 | −69.6 |
| y = 0.04 | 965 | 3.4 | 6.9 | 14,000 | −66.6 |
| y = 0.06 | 965 | 3.5 | 8 | 19,000 | −64.3 |
| y = 0.08 | 965 | 3.6 | 9.2 | 21,000 | −55.3 |
| y = 0.10 | 965 | 3.65 | 9.7 | 25,000 | −52.3 |
Conclusions
This study has examined the characteristics of the Ca5−yLi2yNi4(VO4)6 ceramics prepared by a conventional solid-state reaction method. In all the XRD patterns, Ca5Ni4(VO4)6 ceramics were the single-phase with cubic garnet structure with a space group of Ia–3d. In the SEM images of Ca5−yLi2yNi4(VO4)6 ceramics, the grain size increased with increasing sintering temperature, and the porosity expanded above 965 °C. With Li dopants, the sintering temperature of Ca5Ni4(VO4)6 ceramics can be moderated, and the τf can be modified toward positive. The Ca4.8Li0.2Ni4(VO4)6 ceramics sintered at 965 °C has a permittivity (εr ) = 9.7, Qf = 25,000 GHz, and τf = −52.4 ppm/°C. This study had reported and compared Ca5−yLi2yNi4(VO4)6 with the replacement of Lithium (y = 0–0.1) in-depth and in detail. This modified ceramic system show possibility of being adopted in LTCC applications.
Acknowledgments
The authors would like to express their appreciation for the financial support for this study from the Ministry of Science and Technology, Taiwan, under grant No. MOST 108-2221-E-224-050, MOST 109-2622-E-224-013, and industrial cooperation with LiveStrong Optoelectronics under contract no. Yuntech 110-185 and 109-3019-1. The authors acknowledge the technical support from the Advanced Instrumentation Center of National Yunlin University of Science and Technology.