

Abstract
The aim of this work is the dosimetric characterization of a plane parallel ionization chamber under defined beam setups at the CERN Linear Electron Accelerator for Research (CLEAR). A laser driven electron beam with energy of 200 MeV at two different field sizes of approximately 3.5 mm FWHM and approximately 7 mm FWHM were used at different pulse structures. Thereby the dose-per-pulse range varied between approximately 0.2 and 12 Gy per pulse. This range represents approximately conventional dose rate range beam conditions up to ultra-high dose rate (UHDR) beam conditions. The experiment was based on a water phantom which was integrated into the horizontal beamline and radiochromic films and an Advanced Markus ionization chamber was positioned in the water phantom. In addition, the experimental setup were modelled in the Monte Carlo simulation environment FLUKA. In a first step the radiochromic film measurements were used to verify the beamline setup. Depth dose distributions and dose profiles measured by radiochromic film were compared with Monte Carlo simulations to verify the experimental conditions. Second, the radiochromic films were used for reference dosimetry to characterize the ionization chamber. In particular, polarity effects and the ion collection efficiency of the ionization chamber were investigated for both field sizes and the complete dose rate range. As a result of the study, significant polarity effects and recombination loss of the ionization chamber were shown and characterized. However, the work shows that the behavior of the ionization chamber at the laser driven beam line at the CLEAR facility is comparable to classical high dose-per-pulse electron beams. This allows the use of ionization chambers on the CLEAR system and thus enables active dose measurement during the experiment. Compared to passive dose measurement with film, this is an important step forward in the experimental equipment of the facility.
Export citation and abstract BibTeX RIS

Original content from this work may be used under the terms of the Creative Commons Attribution 4.0 licence. Any further distribution of this work must maintain attribution to the author(s) and the title of the work, journal citation and DOI.
1. Introduction
Over the past several years, the question of whether ultra-high-dose rate (UHDR) beams might offer a new modality for cancer treatment is one of the most discussed subjects in modern radiotherapy. In 2014 Favaudon et al (Favaudon et al 2014) realized that mice lung tissue showed a significantly improved radiation tolerance, when irradiated with electrons with nominal dose rates of about 100 Gy s−1. In recent years several studies have confirmed, discussed and modelled the effects in other animal and cell models (Loo et al 2017, Montay-Gruel et al 2017, Buonanno et al 2019, Pratx and Kapp2019a, 2019b, Vozenin et al 2019b, 2019a). These dose rates result in treatment times of less than a second hence the name FLASH became common for this new technique. Radiobiologically it is not yet fully understood why and how the FLASH normal tissue-sparing effect occurs. At the moment the hypothesis favored by most groups is a local oxygen depletion caused by the interacting beam, thus reducing the oxygen-stabilisation of the radiation damages (Durante et al 2018, Pratx and Kapp 2019b). However studies not reporting a clear FLASH-effect have also been published, although a very high dose rate (100 Gy s−1 protons) was applied (Beyreuther et al 2019). Analyzing the differences it became obvious that the used particles (e.g. electron, protons or photons) the microscopic structure of the beam may play an important role: Accelerators deliver the nominal dose in pulsed beams with repetition rates in the ms-range and pulse widths in the μs-range (Bruggmoser et al 2007, Lang et al 2012, Durante et al 2018). Often the single pulse is sub-divided into even shorter ns or even ps-bunches (in this case a pulse is often called 'train'). When using this beam structure, the dose within a single pulse or train can reach instantaneous dose rates in the range of 1010 Gy s−1. Thus, irradiation of a nominal dose rate in the order of several 100 Gy s−1 can be achieved by many combinations of pulse or train structures with varying repetition frequencies, energies and particles. Having all these degrees of freedom in mind, it seems not surprising that the FLASH-effect can only be found under special combinations of these beam parameters. It is therefore one of the most important questions (not only for the clinical transfer) to evaluate the beam parameters which show the FLASH-effect (Durante et al 2018, Harrington 2019).
To realize a teletherapy approach, electron energies of more than 100 MeV are necessary to deliver the desired dose to the needed depths in the body. Therefore, different groups have investigated the possibility of radiation therapy with very high electron beams (VHEE) and published theoretical planning studies with VHEE (Bazalova-Carter et al 2015, Subiel et al 2017) as well as first dosimetric characterizations (Subiel et al 2014).
The characteristics of dosimeters under UHDR conditions must be fully understood to achieve accurate dosimetry in these challenging conditions. It must be expected that several detectors either saturate in these UHDR conditions or show a significant dose-rate-dependence in terms of recombination loss in comparison to conventional dose rates. Several studies have started to investigate this issue (Petersson et al 2017, Jorge et al 2019). For the Advanced Markus ionization chamber, Petersson et al (Petersson et al 2017) showed recombination losses up to 70% under typical UHDR conditions.
A promising accelerator system for a systematic analysis of the detector behavior in UHDR conditions using electron beams of several hundred MeV is the CERN Linear Electron Accelerator for Research (CLEAR) (Corsini et al 2018, Gamba et al 2018, Sjobak et al 2019). It provides a laser driven high energy electron beam with a wide range of possible beam characteristics. It is possible to generate a beam that approximates a conventional irradiation condition with dose rate similar to that used currently in radiation therapy although there are differences in the microscopic structure. In the same setup the beam can be changed to UHDR conditions. To achieve this, the number of bunches as well as the charge per pulse can be varied within a large range. With this flexibility and the option to reach clinically relevant electron beams, the CLEAR facility offers the opportunity to explore UHDR beams.
The aim of this work is the characterization of detector behavior in the defined beam setups at the CLEAR facility. For this study an electron beam with 200 MeV at two different field sizes of approximately 3.5 mm FWHM and 7 mm FWHM were used. For both field sizes, different pulse structures were investigated which resemble UHDR conditions. Additionally, one pulse was defined to reproduce a conventional dose rate electron beam as closely as possible. Based on film dosimetry as reference, this work develops a procedure for practical dosimetry at the facility.
2. Materials and methods
2.1. Beam configuration
The experiment was performed at the TeraHertz (THz) test stand at the CERN Linear Electron Accelerator for Research (CLEAR) (Gamba et al 2018) facility at CERN (Switzerland). This accelerator complex is capable of providing electrons with energies from 55 MeV up to 200 MeV. The beam is generated using a photocathode in Cs2Te then thanks to three accelerating stage, powered by two RF sources, it is possible to reach the top energy of 200 MeV. The accelerator line continues with a diagnostic section, where different setups allow a precise bunch length measurement and beam energy measurement (Arpaia et al 2020). Following, two irradiation areas are located, the first is VESPER, a test stand for irradiation installed on a spectrometer line, and the second is the so called 'in air' TeraHertz (THz) test-stand (Lagzda et al 2020, McManus et al 2020). Between the VESPER and the THz test-stands, several experiments are installed, from study related to X-band accelerating structure (Arpaia et al 2019) to plasma-based focusing lens (Lindstrøm et al 2018).
The beam size at the phantom entrance is extracted from the beam transverse profile revealed by a Yttrium-Aluminum-Garnet (YAG) screen of 0.5 mm thickness. The picture acquired by a monochromatic digital camera is calibrated using a calibration pattern fixed on the screen and taking into account the tilt angle of the screen. The beam charge was measured using an Integrating Current Transformer (ICT), model ICT-055-5.0 (Bergoz Instrumentation, France) installed just after the exit window and 50 cm upstream to the phantom entrance, with its electronic unit BCM-IHR-E.
For the experiment four different beam time structures with different number of bunches per pulse and different numbers of pulse per measurement were used. Thus a large range of different dose per pulse values could be realized. Each bunch had a charge of approximately 20 pC and a time length of a few ps, whereas the time length between two bunches was approximately 666 ps (1.5 GHz). The four conditions are sketched in figure 1 and described in the following: (i) Very High: 1 pulse with 100 bunches, which corresponds to a charge of approximately 2 nC and pulse length of 66 ns. (ii) High: 2 pulses with 50 bunches per pulse, which corresponds to a total charge of approximately 2 nC and a length per pulse of 33 ns. (iii) Medium: 4 pulses with 25 bunches per pulse, which corresponds to a total charge of approximately 2 nC and length per pulse of 16 ns. (iv) Low: 1–2 bunches per pulse and so many pulses that a total charge of approximately 2 nC was achieved. Time between two pulses was 1.2 s for all beam time structures. An overview of all parameters is given in table 1.
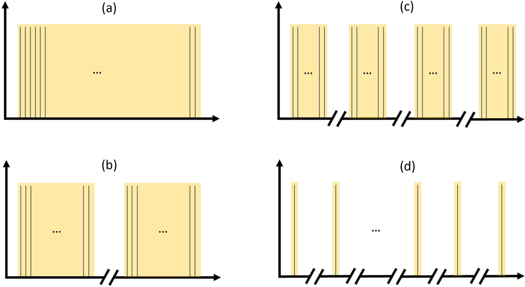
Figure 1. Beam time structures: (a) one pulse with 100 bunches ('very high') (b) two pulses with 50 bunches per pulse ('high') (c) 4 pulses with 25 bunches per pulse ('medium') (d) 1–2 bunches per pulse and so many pulses that a total charge of 2 nC was achieved ('low'). The black lines symbolizes the individual bunches, the yellow area symbolizes a pulse structure. Time between two bunches was 666 ps (1.5 GHz) and time between two pulses was 1.2 s.
Download figure:
Standard image High-resolution imageTable 1. Overview of the beam time structure parameters.
| VERY HIGH | HIGH | MEDIUM | LOW | |
|---|---|---|---|---|
| Number of pulses | 1 | 2 | 4 | 36–80 |
| Time length of one pulse | 66 ns | 33 ns | 16 ns | ∼10 ps |
| Time between two pulses | 1.2 s | |||
| Number of bunches per pulse | 100 | 50 | 25 | 1–2 |
| Time between two bunches | 666 ps (1.5 GHz) | |||
During the irradiation, in addition to the four different beam time structures, two different transverse beam sizes were used (approximately 3.5 and 7 mm FWHM at the phantom entrance). The beam size of 3.5 mm FWHM is obtained using the various set of quadrupoles of the CLEAR beam line. To enlarge it to 7.0 mm, a scattering foil (silicon, 0.5mm thick approximately) is inserted just upstream to the exit window (0.1 mm aluminum), the quadrupole current settings remaining unchanged.
2.2. Phantom setup and ionization chamber measurement
A water phantom with the dimensions of 30 × 30 × 10 cm3 was positioned on a motorized table. The phantom includes a probe holder for biological experiments with 8 Eppendorf tubes. The phantom was placed in the horizontal beam line as shown in figure 2. For this experiment, film measurements were performed at three positions: in front of the phantom, in front of the probe holder as well as at the back of the probe holder. In addition, an Advanced Markus ionization chamber type 34045 (PTW Freiburg, Germany) was placed independently from the water phantom movement at 72 mm water depth in the phantom. The chamber was connected using 42 m cable to an UNIDOSwebline (PTW Freiburg, Germany) electrometer with a high voltage of 400 V.
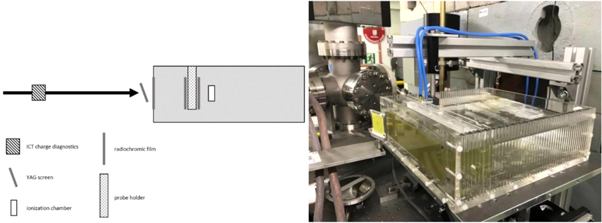
Figure 2. Left: Phantom setup from left to right: Horizontal beam line, ICT charge diagnostic, YAG screen, film position in front of the water phantom, water phantom, film position in front of the probe holder, probe holder, film position after the probe holder, position of Advanced Markus ionization chamber. Right: photograph of the setup.
Download figure:
Standard image High-resolution imageThe absorbed dose to water measured by the ionization chamber can be calculated according to international protocols like IAEA TRS 398 (Andreo et al 2006) according to equation (1)

where M is the measured signal, the calibration factor N for irradiation with Co60 source, temperature and pressure correction in terms of kTP, the beam quality correction kE, the polarity effect correction kP as well as the correction for recombination loss kS. Under Co60 irradiation with +400V, the calibration factor N for the used Advanced Markus chamber was N = 1.601 109 Gy C−1. Water temperature was 19° and air pressure was 960 hPa which leads to a correction of kTP = 1.05. The beam quality correction kE is not available in standard protocols for a 200 MeV electron beam. Therefore, the correction was simulated as described in section D.2 and determined to be kE = 0.79.
In contrast to the small magnitude of the polarity effect at standard reference conditions described in international protocols, the polarity effect under these conditions is expected to be quite high (Petersson et al 2017). For this reason, the polarity effect was analyzed in detail. For this purpose, the ionization chamber was irradiated with approximately 2 nC beam charge with different number of pulses for both beam sizes at +400 V and −400 V. For each measurement, the ICT charge was recorded.
Each data set was fitted to a power model as follows:

where M describes the chamber measurement normalized by the recorded ICT charge value. According to AAPM TG 51 (Almond et al 1999), the polarity correction factor kP was calculated as follows:

where kP,+400V describes the correction factor for positive voltage and kP,-400V for negative voltage and M+/−400V are defined by the fit functions according to equation (2).
2.3. Film measurement
For all measurements, EBT3 films with batch number 10231801 were used.
2.3.1. Film calibration
Considering the original film orientation, 15 film pieces of 3.5 cm × 5.0 cm size were cut and irradiated with a conventional radiation therapy linear accelerator (Siemens Primus, Siemens, Germany) at an electron beam of 21 MeV under known dosimetry conditions. The 15 film pieces were irradiated with dose values between 0.1 Gy and 20.4 Gy. As shown by Subiel et al (Subiel et al 2014) and Jaccard et al (Jaccard et al 2017b) an energy independence of EBT2 and EBT3 films exists to very high electron energies. Therefore a calibration at 21 MeV was assumed to be appropriate.
The film pieces were scanned with Epson 10000XL scanner and transparency unit using EpsonScan software with all auto corrections turned off. All scans were performed with 300 dpi and the films were scanned in landscape orientation. The scanned images were analyzed with Matlab 2019a and imaging processing toolbox. Since the film irradiations in the center of the field exceeded dose values of 8 Gy, the green color channel information was evaluated (Devic et al 2009, Borca et al 2013), for which a calibration curve has been obtained as shown in figure 3. The calibration curve was fitted by an exponential function:
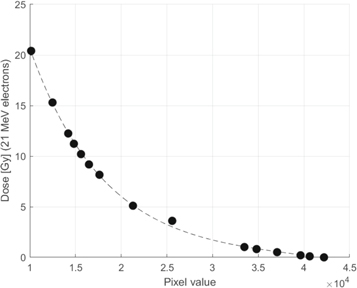
Figure 3. Calibration function of EBT3 films irradiated with 21 MeV electron beam.
Download figure:
Standard image High-resolution image2.3.2. Film measurement—depth dose distribution
Again, by considering the original film orientation, film strips of 25.4 cm × 5.1 cm size were cut. On a PMMA holder two film strips were stacked and fixed in the phantom parallel to the beam orientation using the laser alignment system as shown in figure 4. The films were positioned directly after the phantom wall, so that the measurement starts at depth = (15 +/− 5) mm. In the literature (Aldelaijan et al 2010, León-Marroquín et al 2018) it was shown that films absorb water at the edges if staying in water for extended time, which could affect film response. To minimize this effect, the edges were taped as they were submerged in the water phantom overnight due to radiation protection related access restrictions. Since no more than six film strips could be positioned in the phantom simultaneously, the beam time structures 'very high', 'high' and 'low' were irradiated each with two films. The beam time structure 'medium' was not irradiated.

Figure 4. Phantom setup for depth dose measurement using EBT3 film. The films were positioned in water parallel to beam direction as shown by the arrow.
Download figure:
Standard image High-resolution image2.3.3. Film measurement—absorbed dose
The films were prepared as for the depth dose distribution measurements. For each measurement, a film strip was positioned perpendicular to the beam direction in front and another at the back of the probe holder, corresponding to depths of 38 mm and 48 mm, respectively, as shown in figure 2. Figure 5 shows an example irradiated film strip. Since the beam has to be checked first after every change of beam parameters, a part of the film was strongly blackened by these test measurements. Therefore, only positions #0–#5 were analyzed.

Figure 5. EBT3 film used for absolute dose measurement. Example scanned image. Position #0–#5 were analyzed.
Download figure:
Standard image High-resolution imageThe same scan protocols as for the calibration films were used. The calibration curve was applied to the film strips to obtain the absolute dose. For each measurement the beam spot was separated, and the center position of the spot was analyzed. Then, the dose at the center position was calculated as well as the dose averaged in a circle of 5 mm diameter around the center position (corresponding to 2734 pixels). The averaging area of 5 mm diameter corresponds to the diameter of the sensitive volume of the ionization chamber and takes into account the volume averaging effect of the ionization chamber. An overall uncertainty of 5% is assumed for the entire film evaluation. The calibration curve was used for both irradiation conditions (parallel and perpendicular, see Arjomandy et al 2012).
2.4. Monte Carlo simulation
Part of the Monte Carlo simulations were performed using FLUKA Monte Carlo simulation package. FLUKA version 2011.3 and the graphical user interface FLAIR were used (Vlachoudis 2009, Böhlen et al 2014, Battistoni et al 2015). No variance reduction technique was applied. For further simulations of the beam quality correction EGSnrc was used applying the user code egs-chamber. Range rejection and Russian Roulette were used for variance reduction.
2.4.1. Depth dose distribution
The setup was based on a cylindrical geometry consisting of water with radius of 10 cm and length of 30 cm. A monoenergetic electron beam with energy of 200 MeV and a Gaussian beam shape was used. The FWHM of the beam was simulated in one case with 3.23 mm and in the other case with 6.88 mm according to the results from the film measurements as shown in figure 6.
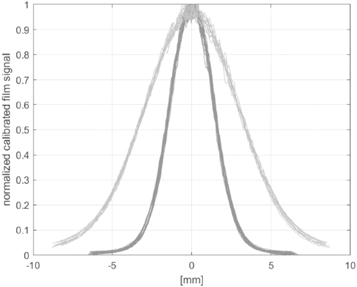
Figure 6. Beam profiles of all film measurements positioned in front of the water phantom.
Download figure:
Standard image High-resolution image2.4.2. Beam quality correction kE
For the simulation of the correction factor kE, the absorbed dose to water was simulated with Co60 source as well as with monoenergetic electron beam with 200 MeV. The correction factor kE is defined as :
The first term in both the numerator and denominator is chamber independent, where  defines the stopping power ratio between air and water at Co60 irradiation and
  the stopping power ratio under 200 MeV electron beam irradiation. The second term describes the fluence perturbation
  considering the fluence perturbation of non-ideal cavities caused by real ionization chambers.
The Advanced Markus chamber was modelled according to manufacturer's specifications. Cutoff energies were defined at 0.521 MeV for electrons and 0.01 MeV for photons. The simulation was performed under reference conditions using a 10 cm × 10 cm field size as well as for Gaussian shape beams used in this study. In each simulation, the deposited dose in the chamber's sensitive volume was scored. For validation, the value of kE was simulated for 6 MeV electron beam and compared to the value given in international dosimetry protocol (IAEA TRS 398).
3. Results
3.1. Beam characterization
3.1.1. Beam size
Based on film strips positioned in front of the water phantom free in air, the beam size was analyzed. For each spot, the film data was calibrated, and the profiles were centered and normalized. All analyzed beam profiles are shown in figure 6. For narrower transverse beam size the mean FWHM value is (3.23 +/− 0.09) mm, for the scattered beam a FWHM of (6.88 +/− 0.11) mm was determined. No differences in the beam transverse profiles between different beam time structures are observed.
3.1.2. Depth dose distribution
The depth dose distributions measured by EBT3 film and the simulated depth dose distribution for all beam configurations are shown in figure 7. Due to alignment errors, the second film for the 'LOW' beam time structure for the beam size of 3.5 mm field could not be analyzed. No difference in the depth dose distributions between the different beam time structures for 3.5 mm and 7 mm beam size can be observed within the measurement accuracy of the film measurement. Furthermore, there is a good agreement with the Monte Carlo simulation within the measurement accuracy. Accuracy limitation is mainly due to the uncertainty of the film positioning in the water phantom; the films alignment along the beam axis being critical, especially for narrow beam size and at the entrance of the phantom.
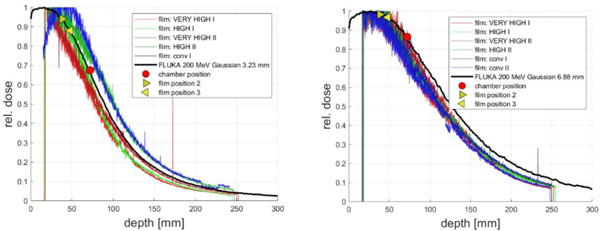
Figure 7. Depth dose distribution measured with EBT3 film compared with Monte Carlo simulated depth dose distribution. Left: beam configuration with 3.5 mm FWHM Right: beam configuration with 7 mm FWHM. For both configurations the film and chamber positions are marked.
Download figure:
Standard image High-resolution imageTo compensate for the different positions of films and ionization chamber measurements, corrections derived from Monte Carlo calculated depth dose distributions were applied. These measurement positions are marked in figure 7. The corresponding corrections required between the films and chamber positions are 0.72 (film position 2) and 0.77 (film position 3) for the 3.5 mm transverse beam size and 0.88 (film position 2) and 0.89 (film position 3) for the 7 mm beam size. These correction factors are not depending on the beam time structures.
3.2. Chamber measurement
Based on the Monte Carlo simulation of the 200 MeV electron beam, an energy correction factor kE = (0.79 ± 0.005) has been obtained for both the beam sizes with FWHM 3.5 and 7 mm. The results of the polarity correction are shown in figure 8. It shows the fitting functions of the measurement data according to equation (2) with 68% uncertainty level (k = 1). With decreasing number of pulses the chamber signal relative to the ICT value also decreases. This is caused by a collection efficiency loss of the ionization chamber. However, this decreasing of the chamber signal is polarity dependent. As shown in figure 8, the chamber signal relative to ICT is higher for negative polarity than for positive polarity. The difference between the polarities increases with decreasing number of pulses. Figure 8 shows the polarity correction factor for both beam sizes for positive chamber voltage exemplary. The polarity correction factor for positive polarity computed according to equation (3) is up to (1.39 ± 0.06) for beam sizes 7.0 mm FWHM and 1 pulse per measurement. The correction factors are summarized in table 2.

Figure 8. Calculated correction factor based on single chamber measurements at different number of pulses with positive and negative polarity. Chamber measurements are normalized to the ICT signal. Each chamber data set was fitted according to equation (2) and the fit function as well as the uncertainty level of k = 1 are shown in the figure. Based on these fitting function the polarity correction factor for positive polarity is calculated for the two beam sizes according to equations (3a ) and (3b ). Error bands show uncertainty level of k = 1. Left: beam size of 3.5 mm Right: beam size of 7 mm.
Download figure:
Standard image High-resolution imageTable 2. Summary of film and detector measurements. Beam size: small or broad beam size; beam structure according to figure 1; number of pulses; Dose per pulse: calculated based on the depth corrected mean value of the 5 mm averaged film data. Film measurement: 5 mm average film value normalized to ICT value and depth corrected (uncertainty 5%), Ionization chamber measurement: calculation according to equation (2) before the application of recombination loss correction factor  normalized to ICT value.
| Film measurement front of probe holder | Film measurement back of probe holder | Chamber measurement | Error | ||||
|---|---|---|---|---|---|---|---|
| Beam size | Beam configuration | No of pulses | Dose per pulse | [Gy/nC] | [Gy/nC] | [Gy/nC] | Dose Error [Gy] |
| 3.5 mm | LOW | 36 | 0.20 | 4.08 | 4.15 | 3.98 | 0.21 |
| 37 | 0.20 | 4.10 | 4.07 | 3.85 | 0.21 | ||
| 37 | 0.21 | 4.21 | 4.06 | 3.81 | 0.21 | ||
| 39 | 0.19 | 3.80 | 4.26 | 3.94 | 0.21 | ||
| 39 | 0.20 | 4.12 | 4.37 | 3.96 | 0.21 | ||
| 41 | 0.17 | 4.18 | 4.00 | 3.76 | 0.19 | ||
| 45 | 0.16 | 4.30 | 3.98 | 3.69 | 0.18 | ||
| MEDIUM | 4 | 2.31 | 4.32 | 4.34 | 2.29 | 0.24 | |
| 4 | 2.17 | 4.42 | 4.30 | 2.37 | 0.23 | ||
| HIGH | 2 | 4.76 | 4.25 | 4.41 | 1.80 | 0.25 | |
| 2 | 4.46 | 3.40 | 3.52 | 1.48 | 0.25 | ||
| 2 | 4.99 | 4.54 | 4.17 | 1.71 | 0.25 | ||
| 2 | 4.98 | 4.56 | 4.03 | 1.68 | 0.25 | ||
| VERY HIGH | 1 | 7.82 | 4.53 | 4.50 | 1.62 | 0.33 | |
| 1 | 9.08 | 4.44 | 4.59 | 1.53 | 0.36 | ||
| 1 | 9.17 | 4.60 | 4.61 | 1.54 | 0.36 | ||
| 1 | 6.70 | 4.47 | 4.18 | 1.38 | 0.25 | ||
| 1 | 10.15 | 4.57 | 4.34 | 1.42 | 0.38 | ||
| 7 mm | LOW | 80 | 0.13 | 2.29 | 2.15 | 1.83 | 0.12 |
| 85 | 0.12 | 2.25 | 2.12 | 1.81 | 0.13 | ||
| HIGH | 2 | 5.03 | 2.11 | 1.89 | 0.85 | 0.16 | |
| 2 | 5.09 | 2.11 | 1.89 | 0.83 | 0.16 | ||
| VERY HIGH | 1 | 9.60 | 2.23 | 2.02 | 0.66 | 0.18 | |
| 1 | 11.65 | 2.24 | 2.07 | 0.67 | 0.22 |
The ionization chamber measurements are presented in table 2 for different beam conditions. The column  represents the dose value before the application of the correction factor for the recombination loss ks. The ion collection efficiency will be derived from the comparison between the film and ionization chamber measurements that is described in the next section.
3.3. Ion collection efficiency of ionization chamber
As mentioned above the ion collection efficiency of ionization chamber measurements UHDR conditions is a key parameter for precise dose to water determination. As listed in table 2, film measurements were performed at two positions in the water phantom simultaneously with each ionization chamber measurement. By comparing the dose values determined by the film measurement and the dose values obtained from the ionization chamber measurements, the efficiency of the ionization chamber and thus the recombination loss of the chamber can be determined as follows:

Where the numerator describes the dose calculation based on the chamber measurement without concerning recombination loss as listed in table 2 and the denominator describes the dose value based on the film measurement, whereas the film measurement was averaged according to the chamber size and depth corrected as listed in table 2 for both film positions.
To analyze the efficiency of the chamber, the dose per pulse value was determined. For this purpose, the depth corrected film value was divided by number of pulse per measurement and listed in table 2.
Finally, the efficiency of the Advanced Markus chamber was calculated by dividing the ionization chamber value normalized to ICT measurement through the depth corrected film value normalized to ICT measurement. The ion collection efficiency values plotted against the dose per pulse are shown in figure 9. No difference between the two beam sizes was observed. Furthermore, the results from the two film positions agree which indicate that the simulation of the depth dose curve as shown in figure 7 is valid. For the highest dose per pulse value a chamber ion collection efficiency of approximately 30% is observed.

Figure 9. Ion collection efficiency values of the Advanced Markus ionization chamber for different dose per pulse values. Squared symbols indicate 3.5 mm FWHM beam, circle symbols indicate 7.0 mm FWHM beam. The dotted line indicates the theoretical approach of Petersson et al where the black symbols indicates the numerical calculation.
Download figure:
Standard image High-resolution image
4. Discussion
The beam structure used in this study differs significantly from conventional clinical beam structures. Linear accelerators used in conventional radiation therapy have a pulsed beam structure and energies up to 20 MeV. The pulse repetition frequency is between 50–400 Hz and the pulse lengths are in the range of a few microseconds. Typical dose per pulse values are up to few mGy per pulse. The electron beam with energy of 200 MeV used here is generated by many bunches that can be combined to form a pulse. The microstructure of the bunches is not detectable by the ionization chamber. Therefore, the pulse structure can be compared with the pulse structure.
The time structure of the beam used here has pulse lengths of up to 66 ns. Conventional linear accelerators, on the other hand, have pulse lengths of several microseconds (Bruggmoser et al 2007, Kry et al 2012). In this experiment, beam doses between 0.1 and 12 Gy were applied per pulse. Conventional linear accelerators apply radiation doses of up to a few mGy per pulse. Petersson et al (Petersson et al 2017) have used an electron linear accelerator (Oriatron eRT6) in their study where the applied beam dose per pulse can be varied between 0.1 mGy and 10 Gy. Therefore, a detailed comparison to the study by Petersson et al is appropriate. However, the time structure of the beam used in Petersson et al with pulse lengths between 0.5 μs and 1.8 μs is comparable to conventional linacs and not to the time structure used here.
Radiochromic film has been used in many previous publications to determine the absorbed dose to water. The film does not seem to show any dependence of the dose rate, also for ultra-high dose rate conditions (Jaccard et al 2016, 2017a, Favaudon et al 2019). The films used in this study have been calibrated using 20 MeV electron beams, as has been also performed by Subiel et al (Subiel et al 2014) for their measurements in 165 MeV electron beam. Since a systematic study on the energy dependence of radiochromic films up to 200 MeV does not exist so far, a higher uncertainty associated with the film measurements has to be considered.
The approach used in this study based on EBT3 film to determine the dose and a simultaneous measurement with an ionization chamber which was directly comparable to the study by Petersson et al (Petersson et al 2017). Furthermore, both studies investigated the Advanced Markus chamber. Even if the beam configurations are not directly identical, figure 9 shows that the empirical model of (Petersson et al 2017) (Eq (10)) for pulse length of 500 ns, the smallest pulse duration investigated in their study, agree with our results. In addition, the ion collection efficiency of the Advanced Markus chamber was calculated numerically by an approach of of Gotz et al (Gotz et al 2017), which was extended and validated into the UHDR range by Kranzer et al (Kranzer et al 2020). In the numerical calculation, the actual time length of each pulse of 0.066 μs for VERY HIGH beam time structure, 0.033 μs for HIGH beam time structure, 0.016 μs for MEDIUM beam time structure and 0.001 μs for LOW beam time structure were used. Except for the data points at the lowest dose per pulse, the results of the measurement also show good agreement to the numerical calculation.
Therefore, the result in figure 9 is quite remarkable. A dependence of the time structure of the beam as well as of the electron energy is not observable within the measurement uncertainty. The result shows that it seems possible to perform reliable ionization chamber dosimetry under UHDR beam conditions. It is necessary to introduce additional procedures, most importantly to characterize and correct the saturation as shown in figure 9. It is also noteworthy that at VHEE, the water-to-air stopping power ratio, which is the detector dependent term of the beam quality correction factor, approaches a constant value. Therefore, a small spectral perturbation, such as that introduced by the scatterer to increase the beam cross section in the experiment, is not expected to cause a noticeable change in the kE as demonstrated in the Monte Carlo results.
Another interesting result of the study is the characterization of the polarity effect of the ionization chamber. Under conventional beam conditions the polarity effect is usually very low with values below 1% as specified by IEC 60731, under special conditions the effect can also amount to values of a few percent. Under conventional beam conditions the effect is mainly caused by the fact that chamber components are irradiated, thereby providing a signal contribution in addition to signal caused by the air volume of the chamber. This additional signal contribution is independent of the chamber voltage, resulting in a polarity dependent total signal.
Under the very high dose per pulse conditions used here it can be assumed that an additional effect is involved. The dose per pulse is so high that free charge carriers are created in the air volume which lead to a temporary space charge effect within the chamber. As a result, the signal contribution from the air volume is changed. This effect is therefore proportional to the dose per pulse. Figure 8 shows a strong dependence of the dose per pulse. So, the theory seems to be possible, but should be investigated in further studies. In any case, this work shows how important it is to consider the polarity effect at UHDR.
5. Conclusion
Within the study, a procedure was developed which allows a practicable dosimetry at the CLEAR facility at the CERN Based on film dosimetry as reference the behavior of the Advanced Markus ionization chamber at ultrahigh dose-rates was analyzed. It shows that the behavior of the ionization chamber at the laser driven beam line at the CLEAR facility can be considered and corrected for in a way similar to very high dose per pulse electron beams. This allows the use of ionization chambers on the CLEAR system and thus enables active dose measurement during the experiment. Compared to passive dose measurement with film, this is an important step forward in the experimental equipment of the facility.
Acknowledgments
The authors gratefully acknowledge Ruben Garcia Alia for fruitful discussions and his comments on the manuscript.
This project has received funding from the EMPIR programme co-financed by the Participating States and from the European Union's Horizon 2020 research and innovation programme. The authors acknowledge the GMEE for supporting Antonio Gilardi.
Conflict of interest
Daniela Poppinga and Rafael Kranzer are employees of PTW Freiburg. The authors acknowledge the GMEE for supporting Antonio Gilardi.