

Abstract
While it has been demonstrated that large scale liquid exfoliation of graphene is possible using high-shear exfoliation, it has not yet been shown to be applicable to a broader range of layered materials. In addition, it would be useful to determine whether the mechanisms reported for shear exfoliation of graphene also apply to other 2D materials. In this work we show that previous models describing high-shear exfoliation of graphene apply to MoS2 and WS2. However, we find the minimum shear rate required to exfoliate MoS2 and WS2 to be ~3 × 10⁴ s−1, somewhat higher than the value for graphene. We also demonstrate the scalability of shear exfoliation of WS2. By measuring and then optimising the scaling parameters, shear exfoliation of WS2 is shown to be capable of reaching concentrations of 1.82 g l−1 in 6 h and demonstrating a maximum production rate of 0.95 g h−1.
Export citation and abstract BibTeX RIS
Introduction
Due to its incredible properties and numerous applications there has been an explosion of interest in graphene since its discovery in 2004 [1–3]. While exfoliation and monolayer production efforts initially focused on graphene, 2D carbon is far from the sole material of interest with focus shifting to the exfoliation of other 2D materials [4–7]. Transition metal dichalcogenides (TMD's) have seen applications in batteries [8, 9], sensors [10, 11] and transistors [12], an application where graphene is currently unsuitable due to its lack of a bandgap. For TMD's to find use in applications on an industrial scale, it is essential to find an operable method which allows production of large quantities of exfoliated and defect-free material. While a method has been demonstrated for graphene [13] this method has not yet been fully explored for TMD's.
Liquid phase exfoliation of 2D materials through the use of ultra-sonication has been known for some time [14] and, while this method can be applied to a variety of materials including TMD's [15], sonication is not suitable for scaling to industrial production levels. Shear exfoliation of graphene was recently demonstrated as a facile and scalable production method to suit industrial scale production of graphene stabilised in the liquid phase [13]. Following the original demonstration of shear exfoliation in rotating blade mixers, this method had been extended by a number of researchers [16–18]. However, in many cases, shear exfoliation methods have been guided, at least in part by simple models [13]. It is unknown however whether the models proposed in this work specific to graphene or general to all 2D materials. Furthermore, this method has not been fully explored for alternative 2D materials.
One phenomenon which was observed during the scale up study using high shear mixing for graphene, was the apparent minimum shear rate required for exfoliation to take place. This 'shear minimum' was understood using a simple model which described the shear minimum as a function of the energy cost of exfoliation:
where  is this shear min, η is the liquid viscosity, L the minimum exfoliable platelet length and ES,M, ES,L are the material and liquid surface energy respectively. N.B. for the exfoliation of 2D materials, the surface energy is usually taken as the surface tension (i.e. Gibbs free surface energy) minus the product of absolute temperature and surface entropy [14]. If we rearrange equation (1) for L it can be used to describe a minimum size for exfoliable platelets. Taking into account the fact that platelets over a certain size will be largely removed during centrifugation of the dispersions, we can obtain an expression for the mean dispersed platelet length as an average of these upper and lower limits:
where LCF is the upper cut off of flake size due to centrifugation. Equation (2) provides potential routes to material optimisation through surface area matching, tailoring viscosity for desired platelet size and minimising the required shear rate for exfoliation to name a few and so being able to apply this theory to alternative materials would be highly desirable.
In this work we demonstrate that the theory describing shear exfoliation of 2D materials in the liquid phase can be applied to other materials. We then focus our attention on one material of interest (WS2) and, through varying processing parameters, demonstrate that scalable production of WS2 can in fact be performed using high shear mixing reaching a production rate of 0.95 g h−1.
Results and discussion
In order to demonstrate the generality of shear mixing as described previously by Paton et al [13] it is important to investigate if the theory they describe is general to all 2D materials or specific to graphene. We used the same high shear mixer (Silverson model L5M-A, 746 W) as in our previous work (figure 1). All starting materials were cleaned in a pretreatment step (methods). The pre-treated materials were immersed in NMP, sheared at various shear rates, centrifuged and the resulting concentration of the supernatant was measured using UV–vis spectroscopy (see SI). As shown in figure 2(A), the concentration is low for small shear rates before increasing sharply above a critical value. Thus, a distinctive minimum shear rate,  , where exfoliation begins can clearly be seen for all materials. As observed previously,
  is close to 10−4 s−1 for graphene and is somewhat higher for MoS2 and WS2 at ~3 × 10⁴ s−1 and ~3.5 × 10⁴ s−1 respectively. This higher minimum shear rate in the TMD samples is probably partly due to the fact that nanosheets of WS2 and MoS2 tend to be smaller than graphene flakes (see below). However, another possibility is that it may also be due to slightly higher surface energies in TMD's [15].
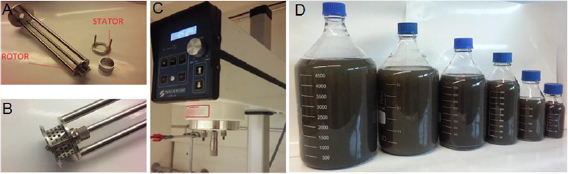
Figure 1. (A) Working head and (B) rotor-stator assembly. (C) Silverson high shear mixer used for this work (D) large volumes of WS2 dispersion in water surfactant.
Download figure:
Standard image High-resolution image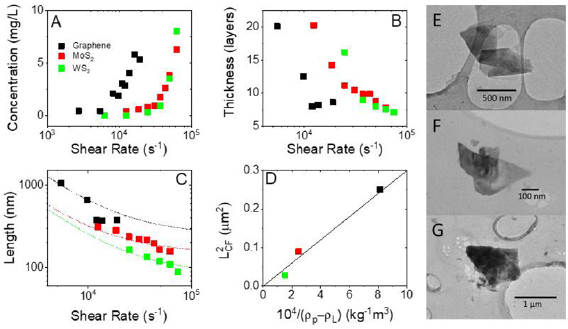
Figure 2. (A) Concentration versus shear rate (B) flake thickness and (C) flake length as calculated using UV–vis and Raman peak metrics developed by Backes et al. (D) Lcf or 'cut size' as described by Nacken et al [19] plotted as a function of 1/δρ with Graphene in black, MoS2 in red and WS2 in green (E)–(G)TEM micrographs showing exfoliated flakes of Graphene, MoS2 and WS2 respectively.
Download figure:
Standard image High-resolution imageIt has been shown previously that utilising spectroscopic metrics for nanosheet size and thickness can be an effective way to characterise LPE dispersions [20–23]. In this work we utilise the UV–vis metrics detailed by Backes et al to characterise dispersion concentration and WS2 and MoS2 flake size and thickness, while using the Raman metrics detailed to determine graphene flake size and thickness where, for all materials, L is in nm and N in layers.
Using these, we can get a measure of how the platelet lateral size and thickness vary with shear rate and gain a further understanding of the exfoliation mechanics. Most notable is the dramatic decrease in thickness occurring below the shear minimum as shown in figure 2(B). Comparing the data in figure 2(B) with that in figure 2(A) shows the flake thickness to fall below ~ten layers at the shear minimum.
Moving our attention to platelet length (figure 2(C)), it is clear that the graphene nanosheets are considerably larger than either MoS2 or WS2 nanosheets implying the difference in shear minimum between the materials described above to be size related. This graph also shows a decrease in size as a function of shear rate. The data has been fitted to equation (2) (for NMP η = 1.7 mPas) with each data set being consistent with similar nanosheet surface energies of ES,L ~ 73 mJ m−2 and a solvent surface energy of ES,M = 71.5 mJ m−2. However, we found a significant difference between values of LCF for the different materials: 500, 300 and 170 nm for graphene, MoS2 and WS2 respectively.
We note that LCF is a measure of the largest flake size retained after centrifugation. An approximate expression for this parameter has been presented by Nacken et al [19]:
where η is solvent viscosity, ρP,L are platelet and liquid density respectively, ω is rotational speed, t centrifugation time and r1,2 are the minimum and maximum radii of the samples placed in the centrifuge rotor. This equation implies that the variation of LCF is simply due to variations in material density. Plotting (LCF)2 versus  in figure 2(D) we find a very good agreement with a straight line fit, albeit with slope different by a factor of five from the theoretically predicted slope.
Having seen that the theory describing shear exfoliation is maintained for alternative materials, we focus our attention on scaling up WS2, a material of considerable interest, and in doing so transfer from solvent based exfoliation to exfoliation in water/surfactant.
Before attempting to optimise parameters, it is important to reconfirm that shear exfoliation in water surfactant produces nanosheets of similar quality. With this in mind, a preliminary sample was produced in order to verify the quality of the nanoparticles, shearing 20 g l−1 of WS2 in 300 ml water with sodium cholate 0.8 g l−1 for 90 min at 9000 rpm (referred to as a 'standard' sample). TEM analysis was performed on the standard sample finding the nanosheet mean length to be ~56 nm (figures 3(A)–(C)). Using Raman analysis, we confirmed that the flakes were, in fact WS2 (figure 3(D)).
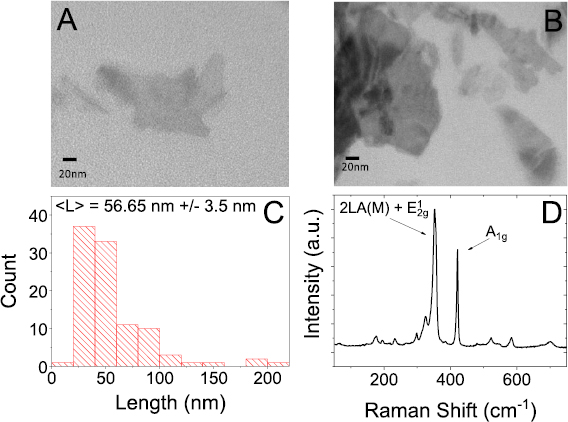
Figure 3. (A) and (B) TEM image of nanosheets prepared from a standard sample, showing well exfoliated flakes of WS2 (C) histogram of nanosheet length from TEM image analysis (D) Raman spectrum of standard sample of WS2 in water and sodium cholate showing the typical WS2 peaks: in plane E12g mode (~350 nm) and out of plane A1g mode (~420 nm).
Download figure:
Standard image High-resolution imageIt is highly important to know which parameters are most crucial for WS2 nanosheet production with the aim to have the maximum concentration and production rate. Properties of shear-mixed dispersions have a tendency to scale with processing parameters as power laws [24]. In our case, because the diameter (D) of the shear head has been kept constant, the concentration can only scale with the initial concentration of layered material (Ci), the rotation rate (N), the liquid volume (V) and the mixing time (t)

To understand the scale-up process, it is necessary to confirm this type of behaviour and to identify the exponents. For example, because the production rate is given by
It is clear that not only do we need χ, n and τ to be large but it is imperative that υ > −1 if increasing volume is to be a relevant way to increase PR.
During the study, each parametric dependence was investigated in order to find each exponent and produce an equivalent final equation. In each study, concentration and mean thickness (in layers) was found using UV–vis spectroscopy (figure 4(A)).

Figure 4. (A) UV–vis spectra of WS2 for various surfactant concentrations. (B) WS2 length, (C) WS2 concentration and (D) WS2 thickness as a function of NaC concentration.
Download figure:
Standard image High-resolution imageIn optical analysis the baseline is very important. In this work, the sample preparation means the exact concentration of NaC in the final dispersion is unknown, so we instead prepare the baseline with DI water alone. Due to the fact NaC absorbs at lower wavelengths, it would not be possible to use the formulas obtained by Backes et al [22] for concentration and thickness values. For this reason, an extinction coefficient at a different wavelength needed to be used. We considered the graph of the extinction coefficient as a function of the extinction ratio (ExtA/Ext290) obtained by Backes et al [22] and modified it to use a higher wavelength (350 nm) and obtained the extinction coefficient from this new fitted graph (SI: S3 (stacks.iop.org/TDM/6/015008/mmedia)). From this graph we can obtain the extinction coefficient, where ε = −9.73 + 54.67 (ExtA/Ext350)0.757 l g−1 cm−1. Similarly, the metric used to calculate platelet size had to be modified to utilize the sample extinction at 365 nm and 465 nm (SI: S4) yielding;
L = (3.69 − (Ext365/Ext465))/(0.011 × (Ext365/Ext465) + 0.0011) where L is in nm. The metric for WS2 platelet thickness however did not need to be modified and was used again here.
The first parameter that was varied is the surfactant concentration. In this case, samples were prepared changing the concentration of NaC in the pre-treatment step and keeping all the other parameters constant. UV–vis analysis was performed on each sample and it was possible to calculate the concentration and the thickness of WS2 particles. The graph below shows that the dependency of nanosheet concentration displays a peak, reaching a maximum at 1.2 g l−1 (figure 4(C)). This does not follow a power law dependency expected for the other parameters, however, from the data we can select the NaC concentration that yields the highest concentration in order to maximise WS2 production. By analysing (figure 4(D)), we can determine the dependence of nanoparticle size on the NaC concentration. Indeed, we notice the particle thickness decreases as the NaC concentration increases, this is in line with what has been observed previously for MoS2 exfoliation in surfactant [25]. Nanosheet thickness,  , within a standard sample was measured also by AFM and the histogram is shown in figure 5(A).
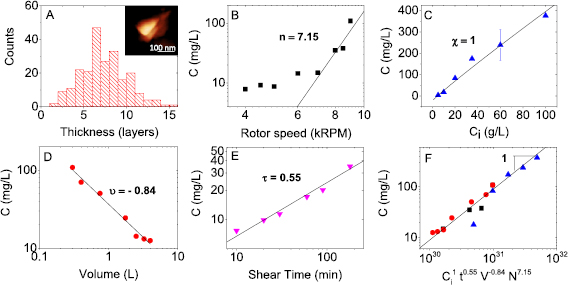
Figure 5. (A) AFM nanosheet thickness histogram and representative image of WS2 nanosheet prepared in water and NaC from a standard sample with mean nanosheet thickness of six layers (SI: table 2). WS2 concentration as a function of (B) shear rate, (C) initial concentration of WS2, (D) volume and (E) shear time. (F) Concentration of WS2 as a function of the scaling equation determined by variation of processing parameters, data taken from figures (B)–(D) with symbols and colours kept consistent. N.B. The data from (E) was not included in (F) as the exfoliation procedure was slightly different to the other samples.
Download figure:
Standard image High-resolution image
In order to find the exponents for the scale up equation, rotation rate, N, initial WS2 concentration, Ci, sample volume, V, and shear time, t, were varied independently keeping the other parameters constant. To find the exponent relative to the rotation rate, N, the sample preparation followed the same procedure in both pre-treatment and shearing stage. The graph confirms as we increase the shear rate, the concentration of the resulting dispersion increases. We can also see that the concentration is steady from 6 × 10⁴ to 10.6 × 10⁴ s−1 and then rises considerably. Calculating the slope of the increasing range we find the value of the exponent n = 7.15 (figure 5(B)), which is significantly larger than that seen for graphene (nGra = 1.13). Similarly, as the initial WS2 concentration is increased the final concentration increases. This increase is of the form,  , and fitting this to the data was found to be χ = 1, (figure 5(C)) which corresponds to the same value found for graphene. To allow as wide a range of volumes as possible to be studied, four different types of beakers were used for the volume study (600 ml; 1 l, 2 l and 5 l) In this case, the volume study shows how concentration decreases when volume increases (figure 5(D)). The slope's value (−0.84) does not correspond exactly to the value found for graphene in NMP (N-Methyl-2-Pyrrolidone) [13] but, importantly is > −1 and so will facilitate scale up (see above). The last parameter study is the mixing time, t. This study revealed that the WS2 concentration increases with the time according to a power law and the exponent was found to be τ = 0.55 (figure 5(E)), slightly lower, but reasonably comparable to the exponent seen for graphene (tGra = 0.66) [13] as would be expected if the exfoliation process does not differ significantly. These parameters mean the overall scaling of concentration is:

Plotting the concentration values obtained previously as a function of this equation we obtained a linear trend (figure 5(F)); as expected this shows a slope equal to 1, which demonstrates the scalability of WS2 exfoliation using shear mixing.
Using this data, we selected parameters in order to maximise the final WS2 concentration. These parameters were; V = 300 ml; Ci = 100 g l−1; t = 6 h; N = 9000 rpm (Shear Rate = 13.7 × 10⁴ s−1). The UV–vis spectra were analysed, showing a concentration of 1.82 g l−1 with the mean particle thickness of approximately six layers and with  = 150 nm. This compares favourably with WS2 exfoliated in water/surfactant using an ultra-sonic tip (0.77 g l−1) [26], illustrating the usefulness of optimising the shear mixing parameters.
Another parameter of interest and, for commercial production, the most important parameter, is the production rate PR = CV/t. Here, C is the concentration of exfoliated material, V is the volume and t is the shear time. Looking at the formula, we notice it is necessary to use large volumes and a short period of time to maximise PR. To maximise the PR value, shear rate and initial WS2 concentration were kept the same as the high concentration sample, but volume and shear time were changed to 1.75 l and 10 min, respectively. These values are not necessarily the most optimised values and were also selected due to practicality, material availability and space concerns. Again, the sample was analysed using UV–vis and resulted in a production rate of 0.95 g h−1 with the platelets approximately eight layers in thickness and a concentration of 0.087 g l−1. While this is lower than that reported for graphene PR,Gra = 1.44 g h−1 [13], this value is merely the largest lab demonstrable value and could be further improved with increasing sample volumes/shear rates. We believe that this is the highest production rate value ever reported for WS2.
However, it is worth noting that this production rate is relatively low on an absolute scale. To be commercialised, this rate would have to be increased by more than a thousand-fold. Although some of this increase could be met by simply scaling the volume of the mixing vessel, it is likely that other improvements such as increasing rotor speed (and hence shear rate) will be necessary. A related issue is the yield of this process which is currently quite low at <1%. It will be necessary to increase this yield. There are a number of ways to achieve this with small increases achievable by slightly modifying the existing process (changing surfactant, using more efficient shear head, increasing rotor speed). However, larger increases in yield could be achieved by changing the method of generation of shear. This has been demonstrated by a number of groups who have significantly increased the shear rate by moving to wet jet milling [16] or microfluidisation [17]. As a result of the low yield, the dispersions need to be centrifuged to separate graphene from unexfoliated graphite. While the collected graphite can be recycled to increase the overall yield, the need to centrifuge adds significant inefficiencies to the process. Any commercial process would need avoid centrifugation by including a continuous, efficient separation process.
Conclusions
Here we show that shear exfoliation is generally applicable to a range of layered materials. Furthermore, it has been shown that the theory describing shear exfoliation describes the exfoliation of MoS2 and WS2 with only minor differences between these materials, namely platelet lateral size and shear min, and graphene, which has been previously studied.
These differences appear to depend largely on material density and scale closely in line with theory described by Peukert et al. That effective exfoliation of these materials depends strongly on material density, implies that optimised centrifugation techniques are vital to improving dispersion uniformity and quality with respect to mean platelet thickness.
The broad applicability of high shear exfoliation has been demonstrated further by applying the method to demonstrate the scalability of WS2 production. Shear exfoliation has been demonstrated to be affective at exfoliation of WS2 when utilising water/surfactant stabilisation in place of solvents.
Through variation of key parameters, it has been demonstrated that shear exfoliation is a suitable method to produce large quantities of exfoliated WS2. Having determined these scaling parameters, they have been utilised to obtain two maximised cases, concentration; reaching 1.82 g l−1 in 6 h, and production rate; producing 0.95 g h−1 of material during a 15 min exfoliation cycle.
Materials and methods
Materials
All chemicals were purchased from Sigma Aldrich unless otherwise stated. Dispersions were prepared using a high shear laboratory mixer (Silverson model L5M-A, 746 W). It is supplied with a standard mixing assembly, comprising a frame and base plate holding a four bladed rotor and a stator with 96 square perforations (2 × 2 mm) which is used for this work. The rotor-stator gap for the assembly used was ~110 µm. Centrifugation was performed using a Thermo Scientific centrifuge (Heraeus Megafuge 16) using a TX-400 swinging bucket rotor (max 5000 rpm) and a Hettich Mikro 220R centrifuge using a high speed rotor for size selection (up to 18 krpm). Optical absorbance spectroscopy was performed with samples held in a 4 mm path length quartz cuvette using a UV–vis–NIR spectrophotometer (Varian Cary 500) in 0.5 nm increments. Raman was performed using a Horiba Jobin Yvon LabRAM-HR using a 100× objective lens with a 633 nm laser excitation. TEM samples were prepared on holey carbon grids and was performed using a JEOL 2100 operated at 200 kV and a FEI Titan TEM operated at 300 kV.
Methods
In this work, dispersion preparation had two steps, pre-treatment (to remove any material impurities present) and final shearing. During pre-treatment each material was sheared at 50 g l−1 in IPA for 3 h at 4500 rpm. The material was filtered through a fine pore filter membrane (nylon 0.045 micron) and dried overnight in a vacuum oven at 50 °C. For final shearing, samples were prepared in various solvents at a starting concentration of 50 g l−1 at various shear rates for 1 h. These samples were all centrifuged using the same regime, 2000 rpm for 5 h 45 min using the swinging bucket rotor. In order to ascertain material concentrations, extinction coefficients extracted from work performed by Backes et al were used [20–22]. Graphene samples were filtered onto a fine pore membrane (anodisc, 0.02 micron) and the resulting film was analysed using Raman. TMD samples were transferred from NMP to water surfactant (1 mg ml−1) by centrifuging at 16 000 rpm (using the high speed rotor) for 1 h and re-dispersing the material via bath sonication before being analysed using UV–vis. The concentration, length and thickness of graphene and the TMD's were ascertained using metrics based on Raman and UV–vis spectra respectively [20–22]. The extinction coefficients (SI: table 3) used were all obtained from the methods describing the length and thickness metrics for the sake of consistency.
During optimisation, dispersion/exfoliation of WS2 again comprised of two stages; a pre-treatment stage (PT) to remove impurities present in the material, however with an aim to avoid toxic solvents the samples were prepared solely in water/surfactant. After that, the dispersion was left overnight to settle, before the supernatant was removed. The sediment was then re-dispersed in fresh DI water, and the dispersion was subjected to the final shearing. In the pre-treatment step, two parameters, shear time (90 min) and shear rate (6000 rpm = 9.1 . 104 s−1), were kept constant for the entire series. During the subsequent optimisation all shear parameters were varied keeping other parameters constant.
The standard sample was prepared with the following mixing parameters: a 32 mm rotor diameter (D), initial WS2 concentration (Ci) of 20 mg ml−1, a NaC concentration (Cs) of 0.8 mg ml−1, a shearing time (t) of 90 min, a rpm of 9000 (shear rate = 13.7 . 104 s−1) for the shearing stage (N), and a 200 ml volume (V) for both pre-treatment and shearing.
The volume was varied in both the PT and the shearing step, and the rotor diameter was kept constant (32 mm). The dispersion preparation was followed by size selection using the centrifuge speed (2–10 krpm) to select a particular range of particle dimension. The supernatant was collected after the shear mixing and centrifuged in 50 ml vials at 2000 rpm for two hours; the supernatant was then re-collected and further centrifuged at 10 000 rpm for two hours. The resulting sediment was then collected, re-dispersed in water, and analysed.