

Abstract
In this work, quantum dots sensitized solar cells had been successfully prepared based on  counter electrode and
  photoanode. The highest power conversion efficiency was 3.77%. Herein, we studied the degradation process of quantum dots sensitized solar cells by investigating the photocurrent-voltage
  curves and electrochemical impedance spectroscopy. The results showed that there was a downward trend of the power conversion efficiency from 3.77% to 1.52%. This trend was proved by the increase of dynamic resistance, including: charge recombination resistance at counter electrode/electrolyte and
  interface (
 increased from
  to
to  ), charge transfer resistance within the
  film and at the
  interface (
 increased from
  to
to  ). The decreased efficiency and increased dynamic resistance might cause the quantum dots sensitized solar cell degradation.
Export citation and abstract BibTeX RIS

Original content from this work may be used under the terms of the Creative Commons Attribution 3.0 licence. Any further distribution of this work must maintain attribution to the author(s) and the title of the work, journal citation and DOI.
1. Introduction
Quantum dots (QDs) have been studied and widely applied in solar cells over two decades. First considerable research of Vogel and co-workers on CdS QDs deposited on  nanocrystal by successive ionic layer adsorption and reaction (SILAR) method had trivial power conversion efficiency (PCE) and was not recorded [1]. Thereafter, reported researches [2–4] on CdS or CdSe QDs analyzed by chemical bath deposition (CBD) method still did not have better results. Until 2008, there were numerous publications on quantum dots sensitized solar cells (QDSSCs) and the PCE also significantly increased. Reported QDSSCs using CdS or CdSe QDs by CBD with a suitable electrolyte reached the PCE of 1.03% [5–8]. The enhancing PCE of QDSSCs was the main researched problem at that time. In 2009, Chen et al deposited CdSe QDs onto
  nanocrystal and used DA agent as a linker to reduce charge loss, thus enhancing the PCE to 1.19% [9].
Single photosensitizer, such as CdS or CdSe QDs, used in some reports [1–10] limited the light absorption range and could not utilize fully visible domain. The strongest absorption wavelength of CdS and CdSe (in bulk) semiconductors are approximately 550 nm and 705 nm, respectively. Those values decrease when the materials are in nanoscale. Some researches applied linker agents as a direct connection between QDs and  nanocrystals but the PCE still could not be significantly enhanced [11–16]. Therefore, extending light absorption domain deeply into the visible region, reducing charge recombination and dark current were the main research problems which had to be figured out for enhancing the PCE of QDSSCs. By utilizing the combination of CdS and CdSe QDs, the PCE of QDSSCs was increased compared to cells that just had single photosensitizer due to the light absorption expansion [17–20].
From 2009 to 2012, numerous publications had been reported on QDSSCs using CdS/CdSe QDs directly absorbed on  nanocrystals or by CBD and SILAR methods, accompanied by polysulfide electrolyte and Pt counter electrode, the PCE reached 1.42% particularly in Chen and co-workers' research [10, 21]. QD core-shell structure was also investigated, the photovoltaic parameters and efficiency of CdS/CdSe core-shell structure QDSSCs were enhanced by Yu and co-workers' report [22–24]. The decline of charge recombination at QDs surface's traps and the increase of charge transfer into a
  layer rate were supposed to be the main reasons for the PCE enhancement in core-shell structure QDSSCs. Jung et al [25] passivated the CdS QDs surface by a thin ZnS layer, thus decreasing the charge recombination at
  /QDs/electrolyte interface [26]. The effect of passivation layer was affirmed by the report on PbS QDs with a CdS layer outside. However, there was not unification about the coating process of passivation layer [27].
As mentioned, most of the reported publications about the QDSSCs focused on how to fabricate photoanode, a counter electrode, an electrolyte and oxide semiconductors to enhance their PCE. However, the stability and degradation of QDSSCs have not attracted research attention. In a previous paper [28], we successfully synthesized the high performance of quantum dots sensitized solar cells based on  -doped CdSe quantum dots. In this work, we investigated the degradation of fabricated QDSSCs as a function of time by investigating the UV-Vis spectra, photocurrent-voltage
  curves and electrochemical impedance spectroscopy.
2. Experiment
2.1. Photoanode and counter electrode preparation
Preparation of mesoporous  films: FTO glass substrates (Dyesol, TEC15,
  ) were prepared by following steps: ultrasonic cleaning in soap solution for 30 min followed by deep washing in pure water and ethanol; dipping in 40 mM
  solution at
  in 30 min then washing with deionized water and drying before using. Mesoporous
  films were deposited onto cleaned FTO substrates via doctor-blading method followed by sintered at
  for 30 min.
Preparation of  photoanodes: Prepared
  films were immersed into the mixture of
  and
and  ionized solution for 5 min at room temperature then rinsed with ethanol to remove excess precursors and dried before the next dipping. The films were next dipped into
  solution for 5 min at room temperature followed by rising with methanol and drying. These steps are called one SILAR cycle. This process was repeated from 1 to 5 times.
Preparation of  photoanodes: The
  photoanodes were prepared similarly as described above. Briefly, the
  layers were immersed into
  ionized solution for 5 min at room temperature, then rinsed with ethanol to remove excess precursors and dried. The films were next dipped into
  solution for 5 min at room temperature followed by rinsing with methanol and drying. This cycle was repeated 3 times.
 counter electrode preparation: The
  counter electrode was prepared by CBD method. Briefly, 0.24 g
  was dissolved in 60 ml deionized water in a three-necked round bottom bottle.
  gas was flowing through the water for 10 min to remove the dissolved oxygen from the system.
 was next mixed in the solution and the color turned to light green. After, clean FTO glass substrates were immersed in the solution so that their conductive surface faced down and had an angle against the wall. The bottle was then boiled in the oil bath of
  and kept for 1 h. The
  crystal would directly grow onto the conductive surface of FTO glass. Finally, the
  electrode was rinsed with deionized water, dried in the air, followed by rinsing in
  atmosphere at
  for 30 min.
Preparation of QDSSCs: The polysulfide electrolyte was prepared by dissolving 0.5 M  , 0.2 M S and 0.2 M KCl in the mixture of deionized water and methanol solution (ratio 7:3 in volume). Completed QDSSCs consisted of photoanode and counter electrode adhesive by surlyn layer heated at
  .
.
2.2. Measurement
Field-effect scanning electron microscope (FESEM, 7401F) of Ho Chi Minh City Institute of Physics was used to investigate the surface morphology and composition of photoanode using the voltage of 10 kV. The UV-Vis spectra were characterized by the JASCO V-670 device of Applied Physical Chemistry lab of University of Science, Vietnam National University—Ho Chi Minh City. The crystal structure was analyzed using an x-ray diffractometer (Philips, PANalytical X'Pert,  radiation) and Photocurrent-voltage measurements were performed on a Keithley 2400 source meter using simulated AM 1.5 sunlight with an output power of
  produced by a solar simulator (Solarena, Sweden). The electrochemical impedance spectroscopy (EIS) was carried out with the use of an impedance analyzer (ZAHNER CIMPS).
3. Results and discussion
Prepared photoanodes was imaged by optical microscope for fissure checking. Cracked anodes were eliminated since they had huge internal resistance. The surface of photoanodes, as can be seen in figure 1, was soft and did not contain any breakages. Moreover, the layer color turned darker when more QDs were assembled.
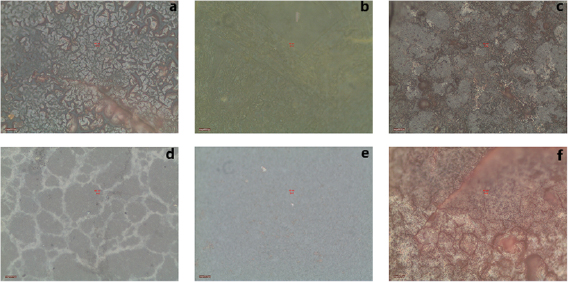
Figure 1. Checking the surface of prepared photoanodes by optical microscope for eliminating the cracked ones after SILAR process.
Download figure:
Standard image High-resolution imageFor the photoanodes' surface morphology, cross-sectional FESEM images had been carried out at different resolutions. The average dimension of nanocrystal clusters was from 38.5 to 46.9 nm, as can be measured from figure 2(a). These clusters had huge dimension since TiO2 nanocrystals, which were 15 to  diameter each, were assembled by CdS and
  QDs. Furthermore, each layer could be observed in a certain order: conductive FTO layer and
  were approximately 511.9 nm and
  , respectively.
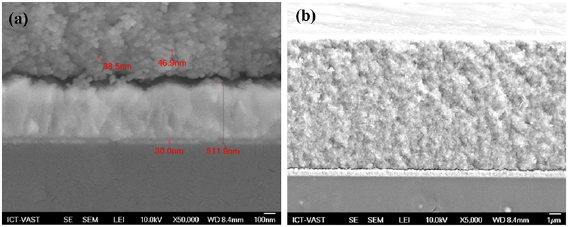
Figure 2. Cross-sectional FESEM images of  photoanode in (a) 100 nm and (b)
  resolution.
Download figure:
Standard image High-resolution imageThe degradation of absorption intensity of electrolyte immersed photoanode as a function of time had been investigated. According to Kamat et al [3], QDs react with electrolyte, thus decline the activation of electrolyte and QDs. Reactions occurring in QDSSCs were listed below:
Aqueous electrolyte solution,  had dynamic balance

When CdSe QDs absorbed an excited energy then generated an electron-hole pair followed by


Reaction at the CdSe/electrolyte interface

The absorption intensity of electrolyte solution decreased significantly after 4 days of immersion, as illustrated in figure 3(a). This proved the assumption that there was a huge effect of charge transfer reactions between QDs and electrolyte. Aforementioned reactions from (1) to (4) generated by-products thus declined the absorption intensity and PCE of QDSSCs.

Figure 3. (a) UV-Vis and (b) XRD spectra of  photoanode immersed in the polysulfide electrolyte in different periods of times.
Download figure:
Standard image High-resolution imageSince QDs always react with polysulfide electrolyte  , the photoanodes were immersed in an electrolyte solution in different periods of time, then rinsed at the same temperature to investigate the effect of time on properties of photoanodes. XRD spectra (figure 3(b)) of photoanode immersed in electrolyte for 4 days had signs of deterioration and two extra peaks appeared at 37.90 and 520 corresponding to cube CdO nanocrystal [28, 29]. While there was no extra peak in the spectra of one-day-immersed photoanode. Significant peaks in XRD spectra were slightly shifted and depressed as compared to non-immersed photoanodes. Those results proved that QDs were corroded in polysulfide electrolyte.
Besides the degradation of polysulfide electrolyte absorption intensity and photoanode structure, the attenuation of photoanode absorption ability was also investigated. There was a significant decline of photoanode absorption intensity after 4 days. This result matched with the aforementioned XRD and UV-Vis spectra of electrolyte (figure 4). Hence, the reactions between photoanode and electrolyte generated by-products (CdO) thus decreased the activation of QDs.
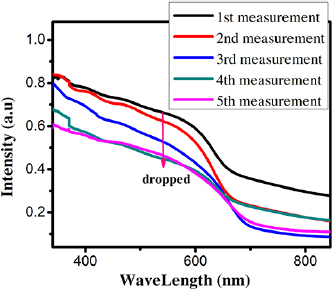
Figure 4. UV-Vis spectra of  photoanode analyzed at different times.
Download figure:
Standard image High-resolution image curves of QDSSCs as a function of time (0–4 d) were investigated to evaluate the stability of QDSSCs. The results were listed in table 1. The PCE significantly decreased from 3.77% to 1.52% after 4 days since the short-circuit current density declined from 18.99 to
  , while FF and open circuit voltage were almost unchanged. This result accorded with above consequences and [30]. Wang et al found that the degradation of CdSe-QDSSCs is rather fast and when the cell was left in room atmosphere for only one day, the efficiency loss of 40% was observed, and an efficiency loss more than 80% was observed in three-day's ageing [30]. The series and the shunt resistance increase with the ageing process. Saunders et al discussed the phase separation of nanoparticle polymer photovoltaic cells [31], and Yang et al reported that hybrid polymer-CdSe solar cells degraded after being left in the air environment for merely a few hours [32]. In most cases, CdSe QDs could be oxidized at the surface to raise the resistances of QDSSCs and discussed in figure 5.
Table 1. Photovoltaic parameters of QDSSCs excerpted from  curves and EIS spectra.
| QDSSCs | Time |  |
 |
 |
 |
 |
 |
 |
|---|---|---|---|---|---|---|---|---|
| 1st measurement | 0 d | 18.99 | 0.38 | 0.52 | 3.77 | 17.05 | 204.5 | 24.65 |
| 2nd measurement | 1 d | 13.6 | 0.36 | 0.53 | 2.63 | 17.22 | 203.4 | 75.03 |
| 3rd measurement | 2 d | 12.8 | 0.31 | 0.54 | 2.10 | 19.31 | 444.9 | 90.7 |
| 4th measurement | 3 d | 11.8 | 0.32 | 0.53 | 2.05 | 20.26 | 501.8 | 206.2 |
| 5th measurement | 4 d | 9.5 | 0.30 | 0.54 | 1.52 | 19.35 | 780.1 | 466.7 |

Figure 5. (a)  curves of QDSSCs at different time measurements; (b) structural diagram of QDSSCs; (c) equivalent circuit of QDSSCs; (d) EIS spectra of QDSSCs at different times and (e) the phase bode.
Download figure:
Standard image High-resolution image
Figure 5(c) illustrated the equivalent circuit of a typical QDSSC, including the series resistance, and capacitance and resistance of  /QDs/electrolyte and counter electrode/electrolyte interface. The EIS was carried out at different times and the results were illustrated in figure 5(d) and table 1. In figure 5(d),
  ,
,  and
and  represent for series resistance, charge recombination at the
  /electrolyte interface, and charge transfer at
  /QDs interface and within
  layer, respectively. These values were calculated by fitting with an equivalent circuit illustrated in figure 5(c) by specialized software.
Generally, there were 3 main semi-circles in EIS spectra of QDSSCs, including: low frequency semi-circle corresponding to  , medium frequency semi-circle corresponding to
  , and high frequency semi-circle representing the charge diffusion in an electrolyte
  . When the medium semi-circle expanded, there was a mix of 3 semi-circles. Moreover, the alteration of short-circuit current density, mostly related to the resistance of
  /QDs interface and
  layer, hence we focused on investigating the change of
  and
and  . As can be seen in figure 5(d), semi-circles were expanded at different measurements, which corresponded to the increment of
  from 204.5 to
  . Therefore, the significant enhancement of
  and
and  /QDs interface resistance caused great obstruction for charge diffusion, increased the recombination rate of charges in the conduction band with holes in the valence band of QDs and
  , thus declined the PCE of QDSSCs. Similarly,
  was also increased from 24.65 to
  and limited the charge recombination at the
  /electrolyte interface [31–38].
Figure 5(e) shows the phase bode of the devices with the different measurements. It was used to investigate the charge diffusion in an electrolyte. There was a peak shift of the phase bode toward the high frequency due to the limit of diffusion in an electrolyte. This result agrees well with [30, 36–38]. In addition, Wang et al reported that the cell aged in the phase angle curve from 1 day to 5 days shifted towards the higher frequency regime. Generally, response on high frequency indicates a bulk like behavior because the oxidation of CdSe QDs generates more bulk-like defects in the QDs, which further decreases the performance of CdSe QDSCs [30].
4. Conclusion
We had successfully fabricated QDSSCs with  counter electrode and
  photoanode, whose greatest PCE was 3.8%. In this work, we also investigated the PCE degradation of QDSSCs. The increment of dynamic resistance (Rct1 increased from 204.5 to
  and
and  increased from 24.65 to
  ), which was the results of reaction between photoanode and electrolyte, was the main cause of PCE reduction.
Acknowledgments
This research is funded by Vietnam National Foundation for Science and Technology Development (NAFOSTED) under grant number 103.03-2016.94. The authors would like to thank University of Science, VNU-HCM, Vietnam.