

Abstract
The present paper describes different methods for storing the benzotriazole (BTA) corrosion inhibitor in the titanium dioxide nanotubes (TNT) as nanocontainers. Three methods were used, including the vacuum impregnation at ambient temperature, the vacuum impregnation at cooling temperature ( ) and the rotary vacuum evaporation. TNT, BTA and BTA/TNT products were characterized using scanning electron microscopy (SEM), transmission electron microscopy (TEM), Brunauer-Emmett-Teller (BET) surface area, differential scanning calorimetry (DSC), thermogravimetric analysis (TGA) and Fourier transform infrared (FT-IR) spectroscopy.
  nanotube powder was synthesized by hydrothermal treatment from the inexpensive spherical commercial
  precursor. The results obtained from SEM, TEM images and BET values showed the successful synthesis of TNT with a homogeneous morphology of nano size tubes and a large specific surface
  . The existence of BTA in TNT was demonstrated. The BTA/TNT obtained via the rotary vacuum evaporation contained a very significant amount of BTA (66.6 weight %) but BTA existed mostly outside the nanotubes. Two processes of vacuum impregnation at ambient temperature and vacuum impregnation at cooling temperature revealed that there was about 8 weight % BTA stored in BTA/TNT product and BTA was present mostly inside the nanotubes.
Export citation and abstract BibTeX RIS

Original content from this work may be used under the terms of the Creative Commons Attribution 3.0 licence. Any further distribution of this work must maintain attribution to the author(s) and the title of the work, journal citation and DOI.
1. Introduction
Titanium dioxide  nanostructured material is a well-known, well-studied material and used widely in the industry due to its chemical stability, biodegradability, physical property, optical property, electrical property ...[1, 2]. Among the nanostructured
  materials,
  nanotubes (TNT) formed with high specific surface possess many applications such as solar photovoltaic cells, gas sensors, hydrogen storage devices, drug delivery in medicines ...[3, 4].
1,2,3-benzotriazole (BTA,  ) has been proven to be one of the effective corrosion inhibitors for many metals and alloys by preventing unwanted reactions on the surface [5–7]. As a result, BTA controls or slows the corrosion. Protecting metals and alloys from the corrosion by using an inhibitor is called active anticorrosion [8, 9]. This can be prepared by directly adding the corrosion inhibitor into the passive coating or adding the nanoparticles containing corrosion inhibitor into the passive coating. However, research of Zheludkevich et al showed that a direct addition of corrosion inhibitors into passive coating had a negative effect on their corrosion resistance, resulting in the inactivity of inhibitor [10]. Thus, over the past decade, there have been many studies on nanoporous materials or nanotube materials for storing corrosion inhibitors, also known as nanocontainers, in self-healing coatings for corrosion protection [11–13].
Nanocontainers are dispersed in the coating and can release the inhibitor when the metal surface is damaged. With this intelligent solution, the coating stores the inhibitor and avoids any harmful interaction between the inhibitor and the binder. This method also avoids the inhibitor washout and ensures an intelligent and sustainable delivery of the inhibitor when required.
In this research we used TNT as a nanocontainer for BTA storage because this material has a large specific surface, high temperature resistance, chemical resistance... This approach has been studied extensively. However, almost all  materials have been synthesized from expensive materials such as titanium alkoxide or titanium foil. Here we present a simple method for the synthesis of BTA/TNT from cheap commercial
  by hydrothermal treatment.
2. Experiment
2.1. Materials
Spherical commercial  (
( , 99.4%) of industrial grade was purchased from ROHA Dyechem (Vietnam) with average diameter of 100÷150 nm. 1,2,3-benzotriazole (BTA, 99%) was purchased from Sigma-Aldrich. Sodium hydroxide, ethanol, hydrochloric acid... were of analytical grade. All chemicals were used as received without any further purification.
2.2. Synthesis of TNT nanocontainer
TNT was prepared by hydrothermal treatment of  . Mixture of
  and NaOH 10 M solution (
 :NaOH molar ratio of 1:23) was stirred continuously for 1 h [14]. The mixture was autoclaved for hydrothermal treatment at
  for 24 h. The solid in the autoclave was then filtered, washed with distilled water, soaked in dilute hydrochloric acid solution for 1 h and then rinsed with distilled water until neutral pH. At the end of the process, the solid was dried at
  for 12 h and then calcined at
  for 2 h with a heating rate of
  . The resulting product is symbolized as TNT.
2.3. Storage of BTA into TNT nanocontainer
In this study, we used the vacuum impregnation and the vacuum evaporation to introduce BTA into  nanotubes. The processes were carried out in the dark to avoid the BTA degradation by light.
2.3.1. Method of rotary vacuum evaporation.
Firstly, a solution containing 50 ml of ethanol and 0.5 g of BTA was prepared. Secondly, 0.35 g of TNT was added and stirred for 24 h. The mixture was then introduced into an evaporation flask for a rotation of 150 rpm in 30 min. During the rotation, ethanol was evaporated while BTA was retained on TNT. The solid in the flask was dried at  for 24 h. The obtained product was denoted as BTA/TNT (rota.eva).
2.3.2. Method of vacuum impregnation.
A schema of vacuum impregnation is presented in the figure 1. An amount of 0.35 g of TNT was introduced into the glass jar, which was then sealed and vacuumed for 6 h to evacuate the air in the TNT (vacuum step). Then a solution containing 50 ml of ethanol and 0.5 g of BTA was slowly introduced and kept for 24 h (impregnation step). Due to pressure difference between the outside and the inside of  tube, BTA moved into the
  tube. The TNT loaded BTA was recovered by centrifugation and dried at
  for 24 h.

Figure 1. Schema of vacuum impregnation.
Download figure:
Standard image High-resolution imageThe vacuum impregnation was performed at two different temperatures which were ambient temperature and  (controlled by ice water bath). The difference of these two methods was demonstrated at the vacuum step. At ambient temperature vacuum, it was called normal temperature impregnation (abbreviated as norm.imp). When the glass jar was placed in an ice water bath, this process was called cooling temperature impregnation (abbreviated as cool.imp). The purpose of cooling temperature impregnation was to lower the pressure in the glass and to load more BTA into TNT. The resulting products were denoted as BTA/TNT (norm.imp) and BTA/TNT (cool.imp), respectively.
2.4. Characterization
Some characterizations were combined to evaluate TNT, BTA/TNT products. The morphology was examined by TEM and SEM images. The BET specific surface was measured using nitrogen isotherm adsorption on ASAP2020 (Micromeritics). The BTA storage was evaluated by TGA-DSC thermal analysis on STA6000 (Perkin Elmer) and by FT-IR spectroscopy on Nicolet iS10 (Thermo Scientific™). Thermal analysis was executed at a temperature range of  with heating rate of
  in inert
  atmosphere with flow rate of 20 ml min−1. FT-IR spectra were recorded by transmission mode using KBr pellets, within the
  range.
3. Results and discussion
3.1. Morphological analysis
SEM images in figure 2 show that spherical  powder of about 100÷150 nm diameter was transformed to the tubular
  after hydrothermal treatment. The TNT structure is quite uniform.

Figure 2. SEM images of  (a) and TNT (b).
Download figure:
Standard image High-resolution imageThe size of TNT is observed clearly on the TEM image in figure 3(a). TNT has a diameter of 10÷12 nm and an average tube length of 100 nm. These images show that the hydrothermal process has successfully transformed  into
into  nanotubes. This result indicates an increase of
  's specific surface.

Figure 3. TEM images of TNT(a), BTA/TNT (norm.imp) (b) and BTA/TNT (rota.eva) (c).
Download figure:
Standard image High-resolution imageIn comparison with the TEM image of BTA/TNT (norm.imp) obtained from vacuum impregnation at ambient temperature (figure 3(b)), most of the empty space inside the tubes is no longer clearly seen. This phenomenon proves the presence of BTA in  tubes. The difference between the vacuum pressure inside the tubes and the atmospheric pressure outside the tubes created favorable conditions for the BTA moving into the
  tubes.
However, the TEM image of BTA/TNT (rota.eva) product from rotary vacuum evaporation (figure 3(c)) shows the opposite.  tubes are mostly transparent, but there are many particles of larger diameter accumulated at TNT orifice. It can be seen that, in this case, BTA does not enter the tube but lies outside the tube. This phenomenon is due to the pressure difference between the outside and the inside of the tube not being great enough for BTA moving into the tube.
3.2. Specific surface evaluation
Results of the BET surface measurements by the isotherm adsorption on ASAP2000 are presented in table 1. The specific surface area of TNT increases significantly, approximately 11 times higher than that of  . This further confirms the success of the transformation of spherical
  to nanotube
  by using a concentrated NaOH solution.
Table 1. Isotherm adsorption curve and BET specific surface of  products.
 |
Isotherm adsorption | BET surface ( ) ) |
|---|---|---|
 |
 |
9.6 |
| TNT |  |
105.9 |
| BTA/TNT (norm.imp) |  |
59.6 |
| BTA/TNT (rota.eva) |  |
25.2 |
In addition, it was found that the specific surface of BTA/TNT (norm.imp) is much smaller than that of TNT. This may be explained by the fact that BTA molecules entered the nanotube and occupied the tube space. Thus the specific surface of TNT precursor reduced by half. And BTA/TNT (rota.eva) specific surface has a quarter of TNT. This shows that the accumulation and lumping of BTA at TNT orifice have reduced significantly the free surface of TNT.
Maximum adsorption volumes of nitrogen on the adsorption and desorption isotherm curves illustrate further the specific surface area of each type of TNT.
3.3. TGA-DSC analysis
The thermal analysis of BTA precursor is presentted in figure 4. On the DSC curve, a clear endothermic peak starts at  and ends at
  , while on the TGA curve, the BTA weight does not change within this temperature range. This indicates that
  is the melting point of BTA and the BTA is melted completely at
  . Therefore, during the preparation, BTA/TNT products were only dried at a maximum temperature of
  . The TGA curve also shows that BTA begins to decompose at
  and decomposes almost completely at
  . The strongest thermal decomposition happens at
  with a mass loss rate of 24.1% min−1 as on the derivative weight curve.
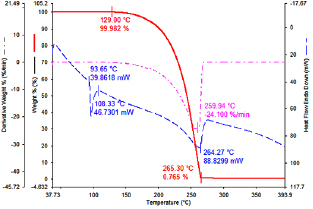
Figure 4. TGA-DSC analysis of BTA.
Download figure:
Standard image High-resolution imageTGA curves of TNT and BTA/TNT are displayed in figure 5. The TNT weight curve (figure 5(a)) indicates that the weight loss (ΔW) of 3.1% is due to the moisture evaporation, which occurs mainly within a temperature range of less than  . For BTA/TNT products, the weight loss is due to both steps: moisture evaporation and BTA decomposition. At
  , BTA is decomposed totally. It is assumed that the amount of moisture in BTA/TNT products is primarily from TNT because of its hydrophilicity. BTA amount in BTA/TNT products is then calculated as follows:

Figure 5. TGA analysis of TNT(a), BTA/TNT (cool.imp) (b), BTA/TNT (norm.imp) (c) and BTA/TNT (rota.eva) (d).
Download figure:
Standard image High-resolution imageThe calculation results of BTA amount in BTA/TNT are shown in table 2. It was found that concentrations of BTA present in BTA/TNT products from vacuum impregnation at cooling temperature and ambient temperature are approximately the same, about 8%. Meanwhile, the BTA amount contained in BTA/TNT (rota.eva) is nearly 67%.
Table 2. Weight loss of TNT and BTA/TNTs.
 |
% weight loss from  to to  |
% weight of BTA in BTA/TNT products | % weight loss from  to to  |
|---|---|---|---|
| TNT | 3.1 | 0 | 0.05 |
| BTA/TNT (cool.imp) | 10.8 | 8.0 | 7.7 |
| BTA/TNT (norm.imp) | 11.0 | 8.2 | 7.9 |
| BTA/TNT (rota.eva) | 67.6 | 66.6 | 4.5 |
The TGA curves of BTA/TNT (cool.imp) (figure 5(b)) and BTA/TNT (norm.imp) (figure 5(c)) demonstrate that the weight loss at maximum rate of about 0.3÷0.4% min−1, occurs at approximately  . Meanwhile, BTA is almost completely decomposed at
  (figure 4). On the TGA curve of TNT, the mass loss at
  is very small, considered zero. Therefore, the loss at
  of vacuum impregnation products is undoubtedly due to the decomposition of BTA. This allowed us to conclude that, BTA is stored in the
  tubes and is protected by TNT. As a result, the decomposition of BTA becomes more difficult and occurs at higher temperatures than pure BTA.
In figure 5(d), profiles of both the weight curve and the derivative weight curve of BTA/TNT (rota.eva) are very similar to that of the pure BTA in figure 4. A major loss occurs from  to
to  with a big value of 63.1%. In contrast, in table 2, the mass loss in
  range of BTA/TNT (rota.eva) is only 4.5%, while those of BTA/TNT (cool.imp) and BTA/TNT (norm.imp) are 7.7% and 7.9%, respectively. This result evidences that the BTA amount in BTA/TNT (rota.eva) is mainly outside the
  tube but less stored in the tube.
Therefore, it can be concluded that almost all of BTA amount in BTA/TNT products obtained via the two impregnation methods is only decomposed at a temperature range of  , thanks to the protection of
  .
.
3.4. FT-IR study
FT-IR spectrum of BTA in figure 6(a) with strong signals at  and
and  shows triazole ring stretching and adjacent C-H wag deformation, respectively [15]. In figure 6(b), TNT's FT-IR spectrum gives the strongest signal at
  indicating the stretching of Ti-O-Ti bond. In addition, signals at
  and
and  show the valence and deformation vibration of O-H bond.

Figure 6. FT-IR spectra of BTA (a), TNT (b), BTA/TNT (norm.imp) (c), BTA/TNT (cool.imp) (d) and BTA/TNT (rota.eva) (e).
Download figure:
Standard image High-resolution image
For BTA/TNT products, all FT-IR spectra exhibit individual peaks of BTA and TNT. In particular, on the BTA/TNT (rota.eva) spectrum, BTA signals appear very intense, equivalent to BTA precursor. This shows that BTA/TNT (rota.eva) contains large amounts of BTA but BTA is mainly outside the TNT tube, so its signal is very clear.
For BTA/TNT (norm.imp) and BTA/TNT (cool.imp) products, the BTA signal is quite clear, but less intense because BTA concentrations are much smaller than TNT. In addition, BTA is stored in  tubes, so vibration signals of BTA bonds are weak because of the TNT obstacle.
4. Conclusion proven to be strong
Results of the characterizations allow us to confirm the use of TNT as nanocontainer for BTA storage. BTA amount is about 8% weight of BTA/TNT. These nanocontainer materials will be used for self-healing coatings by the corrosion control in the next investigation.
Results obtained from the TGA analysis show that the cooling vacuum impregnation procedure has not proven to be strong in comparison with the vacuum impregnation at ambient temperature. The next research will still be conducted at cooling temperature, but the vacuum time and the impregnation time will be reduced but 8% BTA or more will still be delivered to TNT.
The rotary vacuum evaporation method can also be used to introduce BTA into TNT, but BTA is primarily outside the tubes. This situation will limit the ability for long time use of BTA/TNT (rota.eva) in self-healing coating. It is likely that the BTA will be washed away by rain or decomposed by sunlight or will form an unfavorable interaction with the binder.
Acknowledgments
All the authors are thankful to the Laboratory of Petroleum Engineering, Da Nang University of Science and Technology (DUT). This research is funded by Funds for Science and Technology Development of the University of Da Nang under grant number B2016-DN02-04.