

Abstract
The use of nanodiamonds in studies with living systems generally involves the modification of their surfaces with functional groups. Fluorescent molecules can be attached to these groups, so that one can know the exact position of the particles in each moment of the interaction with the cells. Here we modify the surface of detonation nanodiamonds and nitrogen-vacancy center nanodiamonds using carboxylation and hydroxylation procedures. Subsequent reactions with silicates and cysteine, before addition of fluorescein allow to obtain fluorescent nano-conjugates. We used confocal microscopy to observe the position of nanodiamonds interacting with HeLa cells. At 3 h post-incubation the green fluorescence is localized in extracellular rounded like-vesicles assemblies while at 24 h the conjugates can be observed inside the cells. The measurement of the fluorescence emitted by both conjugates allowed to find an enhanced emission of fluorescein isothiocyanate (FITC) when the nitrogen-vacancy center is present. We propose the existence of a fluorescence enhancement by electron transference process. The procedure described in this work allows the functionalization of nanodiamonds with FITC and other molecules using functional surface groups and small size mediators. Also, as was proved in our work, the nanodiamond-fluorescein conjugates can be used to track nanoparticles position within the cell. Localization studies are particularly important for drug delivery applications of nanodiamonds.
Export citation and abstract BibTeX RIS

Original content from this work may be used under the terms of the Creative Commons Attribution 3.0 licence. Any further distribution of this work must maintain attribution to the author(s) and the title of the work, journal citation and DOI.
1. Introduction
Nanodiamonds are among the most bio-safe nanomaterials. Their small sizes and vast surface available for functionalization lead the application of these nanostructures as potential drug carriers and also as nano-sensors [1]. Detonation nanodiamonds (DND) and fluorescent nitrogen-vacancy (NV) center nanodiamonds (ND) have been used to study their interaction with living systems and analyze aspects such as biocompatibility, penetration into cells, possibilities for drug delivery and contribution to imaging [2]. An efficient surface modification strategy allows the functionalization of nanodiamonds for drug delivery, while provides functional groups for linkage with other molecules, granting multi-functionalization. In that way we could, for example, track the path of the nanoparticle inside the cell, using a fluorescent molecule, and also know if the target can be reached by the therapeutic agent.
The conjugation of nanodiamonds with functional molecules can be achieved through mechanisms of physical adsorption and covalent coupling. As an intermediate step, a large number of surface ionogenic groups can be added (ether –COC, peroxide –COO, carbonyl –CO, and hydroxyl type C–OH bonding, etc) to provide electrostatically or chemically coupling with the functional molecule [3]. One common procedure used to modify nanodiamond surfaces is carboxylation. This method gives a homogeneous electric charge to the nanoparticle that promotes repulsion between diamonds and leads to better stability in suspension. Moreover, carboxyl groups can be easily activated and used to join different molecules, with a high affinity for interaction with proteins [4].
An approach for the application of nanodiamonds in bio-imaging is based on the use of NV-ND optical properties, due to NV centers intense color signal when excited with a specific laser wavelength [5]. Another strategy is coupling fluorescent chemical compounds, as rhodamine and fluorescein, to previously surface-modified nanodiamonds [6]. This method involves the surface modification with functional groups that are also useful to join antibodies, DNA or anticancer agents with specific therapeutic or diagnosis effects [7].
Intrinsic fluorescence in nanodiamonds responds to the presence of defects in the crystal lattice. Nitrogen-vacancy centers, that can be produced either naturally or artificially, are between the most used defects in fluorescent applications. Nitrogen impurities are usually present in the carbon lattice of diamonds. Nanodiamonds synthesized by high-pressure high-temperature procedure can contain up to 300 ppm of nitrogen [8]. Vacancies of carbon atoms in the diamond lattice, by their side, can be created by irradiation with high-energy particles. While subsequently annealing of nanodiamonds at approximately 800 °C produces the migration of the vacancies and their trapping by nitrogen atoms [9]. NV centers provide nanodiamonds with the emission of stable red fluorescence [10] that, together with biocompatibility, small sizes and a broad possibility for surface functionalization open opportunities for application in bio-imaging.
Although NV-ND have high photo-stability with no photo-bleaching or photo-blinking and a long fluorescence decay lifetime [11], the low absorption oscillator strength of a single vacancy results in a relatively low fluorescence when compared to organic probes with a brightness equivalent to tens of NV centers [12]. That is why some authors have proposed the conjugation of NV-ND with organic dyes that potentially enhance the absorption cross-section of nanodiamond particles, through process of energy transfer [12, 13]. Usually, this kind of process occurs when energy is transferred from an excited molecular chromophore (donor) to another chromophore (acceptor) in a non-radiative way [14].
The study of DND brings no evidences of substituted nitrogen atoms in the crystal lattices [15]. The emission of fluorescence by these nanodiamonds is attributed to surface effects but the quantum yield is low [16]. Chemical coupling of DND with fluorescent molecules could be a good way to find their positions at different instants inside the cell. The use of bioconjugates of nanodiamonds with targeting molecules and fluorescent immunodetection with secondary antibodies is also a current approach in the search for biomarkers in cancer [17].
Penetration of nanodiamonds into living cells is an important issue for biological applications. Diamond structures of 46 nm have been found in HeLa after 2 h of incubation [11], while 100 nm nanodiamonds have been internalized by cancer cells about 4 h after incubation [18]. Perinuclear and nuclear intracellular localization of DND have been observed and, apparently, penetration to cells and the exact localization of the particles depend on aspects as nanodiamond size, shape, state of aggregation, surface characteristics and incubation time [8].
In this work we modify the surface of detonation nanodiamonds and nitrogen-vacancy center nanodiamonds by using carboxylation and hydroxylation procedures, performing reactions with silicates and cysteine, and adding fluorescein isothiocyanate (FITC) to obtain nanodiamond- fluorescein conjugates for the application in cell studies.
2. Experimental
2.1. Nanodiamond surface modification and conjugation with FITC
Detonation nanodiamonds nanopure-G01, 4 wt%, were obtained from Plasmachem GmbH, USA and were disaggregated to sizes around 100–150 nm using bead assisted sonic disintegration with silica beads [19]. Carboxylated fluorescent nanodiamonds, 40 nm in size (1–4 NV), were from Adamas Nanotechnology, USA. Fluorescein isothiocyanate (FITC), (3-aminopropyl)triethoxysilane (APTES) and all the reagents used were obtained from Sigma-Aldrich Company, USA.
DND were carboxylated using a procedure similar to the one used by Liu et al [20]. Briefly, 200 mg of nanodiamonds powder were added into 15 ml of the mixture H2SO4:HNO3 (3:1) and heated at 75 °C on a stirrer plate for 24 h. Then, 1 ml of 0.1 M NaOH was added at 90 °C and stirred for 2 h. Next, 1 ml of 0.1 M HCl was added to the mixture at 90 °C and the dispersion was stirred 2 h more. Carboxylated nanodiamonds (cND) were washed with water four times before collecting the sediment and dry.
First estimation of carboxilated nanodiamonds size was accomplished by dynamic light scattering (DLS), using 632 nm laser wavelength, with a Zetasizer nano ZS (Malvern Instruments Ltd). Transmission electron microscopy (TEM) analysis was used to confirm DLS results. The measures were performed using a Jeol 2010F apparatus (JEOL Ltd, Akishima-shi, Japan) at 200 kV. Briefly, 10 ml of nanodiamonds suspension were deposited on a gold TEM grid and the sample was vacuum-dried for 24 h before observation.
The method followed to hydroxylate DND was similar to the one proposed by Solarska et al [21]. Carboxylated nanodiamond powder (30 mg) was re-dispersed in 30 ml of water and 4 g of FeSO4 were added. After mixing, 20 ml of H2SO4 were incorporated to the mixture and left stirring for 15 min. The addition of 20 ml of H2O2 was accomplished while stirring on ice for 30 min. Then, temperature was raised to 30 °C for 90 min, with sporadic sonication. After centrifugation, the pellet was re-dispersed in water, dialyzed and dried.
The reaction between DND and APTES was accomplished as follows: hydroxylated nanodiamonds (100 mg) were dispersed in 30 ml of absolute ethanol before adding 30 µl of NH4OH 29.4 % (by weight) and 20 µl of APTES. The mixture was stirred for 24 h and then centrifuged and washed with ethanol and water five times [22]. APTES is reactive to hydroxyl groups and will provide nanodiamond surface with amine groups.
The procedure used to modify fluorescent NV-ND surfaces with amine groups was different to the one used for DND. Carboxyl groups of NV-ND were activated using the standard N-ethyl-N'-(3-(dimethyl-amino)propyl carbodiimide hydrochloride/N-hydroxysuccinimide (EDC/NHS) activation reaction [23] in presence of cysteine. Briefly, NV-ND powder was added to a tube containing 500 µl of phosphate buffer solution (10 mM KH2PO4/K2HPO4, 0.9% NaCl (PBS)) while 4 mg of cysteine were dissolved in another 500 µl of PBS. Both tubes were mixed and 100 µl of EDC in water (1 mg/100 µl) were immediately added. After 1 h incubation at room temperature, 100 µl of NHS in water (1 mg/100 µl) were added and the reaction was maintained at room temperature for another hour. Finally, the mixture was centrifuged and nanodiamonds linked to cysteine were collected.
FITC is reactive to nucleophiles as amine and thiol groups [24], conjugation to DND was obtained through interaction with aminated surface while conjugation to NV-ND used cysteine's thiol groups. One mg of FITC was added to two tubes containing aminated DND and thiolated NV-ND in PBS, respectively. Mixtures were maintained at room temperature in the dark with periodic agitation. After 4 h, both tubes were centrifuged and resulting sediments were washed with PBS, re-dispersed and refrigerated until use.
2.2. Fluorescence measurement
Dilutions at 1% (weight) of nanodiamonds-FITC in PBS were prepared and transferred to a quartz cuvette. Measurement of excitation and emission spectra was achieved on a Fluorolog (Horiba JobinYvon, USA) using the software FluorEssence 3.5.1.99. The wavelength used for excitation was 480 nm. Data was analyzed using OriginPro 9.0.0 software.
2.3. Nanodiamond–cell interaction
HeLa cells (ATCC CCL-2), were grown on sterile coverslips incubated in Dulbecco's modified eagle medium (DMEM) with 5% fetal calf serum, 5% CO2. When the confluence of the cell monolayer reached 60–80% the cells were washed with PBS and incubated with 200 µl of 0.004% (weight) nanodiamond-FITC in DMEM. The cells were maintained at 37 °C, 5% CO2 for 3 h.
4',6-diamidino-2-phenylindole (DAPI) staining was achieved after washing with PBS and adding 1 ml of DAPI solution at 0.3 µM. The cells were nicely stirred in the dark for 20 min and then the solution was removed and 3 washing steps with PBS were performed, before observation at the microscope.
Visualization of the images of the interaction between nanodiamond-FITC conjugates and HeLa cells was accomplished using a confocal microscope Nikon Eclipse Ti (Japan). The laser beam was focused onto the samples by a 60× objective (N A 1.4 oil), and fluorescence images were acquired through the imaging software NIS-Elements. The viability of HeLa cells incubated with the nanodiamonds was measured using the well-known 3-(4,5-dimethylthiazol-2-yl)-2,5-diphenyltetrazolium bromide (MTT) assay [25]. Different dilutions of the nanoparticles in DMEM were assessed, while non treated cells were used as viability control.
3. Results and discussion
From the analysis with DLS and TEM, we could confirm that the starting nanodiamonds were at the sizes initially mentioned. DND were efficiently deagglomerated from 1000 nm to a main population around 150 nm; while NV-ND sizes were between 40–100 nm (figure 1). In order to obtain the nanodiamond-FITC conjugates, we applied two different procedures to test both and to have different options for later functionalization (figure 2). Both methods resulted equally effective and can be applied indistinctly because of FITC demonstrated affinity for either amine or thiol groups. Additionally, the use of APTES allows to attach other molecules reactive toward amine group such as rhodamine, antibodies and DNA molecules [26]. Using cysteine, the attachment of fluorescent dies as bromobimanes could be obtained, as well as a hybrid diamond-metal nanostructure with silver or gold nanoparticles through thiol group [27]. Both methods proved to be easy to achieve and relatively fast.
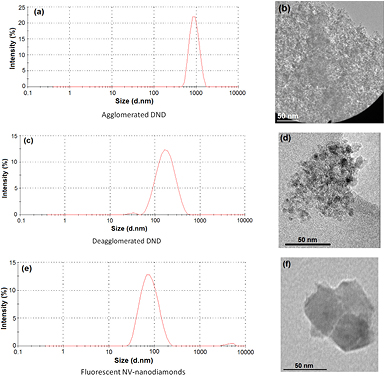
Figure 1. Size of the nanodiamonds measured by DLS ((a), (c) and (e)) and by TEM ((b), (d) and (f)).
Download figure:
Standard image High-resolution image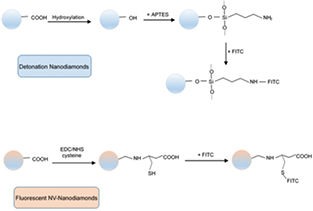
Figure 2. Schematic representation of nanodiamonds surface modification and conjugation with FITC.
Download figure:
Standard image High-resolution imageThe results of carboxylation and hydroxylation procedures were analyzed by Fourier-transform infrared (FTIR) spectroscopy. As can be seen in figure 3, C=O carbonyl stretching modes, corresponding to absorption at 1650–1850 cm−1, are reduced after hydroxylation, as well as the peaks at 3450 and 1635 cm−1, assigned to OH stretching vibrations, are found to be incremented. These results agree with a reduction of carboxyl groups and an increment in hydroxyl groups on nanodiamond surfaces after hydroxylation procedure. Peak positions are consistent with the bands described by Tu et al [28] for functionalized nanodiamonds.

Figure 3. FTIR normalized spectra of DND after carboxylation (black line) and after hydroxylation (red line).
Download figure:
Standard image High-resolution imageThe effective binding of nanodiamonds with FITC was confirmed by the measure of fluorescence in a fluorolog (figure 4). To obtain the emission spectra between 500–650 nm, we used excitation wavelength of 480 nm and integration time of 3 s. Excitation spectra were obtained fixing emission wavelength at 580 nm and integration time at 3 s. The arrangement of the detector in the fluorolog at a right angle to the excitation light beam prevents the detection of photons from the incident beam.
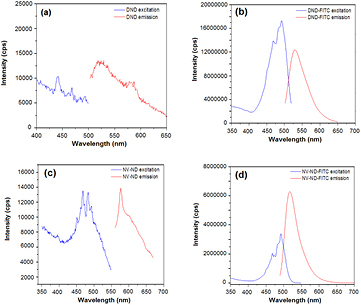
Figure 4. Fluorescence spectra of DND before (a) and after (b) conjugation with FITC, and NV-ND before (c) and after (d) conjugation with FITC.
Download figure:
Standard image High-resolution imageAfter excitation at 480 nm, sample of DND 1% (weight) in PBS exhibited very low fluorescence while DND conjugated with the fluorophore, showed excitation and emission bands in typical narrow, symmetric spectra, as is expected for FITC [29]. These bands of excitation at 490–500 nm and emission at 520–530 nm can be observed also in the case of NV-ND linked to FITC. As figure 4(c) shows, NV-ND without FITC exhibit an emission band at 575 nm, corresponding to the presence of neutral NV center (NV0). The band corresponding to negative charged NV center (NV−) at 638 nm is not observed. The presence of both kind of NV centers could be expected, but these nanodiamonds have only 1–4 centers by particle and a single state often dominates. In nanodiamonds with low nitrogen concentrations (less than 50 ppm) the NV0 state can be preferred [30].
Usually the emission band of a fluorophore looks like a mirror image of the band of maximum absorption (of the excitation spectrum) and the intensities of both bands are proportional. However, under certain circumstances, the relation between excitation and emission intensities becomes nonlinear and measurements may be distorted by artifacts such as self-absorption and the inner-filter effect [31]. Self-quenching of FITC molecules results in decreased intensities with increasing labeling density [32]. It means that nearby molecules are quenching each other, leading to a decrease of the total emission intensity. The emission band in figure 4(b) could be showing an effect like this one, although we did not perform emission lifetime experiments to verify it. Other effects that disturb emission intensities are those that increase the fluorescence emitted. In this case, the emission band of a system will be of higher intensity than the zone of higher absorption showed in the excitation spectrum; and this seems to be happening in figure 4(d). As we are only analyzing the effects observed for each particular system (not comparing with the others), we decided to show the raw data (uncorrected).
In figure 4(d), the position of the bands of higher excitation and emission correspond to FITC, meaning that the emission band observed for NV center alone (figure 4(c)) is not visible in this system. What is even more relevant: the intensity of the band of fluorescence emitted at 520 nm double the intensity of the light absorbed at 490 nm; suggesting that we are not seeing just the effect of FITC emission (it would be similar to figure 4(b)), but an effect of fluorescence enhancement is taking place.
For this system, the distance between nanodiamond surface and FITC is very short; cysteine is a small amino acid whose size is below 8 Å. Although it is generally considered that an effective transfer of energy takes place for distances between 10–100 Å [33], Fudala et al [12] found that FITC molecules located at a distance closer than 40 Å will participate in fluorescence resonant energy transfer (FRET). Considering that NV center could be in a range of 10–20 Å under nanodiamond surface, total distance is around 20–30 Å, allowing a possibility for the existence of the transfer.
In the case of FRET, the process takes place between two molecules, a donor and an acceptor, leading to a reduction in the intensity of the fluorescence emitted by the donor and an increase in the intensity of the fluorescence emitted by the acceptor [34]. One requirement of this process is the existence of an overlapping between the donor fluorescence spectrum and the acceptor absorption spectrum [35].
As we can see in figure 4(c), the band of NV center emission of fluorescence is located between 550–650 nm; while the FITC band of absorption is usually reported between 450–550 nm with a maximum around 490–500 nm [36]. In this way, it seems unable for NV centers to produce an excitation of FITC making FRET non-viable. Nevertheless, the results are clear about the enhancement of FITC emission when the pair NV-FITC coexists in the same particle. A more feasible explanation to these observations can be deduced from the analysis of figure 5.
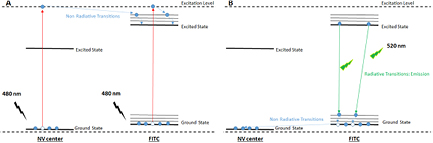
Figure 5. Schematic representation of the fluorescence enhancement by electron transference in the system NV-ND-FITC. (A) Excitation scheme, photoelectron from NV center is transferred to FITC excited state. (B) Emission scheme, more photons are emitted at 520 nm (FITC band) and no photons at 575 nm (NV-center band).
Download figure:
Standard image High-resolution imageWhen the conjugates are irradiated with light of λ = 480 nm, electrons from NV centers and FITC become electronically excited; FITC has a peak of excitation at 490 nm while NV center has one peak at 485 nm (see figure 4(c)). The relaxation of the excited to the ground state could be obtained by the emission of fluorescence at 520 nm in the case of FITC and at 575 nm in the case of NV. This is what happens when both agents are independently excited. Instead, in the case of the NV-ND-FITC conjugates, we observed only emission of light at 520 nm suggesting that NV centers do not emit, but donate their photoelectrons to FITC (figure 5(a)). This could be the explanation of the enhanced emission at 520 nm. More photons are produced at this wavelength and none emission is observed at 575 nm (figure 5(b)). Then, it is possible that the system is experiencing a process that we have called fluorescence enhancement by electron transference (FEET).
FEET could be a variant of photoinduced electron transfer (PET) process. A classic PET system is the one in which two units: a donor and an acceptor, are covalently bonded or spatially close, and the donor becomes excited under the incidence of light. As this system acts as a single, combined entity, the excitation is subsequently delocalized and the charge can be transferred to the acceptor unit. The system can relax back to the ground state releasing the energy in the form of heat or in a radiative way by the acceptor emission of light [37]. The occurrence of this phenomenon has been described before for several systems [38, 39], for example one in which carbon buckminsterfullerene was involved [37], and another using Zn2+/fluorescein probes [40].
The case we are dealing with in this work is different from the classic system described above in one aspect: both, 'donor' and 'acceptor' units become excited under light incidence at 480 nm. However, the fluorescent nanodiamonds and FITC are covalently bounded and can perform as a single entity. Once the photoelectrons are delocalized, the system undergoes relaxation to the ground state by the more favored way: emission at 520 nm. This explanation is consistent with the results observed and looks like the most possible justification. More studies need to be done to prove its accuracy.
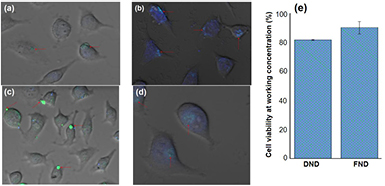
Next, we studied the interaction of nanodiamond-FITC with HeLa cell line. As figure 6 shows, the green fluorescence of FITC indicates the position of nanodiamonds, at 3 h and 24 h after incubation with the cells. The blue DAPI staining is indicating the position of the cellular nucleus. In figures 6(a) and (c), which correspond to the interaction of HeLa cells with DND-FITC and NV-ND-FITC, respectively, at 3 h, the blue color of DAPI almost cannot be seen. The presence of less blue color is indicative of a plane outside the cell, at the level of the cellular membrane. In this way, we can see that the green color of FITC attached to nanodiamonds is not inside the cell, and it is located, in both cases, in rounded structures like vesicles or over the membrane. This could be indicative of an internalization process mediated by the formation of vesicles that is still taking place at 3 h post-incubation.
Figure 6. Nanodiamond-FITC conjugates interaction with HeLa cells. (a) DND-FITC in HeLa at 3 h post-incubation, (b) DND-FITC in HeLa after 24 h, (c) NV-ND-FITC in HeLa after 3 h, (d) NV-ND-FITC after 24 h and (e) results of cells viability measured by MTT assay at 3 h post-incubation. Red arrows show the position of nanodiamonds-FITC.
Download figure:
Standard image High-resolution image
In the case of figures 6(b) and (d), corresponding to the interaction of nanodiamonds with cells at 24 h, the plane in which the green color is visible is the same in which the blue DAPI color is present, suggesting an intracellular position of nanodiamonds. These results indicate a complete internalization of nanodiamonds after 24 h, and are in agreement with previous observations of other authors. Nanodiamonds of 46 nm and 100 nm in size, were internalized by HeLa after 2 h and 4 h post-incubation, respectively [11, 18]. Martin et al [41] reported localization of nanodiamonds of 4 nm in sizes, treated with a hydroxylation procedure, in nucleus at 24 h. This way, our findings corroborate these results for internalization of NV-ND of 40 nm in size, functionalized with FITC, as well as for DND of sizes around 100 nm, linked to FITC. The position at nucleus at 24 h has to be external because of the nanodiamond sizes, suggesting a perinuclear localization. Figure 6(e) shows the percent of cells viability after 3 h of incubation with nanodiamonds, following the MTT assay. The values were higher than 80% in both cases, representative of the non toxic character of the nanoparticles.
The system proposed in this work can be useful for studies that need to follow the localization of nanodiamonds into the cell, either for pre-clinic steps of drug delivery evaluations or for in vitro diagnosis using nanodiamonds. Although DND linked to FITC is observable, the existence of the fluorescence enhancement process could make NV-ND-FITC conjugate more suitable for fluorescence studies. A more extensive analysis using longer incubation times could be accomplished in order to establish the incidence of this factor on long-term emission of fluorescence.
4. Conclusions
We applied two different procedures to modify DND and NV-ND surfaces with functional groups that allowed the bonding with mediators, cysteine and APTES. An effective conjugation of nanodiamonds with FITC was subsequently obtained. The detection of fluorescent particles interacting with HeLa cells was achieved by confocal microscopy and the perinuclear position of nanodiamonds could be observed at 24 h. This procedure is useful for in vitro studies with nanodiamonds, where positions into the cell are important and needs to be addressed. Extensive and detailed studies could be achieved to monitor the emission of fluorescence in time.
The enhancement of the fluorescence emitted by the NV-ND-FITC conjugate could be explained through the existence of a fluorescence enhancement by electron transference. We proposed a system in which photoelectrons from NV-ND are transferred to FITC increasing total intensity of the band at 520 nm. Because of the improvements in the emitted fluorescence, this system could be a good option for studies in which tracking of nanodiamonds by fluorescence microscopy is needed.
Acknowledgments
The authors would like to thank Consejo Nacional de Ciencia y Técnica (CONACyT) for the financial support of our research funds. The authors also gratefully acknowledge the laboratory facilities and support provided by Laboratorio de Cultivo Celular, Departamento de Ciencias Químico Biológicas, Universidad de Sonora.