


ABSTRACT
We investigated the physical nature of halo coronal mass ejections (CMEs) based on the stereoscopic observations from the two STEREO spacecraft, Ahead and Behind (hereafter A and B), and the SOHO spacecraft. Sixty-two halo CMEs occurred as observed by SOHO LASCO C2 for the three-year period from 2010 to 2012 during which the separation angles between SOHO and STEREO were nearly 90°. In such quadrature configuration, the coronagraphs of STEREO, COR2-A and -B, showed the side view of those halo CMEs seen by C2. It has been widely believed that the halo appearance of a CME is caused by the geometric projection effect, i.e., a CME moves along the Sun–observer line. In other words, it would appear as a non-halo CME if viewed from the side. However, to our surprise, we found that 41 out of 62 events (66%) were observed as halo CMEs by all coronagraphs. This result suggests that a halo CME is not just a matter of the propagating direction. In addition, we show that a CME propagating normal to the line of sight can be observed as a halo CME due to the associated fast magnetosonic wave or shock front. We conclude that the apparent width of CMEs, especially halos or partial halos is driven by the existence and the extent of the associated waves or shocks and does not represent an accurate measure of the CME ejecta size. This effect needs to be taken into careful consideration in space weather predictions and modeling efforts.
Export citation and abstract BibTeX RIS
1. INTRODUCTION
Halo coronal mass ejections (CMEs) are defined by the appearance of halo-like excess brightness surrounding the occulting disk in coronagraphs (Howard et al. 1982, 1985). They have been an important subject of study in space weather prediction because it is generally interpreted as evidence of propagation along the Sun–Earth line. The front-side halo CMEs as observed from the Earth are thought to be the progenitor source of interplanetary CMEs that impact the Earth and produce geomagnetic storms (Webb et al. 2000; Wang et al. 2002; Zhang et al. 2003, 2007). The projected angular width of the CME envelope is one of the most commonly used parameters in CME analysis (e.g., Wang et al. 2002). In this characterization, CMEs are often classified as halo (or full-halo), partial-halo, and non-halo CMEs by the angular width of, for instance, 360°, 120°–360°, and <120°, respectively (e.g., Webb et al. 2000; Wang et al. 2002; Lara et al. 2006). For the remainder of the Letter, we refer to full halo CMEs as "halo CMEs," and "non-halo CME" is used for both "partial-halo CMEs" and "non-halo CMEs."
It is generally accepted that the halo appearance is a projection effect related to the propagation direction of these events (e.g., Shen et al. 2013) and that there are no intrinsic physical differences between halo and non-halo CMEs. However, a few studies found that the geometric interpretation is inconsistent and that halo CMEs may be a different class of CMEs (Lara et al. 2006; Chen 2011; Wang et al. 2011). Lara et al. (2006) determined the distribution of the final height where CME fronts become too faint to track in white light images. Since the observation originates from Thomson scattering of white light from the underlying photosphere by the free electrons in the solar corona (e.g., Billings 1966), the observed intensity due to the scattering shall decrease rapidly with increasing distance of the electrons from the plane of the sky. Thus, it is expected that CMEs moving normal to the plane of the sky will quickly become faint in such white light images, while CMEs propagating close to the plane of the sky will be observed longer. Interestingly, it has been found that the final heights of halo CMEs seem to be systematically higher than those of non-halo CMEs, which suggests that the halo-like fronts should not be the observations of the mass moving toward the observers. In addition to the final observed heights, the speeds of halo CMEs tend to be faster than non-halo CMEs (Yashiro et al. 2004; Lara et al. 2006).
An explanation of such inconsistencies is that halo CMEs are the signatures of associated waves and/or shocks, which have a different morphology from the CME ejecta. It has been pointed out that the white light observations of CMEs may show the associated wave/shock fronts as the outer faint front of diffuse emission (e.g., Ontiveros & Vourlidas 2009; Vourlidas & Ontiveros 2009; Rouillard et al. 2012; Vourlidas & Bemporad 2012; Vourlidas et al. 2013; Kwon et al. 2013, 2014; Hess & Zhang 2014), while the CME ejecta themselves are observed as the inner bright frontal loop or the three-part morphology. Since the wave/shock front is wider than that of the ejecta front and propagating in all directions, it may favor the halo-like appearance surrounding the occulting disk in a coronagraph. In particular, Kwon et al. (2014) determined the 3D structure of a CME using the ellipsoid and Gradual Cylindrical Shell (GCS) models (Thernisien et al. 2006, 2009; Thernisien 2011) for the outermost faint front and the inner bright frontal loop, respectively. They showed that the halo-like front surrounding the occulting disk corresponds to the wave/shock front represented by the ellipsoid model. The ellipsoid shape can appear as a halo regardless of the viewing perspectives (see also Section 3.1 in Vourlidas et al. 2013).
In this Letter, we provide a definitive answer to the question of whether halo CMEs are only a matter of the projection effect due to their propagating directions. If the halo-like front is truly evidence of propagation along the Sun–Earth line, it would appear as a non-halo CME, if viewed from the side. The Solar Terrestrial RElations Observatory (STEREO; Kaiser et al. 2008) provides an unprecedented opportunity to observe halo CMEs from different viewing perspectives. STEREO consists of twin spacecraft, namely Ahead and Behind (hereafter STEREO-A and -B). They move nearly along the Earth's orbit around the Sun, ahead and behind of the Earth, and observe the Sun from different viewing perspectives simultaneously. When the separation angle is nearly normal to the Sun–Earth line, STEREO will show the side views of halo CMEs observed from the Lagrangian L1 point by the SOlar and Heliospheric Observatory (SOHO; Domingo et al. 1994) Large Angle Spectroscopic COronagraph (LASCO; Brueckner et al. 1995). In addition, we derive the 3D structure of a halo CME to clarify how a CME could be observed as a halo CME. In Section 2, we show the method and data. We present the results and offer discussions in Section 3, and conclusion is given in Section 4.
2. METHOD AND DATA
We studied halo CMEs observed by SOHO LASCO C2 coronagraph between 2010 and 2012. The identification of these CMEs was based on the SOHO LASCO CME catalog (Yashiro et al. 2004). The STEREO SECCHI (Sun Earth Connection Coronal and Heliospheric Investigation; Howard et al. 2008) COR2 images were used to investigate the side views of halo CMEs observed by C2. The field of view of the COR2 coronagraph is 3–15 R☉, overlapping with that of C2 (2–6 R☉). During that time span, the viewing directions of STEREO-A and -B were separated from the Sun–Earth line in ranges of 64°–128° and 69°–127°, respectively. Since the viewing perspectives of STEREO are nearly normal to the Sun–Earth line, each spacecraft can provide a clear side view of halo CMEs as observed by C2.
In addition to the statistical study, we also reconstructed the 3D structure of a sample halo CME, using a forward-fitting method developed in Kwon et al. (2014). Taking into account the appearance of CMEs and the underlying physical nature, they postulated the GCS and ellipsoid models for the 3D structures of the inner bright frontal loop (three-part morphology) and the outer faint front of diffuse emission, respectively. These models are constructed with geometric free parameters that specify the origins, orientations, and shapes. These free parameters are determined, iteratively, by comparing the modeled 3D shape with the observed CME morphology from multiple viewing perspectives, provided by SOHO, SDO (Solar Dynamics Observatory; Pesnell et al. 2012), and the two STEREO spacecraft. We used EUV observations taken by Extreme UltraViolet Imager (Wülser et al. 2004) of STEREO and the Atmospheric Imaging Assembly of SDO as well as white light images taken from SOHO LASCO C2/C3 and STEREO SECCHI COR1/COR2. Detailed explanations of the geometric models and the fitting process are given in Kwon et al. (2014).
3. RESULTS AND DISCUSSIONS
During the period of 2010–2012, 81 halo CMEs (⩾500 km s−1) were recorded on the SOHO LASCO CME catalog. Among these CMEs, we discarded poor events (remarked as "poor event" or "only C3" in the catalog), and then 62 events were selected. The left panel in Figure 1 shows the locations of STEREO-A (red circles) and -B (blue circles) with respect to SOHO (green circle), when halo CMEs were observed by SOHO LASCO C2. The first CME in the list occurred on 2010 April 3 and the last one was on 2012 December 2. As seen in this panel, the viewing perspectives of STEREO are nearly normal to the Sun–Earth line, so that the COR2 images can show the side views of the C2 halo CMEs.
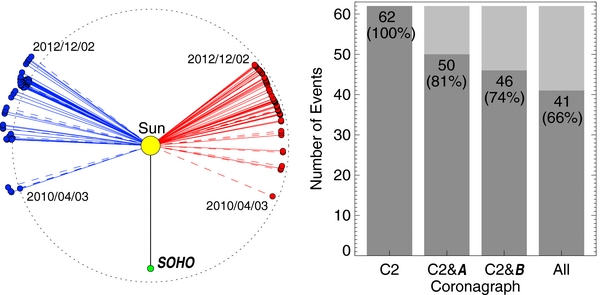
Figure 1. Left panel: locations of STEREO-A and -B with respect to the L1 point (SOHO), as viewed from the north ecliptic pole. Red and blue circles represent the locations of STEREO-A and -B, respectively, when halo CMEs were observed by SOHO LASCO C2 coronagraph. A yellow circle refers to the Sun, and a green circle represents SOHO located at the L1 point (D ≈ 0.9 AU). A dotted circle shows a distance of 1 AU from the Sun. Red and blue lines connect the Sun center to STEREO-A and -B, respectively. During the span of our analysis, the separation angles of STEREO-A and -B with SOHO increased from 64° (2010 April 3) to 128° (2012 December 2) and from 68° to 127°, respectively. Right panel: the number of halo CMEs observed by COR2-A and -B, among halo CMEs observed by C2. Dark bars represent the number of halo CMEs and bright bars are the counts of non-halo CMEs. The total halo CMEs from C2 is 62. Among these halo CMEs from C2, 50 (81%) and 46 (74%) events are observed as halo CMEs by COR2-A and -B, respectively. In addition, 41 (66%) CMEs are observed as halo CMEs by all observers. In the abscissa, "C2&A" and "C2&B" refer to the counts of halo CMEs observed by both C2 & COR2-A and C2 & COR2-B, respectively.
Download figure:
Standard image High-resolution imageWe carefully examined the time-series images of COR2-A and -B near the time when a halo CME was shown in the C2 images. If the primary cause of halo CMEs is the geometric projection effect, the C2 halo CMEs must be rarely observed as halo CMEs by such observers. The right panel in Figure 1 shows how many C2 halo CMEs are observed as halos by COR2-A and -B. Interestingly, 50 (81%) and 46 (74%) of the C2 halo CMEs are observed as halo CMEs by COR2-A and -B, respectively. Moreover, 41 (66%) events are observed as halo CMEs in all three coronagraphs. In addition, the solid and dashed lines in Figure 1 show whether the CMEs are observed as halos (solid lines) or not (dashed). We could not find any dependency on the viewing direction from this figure. This statistical result reveals that the halo appearance is not only a result of viewing direction. A CME could be observed as a halo CME, regardless of its propagating direction.
In order to further clarify this point, we selected a CME on 2012 March 18 as a sample event of this study and determined the 3D geometric structure of the CME and its associated wave, employing the GCS and ellipsoid models, respectively. On the day of the event, the separation angles of STEREO-A and -B with the Earth (SOHO) were 110° and 118°, respectively. The source region of this CME is located at the limb seen from SOHO, implying that the CME may propagate normal to the Sun–Earth line. Due to the wide separation angles, the source region is located close to the disk center and east-north limb in the images of COR2-A and -B, respectively.
Panels (a)–(c) in Figures 2 and 3 show the running difference images (subtracted by the previous time-step images) of COR2-B, COR2-A, and C2, respectively, with the derived 3D geometric structures. Panel (d) shows the derived 3D structures projected on the ecliptic plane as seen from the north pole. In Figure 2, the CME is not seen as a halo on the C2 image at 00:48 UT, while the COR2-A image shows a halo CME almost at the same time at 00:54 UT. The modeled 3D geometries in panel (d) show that the CME propagates toward STEREO-A, and the outermost front fully encloses the occulting disk on the plane of the sky of STEREO-A. On the other hand, the outermost front covers the occulting disk only partially on the planes of the sky of SOHO and STEREO-B.
Figure 2. Simultaneous observations of a CME on 2012 March 18 by SOHO LASCO C2 and STEREO SECCHI COR2-A and -B. Panels (a)–(c) show the running difference images taken nearly simultaneously around 00:54 (UT) from COR2-B, COR2-A, and C2, respectively. At the bottom-left corners, the observed times are represented. The fields of view of the COR2 and C2 images are 8 R☉ and 6 R☉, respectively. Gray disks at the center of these panels demarcate the same region where the heliocentric distance is less than 3.0 R☉. A white circle in each panel refers to the solar disk. Yellow curves represent the ejecta front modeled with the GCS model. The surface of driven wave/shock front modeled with the ellipsoid model is shown as blue, red, cyan, and orange colored lines. White lines outline the determined ellipsoid model. Black arrows show the propagating direction of the driven wave/shock. Dashed lines refer to the parts of the lines in the back side of the planes of the sky. Panel (d) shows the reconstructed 3D structures of the CME ejecta and the wave/shock as seen from the north ecliptic pole, with a field of view of 10 R☉. Black, red, and blue arrows point to the spacecraft, SOHO, STEREO-A, and -B. In addition, black, red, and blue lines represent the planes of the sky of SOHO, STEREO-A, and -B, respectively. The lengths of the lines correspond to the fields of view shown in panels (a)–(c). The determined 3D wave/shock front modeled with the ellipsoid model in all time steps is available in the HTML version of the journal: the geometric parameters of the ellipsoid model we determined are interpolated with one-minute intervals. Panel (d) shows the evolution of the ellipsoid as seen from the north ecliptic pole with a one-minute cadence. Panels (a)–(c) present the observations with the determined ellipsoid model which are closest to the time in panel (d).
(An animation of this figure is available.)
Download figure:
Video Standard image High-resolution image
Figure 3. Simultaneous observations of a CME on 2012 March 18 by SOHO LASCO C2 and STEREO SECCHI COR2-A and -B. Different from Figure 2, these images are taken nearly simultaneously around 01:54 (UT). The fields of view of the COR2 and C2 images are 12 R☉ and 6 R☉, respectively, while panel (d) shows the ecliptic plane up to 13 R☉, as seen from the north pole.
Download figure:
Standard image High-resolution image
Figure 3 shows the same sequence of images, but at a later time than in Figure 2. The outermost front has expanded in all directions, while the CME ejecta propagated mainly along the radial direction. At this time, the outermost front extends all the way around the occulting disk in all these sky planes. Apparently, the CME is observed as a "full" halo CME from all three viewing perspectives. The animation available with Figure 2 shows the three coronagraph observations and the determined 3D structure of the outermost front.
As discussed in detail in Kwon et al. (2014), the outermost front seen as the faint front of diffuse emission could be a spherically shaped fast magnetosonic wave/shock front. Our results imply that the outer envelope forming the halo CME is likely the signature of the CME-driven wave as discussed in Ciaravella et al. (2006), Ontiveros & Vourlidas (2009), Vourlidas & Ontiveros (2009), and Vourlidas et al. (2013), rather than the flux-rope-shaped CME ejecta. In this context, the difference in the average speed between halo and non-halo CMEs can be interpreted as follows; the fast CMEs are likely to be associated with the fast magnetosonic waves/shocks, thus forming a halo shape. In addition, the final heights of halo CMEs could be systematically higher than those of non-halo CMEs. The waves or shocks can propagate in all directions, deflecting coronal streamers. These wave/shock fronts and the deflected streamers would have a significant component on the sky plane in white light observations (Sheeley et al. 2000; St. Cyr 2005).
While the majority of C2 halo CMEs are observed as halos by either COR2-A or -B (55 out of 62 events), seven events are observed as halos solely by C2. These events are found to be significantly slower than the cases that are observed as halos by multiple viewing perspectives. The average speed of these events is found to be 731 km s−1 from the catalog, while that of all events is 1094 km s−1. In addition, it is found that the cases that are observed as halos by all viewing perspectives have the higher speeds with an average of 1247 km s−1. It is consistent with previous studies that the faster CMEs tend to be wider than the slower ones (Yashiro et al. 2004; Lara et al. 2006). Note that we have investigated halo CMEs faster than 500 km s−1.
This finding has obvious implications for studies of the CME morphology, direction, and physical properties. Fast CMEs with rapidly expanding shock fronts will appear as halos even if their source regions are quite close to the limb and thus are propagating away from the Earth. For such events, we expect strong asymmetry in the azimuthal brightness distribution as shown by an example of this study. The degree of asymmetry could be determined from a single viewpoint observation and used for estimating the true propagating direction of CMEs (e.g., Ling & Webb 2007; Moon et al. 2009; Na et al. 2013; Lee et al. 2014). However, note that the estimated direction is of the nose of the outer envelope (wave or shock front), rather than the flux-rope. Ontiveros & Vourlidas (2009) analyzed three events and showed that the radial direction of CME noses could be tilted around 30° with respect to the envelope noses, while we could not find a significant difference between the two radial directions from an example shown in Figures 2 and 3. Even if the angle is small close to the Sun, it may result in a huge separation close to the Earth because of the traveling distance from the Sun to the Earth. In addition to the propagating directions, it is clear that CME width has to be measured carefully and separately from that of the shock to produce reliable measures of CME expansion speed, mass, and energy (see Kahler & Vourlidas 2013). For instance, Kwon et al. (2014) showed that the angular width of a CME ejecta (⩽120°) is much smaller than the associated outer envelop (360°). This effect needs to be taken into careful consideration in space weather predictions and modeling efforts.
4. CONCLUSION
This Letter is intended to provide a definitive answer to the question of whether the apparent width of halo CMEs is merely a matter of geometric projection solely depending on its direction of propagation. From visual inspections of halo CMEs (⩾500 km s−1) using observations of SOHO and STEREO distributed over a wide range of heliolongitudes, we showed that halo CMEs could be observed from all viewing perspectives, regardless of their propagating directions. We selected an event reported as a halo CME by the SOHO LASCO CME catalog but the propagating direction is normal to the Sun–Earth line. We showed that the CME can be observed as a halo CME due to the associated fast magnetosonic wave/shock front, while the propagating direction of the ejecta is normal to the line of sight. Our results reveal that halo CMEs are the manifestation of possible spherically shaped fast magnetosonic waves/shocks, rather than those of expanding flux-rope-shaped CME ejecta. We conclude that the apparent width of CMEs, especially halos or partial halos is driven by the existence, and the extent, of the associated waves or shocks and does not represent an accurate measure of the CME ejecta size. This effect needs to be taken into careful consideration in space weather predictions and modeling efforts.
This work is supported by NSF ATM-0748003 and NSF AGS-1156120. A. Vourlidas is supported by NASA contract S-13631-Y to NRL. The SOHO LASCO CME catalog is generated and maintained at the CDAW Data Center by NASA and The Catholic University of America in cooperation with the Naval Research Laboratory. SOHO is a project of international cooperation between ESA and NASA. The SOHO/LASCO data are produced by a consortium of the Naval Research Laboratory (USA), Max-Planck-Institute für Aeronomie (Germany), Laboratoire d'Astronomie Spatiale (France), and the University of Birmingham (UK). The STEREO SECCHI data are produced by an international consortium of the NRL, LMSAL, and NASA GSFC (USA); RAL and Univ. Bham (UK); MPS (Germany); CSL (Belgium); IOTA and IAS (France).