


ABSTRACT
We present Subaru/IRCS J-band data for Fomalhaut and a (re)reduction of archival 2004–2006 HST/ACS data first presented by Kalas et al. We confirm the existence of a candidate exoplanet, Fomalhaut b, in both the 2004 and 2006 F606W data sets at a high signal-to-noise ratio. Additionally, we confirm the detection at F814W and present a new detection in F435W. Fomalhaut b's space motion may be consistent with it being in an apsidally aligned, non-debris ring-crossing orbit, although new astrometry is required for firmer conclusions. We cannot confirm that Fomalhaut b exhibits 0.7–0.8 mag variability cited as evidence for planet accretion or a semi-transient dust cloud. The new, combined optical spectral energy distribution and IR upper limits confirm that emission identifying Fomalhaut b originates from starlight scattered by small dust, but this dust is most likely associated with a massive body. The Subaru and IRAC/4.5 μm upper limits imply M < 2 MJ, still consistent with the range of Fomalhaut b masses needed to sculpt the disk. Fomalhaut b is very plausibly "a planet identified from direct imaging" even if current images of it do not, strictly speaking, show thermal emission from a directly imaged planet.
1. INTRODUCTION
In 2008 November, two teams announced what were described as the first directly imaged extrasolar planets around the nearby young stars HR 8799 and Fomalhaut (Marois et al. 2008; Kalas et al. 2008). Numerous studies recovered the three HR 8799 planets in archival data (Lafrenière et al. 2009; Fukagawa et al. 2009; Metchev et al. 2009; Currie et al. 2012); recent ones identify a fourth planet (HR 8799e; Marois et al. 2010b; Currie et al. 2011a) with a similar spectrum (Skemer et al. 2012; Esposito et al. 2012). Detailed dynamical and atmospheric modeling confirms that HR 8799 bcde are bona fide planets, not brown dwarfs (Mbcde ⩽ 9 MJ; Marois et al. 2010b; Currie et al. 2011a; Sudol & Haghighipour 2012).
In contrast, refereed follow-up studies have yet to confirm Fomalhaut b, casting serious doubt on its status. As noted by Kalas et al., Fomalhaut b's spectrum looks little like that expected for a substellar object, as it is detected in the optical but not in the infrared. Deeper IR data do not recover Fomalhaut b (Marengo et al. 2009; Janson et al. 2012). Kalas et al. describe Fomalhaut b's emission as being dominated by scattered dust emission surrounding a planet, with a thermal component at 0.8 μm and accretion-driven variability at 0.6 μm. However, Janson et al. (2012) argue, based on their detection limits, that essentially "none" of the optical emission originates from a planet, the 0.6 μm variability instead identifies a semi-transient dust cloud and thus Fomalhaut b is not a directly imaged planet. While Fomalhaut b seems to be a natural explanation for the well-confined debris ring (Kalas et al. 2005), shepherding planets unassociated with Fomalhaut b may provide an alternate explanation (Boley et al. 2012).
These doubts about Fomalhaut b's status call for new data to further constrain its IR emission and a reanalysis of the Hubble Space Telescope (HST) data from which Fomalhaut b was originally identified.
Thus, in this Letter, we present new Subaru/IRCS J-band imaging of Fomalhaut and a rereduction of Kalas et al.'s HST/ACS data. We use these data to constrain the near-IR emission from any planet corresponding to Fomalhaut b and revisit key results of Kalas et al. (2008): (1) Fomalhaut b's existence, (2) its spectrum, (3) 0.6 μm variability, and (4) its orbit.
2. OBSERVATIONS AND DATA REDUCTION
Subaru/IRCS data. We imaged Fomalhaut on 2009 August 16 in the Mauna Kea J-band filter behind the 0 8 coronographic spot with the Infrared Camera and Spectrograph (IRCS; Tokunaga et al. 1998) and the AO-188 adaptive optics system (FWHM = 006; 20.53 mas pixel−1) in observing blocks bracketing HR 8799 observations (Currie et al. 2011a) in angular differential imaging (ADI) mode (Marois et al. 2006). Between the two observing blocks, we rotated the instrument by ∼70° to keep the region covering Fomalhaut b visible on the detector (δPA ∼ 94°). Basic image processing follows steps listed in Currie et al. (2010, 2011a, 2011b).
HST/ACS data and basic processing. We downloaded HST/ACS data for Fomalhaut taken in the F435W, F606W, and F814W filters taken in 2004 and 2006 (Program IDs 10390 and 10598) from the MAST archive and processed with the OPUS pipeline.
The distortion-corrected Advanced Camera for Surveys (ACS) data are pocketed by cosmic-ray hits. We flag most of these cosmic rays in individual subimages by identifying 10σ outliers in concentric annuli roughly centered on the star in a median-filtered image with a moving-box length of 10 pixels. We register images by subtracting the first image in the sequence by a 180° rotation of itself, identifying the centroid position that minimizes the residuals, and then cross-correlating this image with the others to derive relative offsets. We reform the subimages together into data cubes, mean-combining them with nσ outlier clipping to mitigate other cosmic rays and hot pixels, and iteratively choosing the exact settings to maximize the signal-to-noise of background objects (derived at the end of our image processing: next subject heading).
PSF subtraction. We explored a range of methods to subtract the stellar point-spread function (PSF), including reference PSF subtraction, roll subtraction/ADI-based PSF subtraction, Locally Optimized Combination of Images (LOCI; Lafrenière et al. 2007), and adaptive LOCI or A-LOCI (Currie et al. 2012; T. Currie 2012, in preparation). For the Subaru data, we obtain the best sensitivity using LOCI (A-LOCI yielded no improvement). For the F435W and F814W data, the small number of images or random noise sources reduce (A)LOCI's effectiveness. We obtain the smallest subtraction residuals by performing roll subtraction separately for each integration time and averaging the results.
For the F606W data, A-LOCI provides the best results. The Currie et al. version filters images by their degree of speckle correlation and determines the combination of algorithm parameters that maximize the signal-to-noise ratio (S/N) of point sources. Here, we add two components. First, we add a "moving pixel mask," where the algorithm is prevented from using, in the PSF construction, pixels lying within the annular region we want to subtract (the "subtraction zone"; see Marois et al. 2010b; Soummer et al. 2011). Second, we also include frames from the reference star Vega in our A-LOCI PSF construction (a "PSF reference library"; Soummer et al. 2011).
3. RESULTS
3.1. Detections, Astrometry, and Photometry
As shown in Figure 1, we easily recover Fomalhaut b in all F606W data sets. With the noise defined in concentric annuli, the signal-to-noise ratios are S/N = 16 for the 30 2006 data (top left panel), 9 for the 18 2004 data (top right panel), and ∼8 for the 2006 18 data (not shown); the corresponding A-LOCI parameters are δ = [1,1,1], NA = [125, 150, 125], g =[1,1,1], dr = [10,5,5], and rcorr = [0.9,0.5,0.7]. Defining the significance of our detection within a 5–10 pixel annulus surrounding Fomalhaut b, we get S/N ∼ 10.2, 14.1, and 16.4 for the 2006 18 data, 30 data, and the combined data (bottom panel) and S/N ∼ 12.7 for the 2004 data. These estimates are about a factor of two higher than the best S/N estimates from Kalas et al. (S/N ∼ 8; P. Kalas 2011, private communication). The images include a background star (r, PA (2006) = 142, 203°) and two background galaxies (r, PA (2006) = 108, 135°; r, PA (2006) = 187, 234°). We do not conclusively identify any other candidate companions at 5σ, including at the location of Janson et al.'s (2012) candidate nor within the debris ring.

Figure 1. A-LOCI processed images of Fomalhaut from 2006 (top left; 30 coronagraph) and 2004 (top right; 18 coronagraph) F606W data. The insets in the upper left-hand corner are centered on Fomalhaut b and have a box length of ∼075 × 05. Image combining the 18 and 30 2006 data rotated by 66° and enlarged with the inner r < 175 region masked.
Download figure:
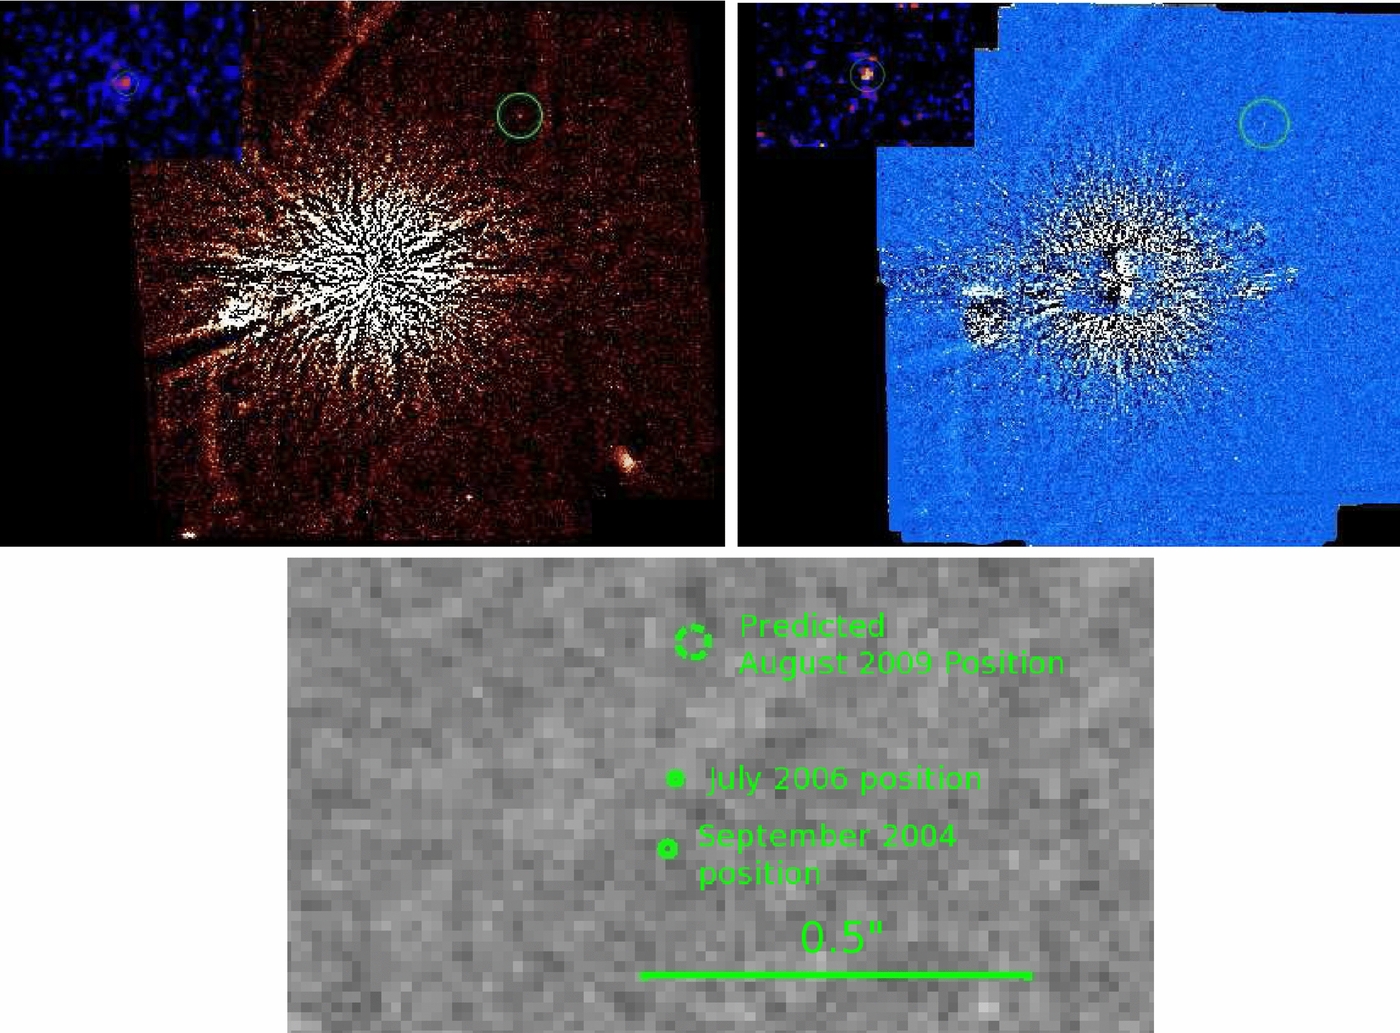
Standard image High-resolution imageWe also recover the F814W detection reported by Kalas et al. and report a new F435W detection of Fomalhaut b (S/N ∼6; Figure 2). However, we do not detect Fomalhaut b in the Subaru/J-band data (Figure 2).
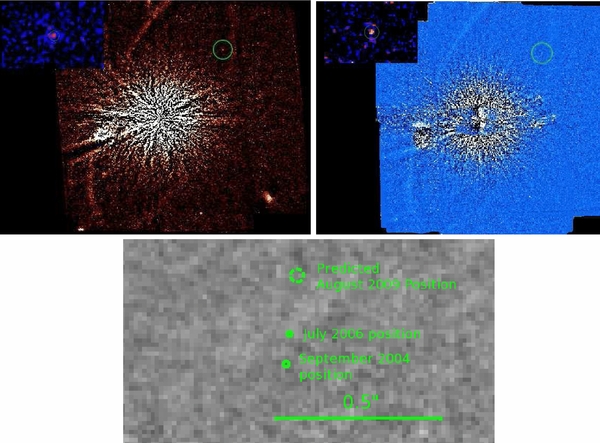
Figure 2. Roll-subtracted images of Fomalhaut in the F814W (top left) and F435W (top right) filters from 2006 HST data and LOCI-processed J band/1.25 μm from 2009 Subaru/IRCS data (bottom). The image scale for the F814 and F435 data is the same as in Figure 1; the IRCS image focuses on a small, ∼10 × 075 region centered on the measured and predicted positions for Fomalhaut b, with the 2009 (2004, 2006) circle size equal to the image FWHM (HST astrometric errors).
Download figure:
Standard image High-resolution imageTo measure Fomalhaut b's brightness in the HST (Table 1) data and to quantify Subaru upper limits, we use aperture photometry and determine/correct for throughput losses as in Lafrenière et al. (2007). Fomalhaut b is nearly unattenuated in A-LOCI reductions, a fact confirmed by comparing the F606W brightness of Fomalhaut b with photometry using reference PSF subtraction. For the 2006 F606W data, we derive a brightness of m = 24.97 ± 0.09. In the 2004 F606W data, we derive m = 24.92 ± 0.10. Fomalhaut b has not measurably varied in brightness between the two epochs, a result that appears insensitive to our choice of reduction method. Photometry at F435W and F814W imply that Fomalhaut b is near zero color (mF435W = 25.22 ± 0.18, mF814W = 24.91 ± 0.20). Our 5σ Subaru/J-band limits are m > 22.22.
Table 1. Fomalhaut b Photometry
| UT Date | Filter | Processing Method | Photometry | |
|---|---|---|---|---|
| (Vega) | ||||
| 20090816 | J | 1 | >22.22 (5-σ) | |
| 20060714–20 | F435W | 3 | 25.22 ± 0.18 | ⋅⋅⋅ |
| " | F606W | 2,4 | 24.97 ± 0.09 | |
| " | F814W | 3 | 24.91 ± 0.20 | |
| 20040926 | F606W | 4 | 24.92 ± 0.10 |
Notes. Processing Methods: (1) LOCI, (2) reference PSF subtraction, (3) roll subtraction, and (4) A-LOCI.
Download table as: ASCIITypeset image
We determine Fomalhaut b's position from the highest S/N data at each epoch (F606W), fitting a Gaussian profile (FWHM = 2.7 pixels). The astrometric uncertainties consider the intrinsic S/N, our precision in deriving absolute astrometric calibration, and differences in positions derived from the full range of PSF subtraction methods (reference PSF subtraction, LOCI, A-LOCI). Fomalhaut b's position changes in the 2006 (2004) data by σ[E, N] ∼ [10, 10] mas ([15, 5] mas) depending on exactly how we do the PSF subtraction. The S/N for Fomalhaut b and background objects is insensitive (δS/N < 5%–10%) to centroid offsets <13 mas (0.5 pixels) from the position that minimizes the subtraction residuals (see Section 2, paragraph 3).
Our analyses yield a 2006 position of [E, N]'' = [−8.615, 9.352]'' ± [0.016, 0.016]'' and 2004 position of [−8.598, 9.209]'' ± [0.020, 0.014]. Kalas et al.'s astrometry shows good agreement with ours in the 2004 North coordinate but otherwise differs by ∼0.5–1 pixels. Their astrometry also implies a larger space motion of ≈018 versus our ≈014.
3.2. Photometric and Astrometric Modeling
3.2.1. SED Modeling: Planet Mass Upper Limits
To interpret the infrared non-detections, we use the planet atmosphere models in Spiegel & Burrows (2012) for 1–10 MJ companions and Baraffe et al. (2003) for 0.5–1 MJ companions. Our comparisons help to determine whether any planet masses are consistent with the combined upper limits and with the range of masses needed for Fomalhaut to sculpt the debris ring. Here, we consider an age range of 100–500 Myr, encompassing age estimates from individual indicators in Mamajek (2012), where the best-estimated age is ∼450 Myr.
Figure 3 compares several classes of models to the optical detections and the IR upper limits. The optical spectral energy distribution (SED) matches the spectrum of light from Fomalhaut (blue–green line) scattered by small dust. Optical photospheric predictions for the planet models are more than 5 mag fainter than the 0.4–0.6 μm emission. Although the optical detections lie well above model predictions for gas giant planets, Janson et al.'s (2012) 5σ IRAC upper limit restricts Fomalhaut b's mass to less than 2 MJ for even the oldest ages. The J-band data also restrict Fomalhaut b's mass to be <2 MJ for younger ages, though useful limits at 400–500 Myr are entirely due to the IRAC data.

Figure 3. Left: Fomalhaut b photometry compared to model spectra from Spiegel & Burrows (2012) and photometry predictions from Baraffe et al. (2003) for 0.5–1 MJ planets at 120–500 Myr and fit with a scaled mid-A star photosphere (blue–green spectrum). The thick black lines and dotted black lines depict the transmission functions for the ground-based and Spitzer passbands, respectively. Right: ellipse fit to the debris ring from reference PSF-subtracted 30 F606W Fomalhaut data from Method 1 (units of counts s−1). The yellow (blue) dot identifies the star (disk center). Like Figure 1 (bottom panel), the image is rotated by 66°.
Download figure:
Standard image High-resolution image
However, the ground-based/Spitzer IR limits are still bright enough to be consistent with Fomalhaut b being a gas giant planet that sculpts the debris ring. The 5σ IRAC upper limits are comparable to the predicted brightness of a 400 Myr old, 1 MJ planet from both the Spiegel & Burrows (2012) and Baraffe et al. (2003) models. The Janson et al. (2012) upper limits are still ∼3 (30) times brighter than a 0.5 MJ planet at (120) 500 Myr, which is massive enough to sculpt the debris ring: in fact, this low mass is favored by detailed dynamical simulations (Chiang et al. 2009).
3.2.2. Nature of the Fomalhaut b Optical Emission
Following Kalas et al. (2008), a dust cloud producing Fomalhaut b's optical emission (mF606W, avg. = 24.95) at 119 AU requires a minimum cross-sectional area of σp ≈ 1.3 × 10¹⁸/Qs≈1.3 × 1018 m2. For spherically distributed dust, this implies a dust cloud radius of rc ≳ 0.0043 AU. Because Fomalhaut b is unresolved, the projected emitting radius of the cloud at F606W must be a ≲ 0.5 FWHM or ≈0.26 AU. The timescale for orbital shear to broaden a dust cloud of initial radius rc into a region of radius a with orbital period P is tm ≈ (a/rc)P (Kenyon & Bromley 2005).
From this Keplerian shear alone, an unbound dust cloud at the separation of Fomalhaut b would then smooth out into a resolvable (a > 0.26 AU) clump in 56,000 yr and a circumstellar ring in ≈25 Myr (≈1/18th of Fomalhaut's age). Other dust grain removal mechanisms (radiation pressure, Poynting–Robertson drag) operate on similar/shorter timescales. Unless we are fortuitously (and implausibly) identifying a very recent collision in a region with >10× lower optical depth (and thus far lower collision frequencies) than the debris ring (cf. Kalas et al. 2005, 2008; Boley et al. 2012), Fomalhaut b is not an unbound dust cloud.
3.2.3. Constraints on the Orbit of Fomalhaut b Derived from ACS Data
Comparing the 2004 and 2006 ACS astrometry implies a deprojected space velocity of v ≈ 3.7 ± 1.4 km s−1 or 33% slower than that derived by Kalas et al. If Fomalhaut b is a planet sculpting the debris disk, it should be nearly apsidally aligned with the disk and have a space velocity of ∼3.9 km s−1 (Chiang et al. 2009). While Kalas et al.'s velocity is ∼2σ deviant from apsidal alignment (5.5+1.1−0.7 km s−1), ours is consistent with that of an apsidally aligned object within errors.
Next, we compare Fomalhaut b's motion with the debris ring geometry, calculating the minimum distance between the companion and the disk midpoint (in angular separation). We explored a range of PSF subtraction methods for F606W 2004–2006 data sets to identify the combination that yields a high-S/N image of the disk with minimal levels of self-subtraction. Based on these criteria, we use a PSF-subtracted image of the 2006 F606W data obtained under the 30 spot with Vega as the reference star.
To model the disk and compute the planet–disk separation, we explored two methods to assess the robustness of our results. Method 1—We first select a wide annulus enclosing the disk emission, mask pixels with intensities roughly less than the 1σ noise floor (0.005 counts s−1), and determine a least-squares ellipse fit to the data.
We perform these steps for the raw image and a 10 pixel Gaussian smoothed image, average the results, and report the differences in the results as the fit uncertainties. Method 2—We divided the disk into 0 5 annular sections and fit the disk center at each section in four different ways.
- 1.A high-order polynomial fit to the surface brightness (SB) as a function of distance, taking the maximum value as the disk spine.
- 2.A Gaussian fit to the SB with the maximum of the Gaussian as the disk spine.
- 3.The peak pixel value
- 4.The mean distance from all points >90% the value of the peak pixel as identifying the disk spine.
We then averaged the separately determined disk radii, calculated x, y positions of the disk spine and uncertainties, and derived a least-squares ellipse fit. As with Method 1, we performed these steps on the raw image (5 pixel binning) and a Gaussian smoothed image (3 pixel binning).
Figure 3 (right panel) depicts our ellipse fitting from Method 1. Compared to Kalas et al. (2005), we obtain similar values for the disk properties. From Method 1, we obtain 137.6 ± 0.5 AU, 61.6 ± 0.1 AU, and 1567 ± 02 for the disk major axis, minor axis, and position angle. From Method 2, we obtain 140.9 ± 1.7 AU, 58.0 ± 0.3 AU, and 1566 ± 02. From Method 1, Fomalhaut b appears to move closer to the disk by 0026 (1715 to 1689), whereas Method 2 yields an even smaller deviation of 0002 (1712 to 1710). This change is less than or equal to our quadrature-added astrometric errors for either the coordinate (σ2006 + 2004 = [0.026, 0.021]) and is not statistically significant. Thus, ACS astrometry is consistent with Fomalhaut b being in a ring-nested orbit and near apsidal alignment. However, uncertainties in the astrometry and disk fitting and the small number of data points do not yet rule out a ring-crossing orbit or a misaligned orbit that crosses the ring only in projection.10
4. DISCUSSION
Kalas et al. (2008) argue that scattered starlight in a circumplanetary ring system contributes significantly to the F606W emission and planet thermal radiation dominates the F814W emission. They find the 0.6 μm emission variable by 0.7–0.8 mag, explainable by accretion-driven Hα emission, not dust emission. In contrast, Janson et al. (2012) argue that planet thermal emission cannot measurably contribute to the 0.6–0.8 μm emission else Fomalhaut b (if a planet) should have been detected at 4.5 μm. Based on the IR non-detections, the large implied space velocity from the ACS data, the F606W variability, and the difficulty in a circumplanetary ring scattering enough starlight, Janson et al. instead argue that Fomalhaut b is a (semi-)transient dust cloud physically unassociated with any planet.
We recover Kalas et al.'s detections at F606W and F814W and add an F435W detection, confirming that Fomalhaut b is a real object orbiting the primary. We cannot confirm that Fomalhaut b's F606W emission is variable at a level larger than our combined photometric errors (≈0.15 mag), let alone by 0.7–0.8 mag, and thus do not find any evidence for accretion-driven emission or for a semi-transient dust cloud.
Based on the IRAC and (to a lesser extent) J-band upper limits, we agree that Fomalhaut b's optical emission contains no measurable contribution from a planetary photosphere. Thus, in the strictest sense of the word, Fomalhaut b is not yet a directly imaged planet. However, a 0.5 MJ planet—favored by Chiang et al.'s simulations (see also Quillen et al. 2006)—is too faint to be detectable in any existing IR data set. Thus, the IR non-detections provide no compelling evidence against Fomalhaut b being the planet sculpting Fomalhaut's debris ring.
Fomalhaut b's ACS positions appear to be consistent with those expected for a ring-nested orbit. Moreover, Fomalhaut b's implied space motion is significantly slower and much more consistent with that expected for an apsidally aligned object. Our astrometry then weakens the other argument in Janson et al. (2012) against Fomalhaut b being a planet sculpting the debris ring.
Finally, Fomalhaut b is unlikely to be an unbound dust cloud since such a cloud would shear out into a resolvable clump on very short timescales and eventually into a circumstellar ring (see also Kuchner & Stark 2010). Alternatively, a dust cloud gravitationally bound to a planet can in principle explain the optical SED and persist for much longer timescales. Though dust confined to an optically thick circumplanetary ring (Kalas et al. 2008) may not scatter enough starlight (Janson et al. 2012), a spherical cloud of circumplanetary dust originating from ongoing planetesimal collisions (Kennedy & Wyatt 2011) is still plausible.
Fomalhaut b is a rare, possibly unique object in the primary's circumstellar environment. Although the emission identifying it originates from dust, not a planet atmosphere, it just happens to be where a massive planet should be in order to sculpt the debris ring. If a planet, it is (as yet) an indirect detection, but this is a feature shared by the protoplanet LkCa 15 b (Kraus & Ireland 2012) and radial-velocity/transit/microlensing-detected planets. Thus, Fomalhaut b is very plausibly (even "likely") "a planet identified from direct imaging" even if images of it, strictly speaking, do not show thermal emission from a directly imaged planet.
We thank Ray Jayawardhana, Paul Kalas, Mark Wyatt, Christian Thalmann, David Golimowski, Glenn Schneider, and the anonymous referee for valuable comments. The STScI help desk staff graciously answered detailed queries regarding the HST/ACS data products and flux calibration.
Footnotes
- 10
Kalas (2010) reported preliminary results indicating that Fomalhaut b is at an implausibly wide separation in the 2010 STIS data given their ACS astrometry. Janson et al. (2012) interpret this as evidence that Fomalhaut b is in a ring-crossing orbit. While a detailed analysis of the Fomalhaut STIS data is beyond the scope of this paper, our preliminary examination does not cast clear doubt on our results. We recover Fomalhaut b (mSTIS, 606W ≈ 24.8 ± 0.2). Fomalhaut b's position is significantly less discrepant compared to the disk (≈0
1–015 ± 01) if we adopt the ACS ellipse parameters. Any uncorrected image distortion, clearly flagged as a problem by Kalas, will bias image registration by yielding erroneous determinations for where the diffraction spikes intersect (e.g., the stellar centroid). STIS astrometry of Fomalhaut b obtained at multiple epochs will better clarify its orbit (P. Kalas et al. 2012, in preparation).