


ABSTRACT
We present evidence for a Galactic North–South asymmetry in the number density and bulk velocity of solar neighborhood stars. The number density profile, which is derived from main-sequence stars in the Sloan Digital Sky Survey, shows a (North−South)/(North+South) deficit at |z| ≃ 400 pc and an excess at |z| ∼ 800 pc. The bulk velocity profile, which is derived from the Sloan Extension for Galactic Understanding and Exploration, shows a gradual trend across the Galactic midplane as well as smaller-scale features. We speculate that the North–South asymmetry, which has the appearance of a wavelike perturbation, is intrinsic to the disk. We explore the physics of this phenomenon through an analysis of the linearized Boltzmann and Poisson equations and through one-dimensional simulations. The perturbation may be excited by the passage of a satellite galaxy or dark matter subhalo through the Galactic disk, in which case we are witnessing a recent disk-heating event.
Export citation and abstract BibTeX RIS
1. INTRODUCTION
Disk galaxies are dynamic systems that can develop bars, spiral structure, and warps. They tidally disrupt satellite galaxies and dark matter subhalos, a process that leaves behind streams of stars and dark matter. Likewise, satellites continually perturb the disk of their host galaxy.
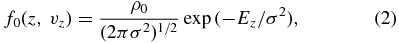
Despite the existence of these time-dependent phenomena, the assumption that galaxies are in equilibrium (i.e., stationary in the potential) has been used extensively to interpret certain types of observations. Best known, perhaps, are attempts to infer the surface density and vertical force near the Sun from the kinematics of stars in the solar neighborhood. Oort (1932) pioneered this program and elements of his original method are present in virtually all studies of this type. Approaches to the so-called Oort problem generally involve an estimate of the distribution function for solar neighborhood stars, f(z, vz), where z is the position relative to the midplane of the Galaxy and vz is the vertical velocity. For stars in equilibrium, and not too far above the midplane, this distribution is a function of the effective vertical energy per unit mass, Ez = v2z/2 + Ψ(z), where Ψ(z) is the gravitational potential in the solar neighborhood. Numerous researchers including Bahcall (1984), Kuijken & Gilmore (1989a, 1989b), Flynn & Fuchs (1994), and Holmberg & Flynn (2000) have extended and improved upon Oort's method.
In this Letter, we estimate the number density of stars with both photometric and astrometric observations from SDSS-DR8, the Eighth Data Release of the Sloan Digital Sky Survey (Aihara et al. 2011). We also use a smaller spectroscopic data set from SEGUE, the Sloan Extension for Galactic Understanding and Exploration (Yanny et al. 2009), to estimate the bulk velocity and velocity dispersion. While our motivating interest was in revisiting the Oort problem, our aim in this Letter is to demonstrate the existence of a North–South asymmetry in both the spatial density and velocity distribution of solar neighborhood stars. We explore the hypothesis that the asymmetry reflects a coherent wavelike perturbation, which is intrinsic to the disk. A theoretical discussion, together with a simple one-dimensional simulation, reveals that perturbations of this type are entirely natural.
2. OBSERVATIONS
We begin with a discussion of the photometric data set. Since our primary interest is in differences in the stellar distribution North and South of the Galactic midplane, we choose matched regions from the survey above and below the Sun. Specifically, we select stars with Galactic coordinates 100° < l < 160° and 54° < |b| < 68° that reside within a perpendicular distance of 1 kpc from the line connecting the North and South Galactic poles. We determine dereddened apparent magnitudes in g, r, and i using the extinction maps of Schlegel et al. (1998). In doing so, we assume that all of the stars are beyond the dust, which is thought to lie at |z| < 125 pc (Marshall et al. 2006). Only stars with 14 < r < 21 are included in order to avoid problems with saturation and photometric errors. We calculate absolute r-band magnitudes, Mr, using r − i colors and the photometric parallax relation from Jurić et al. (2008) as well as g − i colors and the corresponding relation from Ivezić et al. (2008a). The selection function, which depends on the geometry of the survey and our brightness cuts, is used to convert the observed number of stars to stellar number density with height. A detailed discussion of the selection function and various systematic effects will be discussed in a forthcoming publication.
In Figure 1, we plot the number density n(zobs), where zobs ≡ z − z☉ and z☉ is the vertical position of the Sun. We consider stars with 0.6 < r − i < 1.1 and compute distances using the photometric parallax relation from Jurić et al. (2008). In this r − i range, we observe all stars (approximately 300 K) with 0.2 kpc ≲ |zobs| ≲ 1.6 kpc. The density profile shows the well-documented excess over a single exponential for |z| ≳ 1 kpc (Gilmore & Reid 1983; Reid & Majewski 1993; Jurić et al. 2008). We fit a two-component model
using χ2-minimization (Press et al. 1992) and find n0 = (4.22 ± 0.04) × 106 kpc−3, H1 = (221 ± 3) pc, H2 = (582 ± 12)pc, f = 0.17 ± 0.01, and z☉ = (15.4 ± 0.8) pc. The residuals Δ ≡ (data − model)/model are largely an odd function in z. In the North, the data lie below the model for z ≃ 400 pc and above the model for z ∼ 800 pc while the situation is reversed in the South. We note that while Equation (1) captures the general features of the measured n(zobs), the fit is relatively poor with χ2 ≃ 444 for 47 degrees of freedom. We strongly rule out a symmetric disk model, even when we assume some correlation of errors in adjacent color bins that might arise from the conversion of colors to distances via the photometric parallax relation.
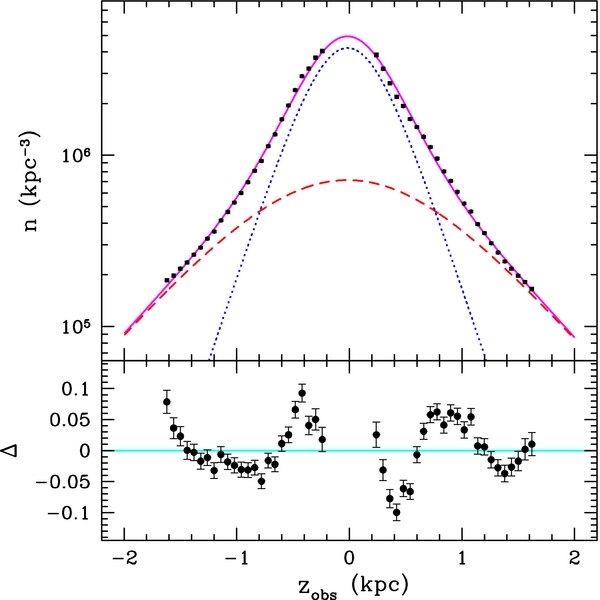
Figure 1. Number density n as a function of distance from the Sun zobs. Black points are the data. The magenta curve is our model fit. The dotted blue curve is the contribution from the thin disk; the dashed magenta curve is the contribution from the thick disk. Lower panel shows residuals: Δ ≡ (data−model)/model.
Download figure:
Standard image High-resolution imageA consequence of the z-odd residuals is that the model parameters are sensitive to the range in z considered. In particular, if we fit only data within 500 pc, we find z☉ ≃ 39 pc. Thus, our two determinations of z☉ bracket the typical values found in the literature (Jurić et al. 2008).
To explore the density structure further, we consider the North–South asymmetry, defined as A(z > 0) ≡ (n(z) − n(− z))/(n(z) + n(− z)). In Figure 2 (top panel), we show A for a series of color bins from r − i = 0.4 to r − i = 1.4. In constructing this figure, we use z☉ = 15 pc. Note that the probed range in z depends on color; regions close to the midplane are probed by the redder bins and vice versa. Evidently, A shows little color dependence. In Figure 2 (middle panel), we show A for the r − i window used in Figure 1. Also shown is the asymmetry obtained if distances for these stars are computed using the g − i photometric parallax relation. In Figure 2 (bottom panel), we compute the composite asymmetry over all color bands in Figure 2 (top panel) as well as the composite asymmetry found for stars with 1.6 < g − i < 2.6. We also show the asymmetry when we assume z☉ = 39 pc.
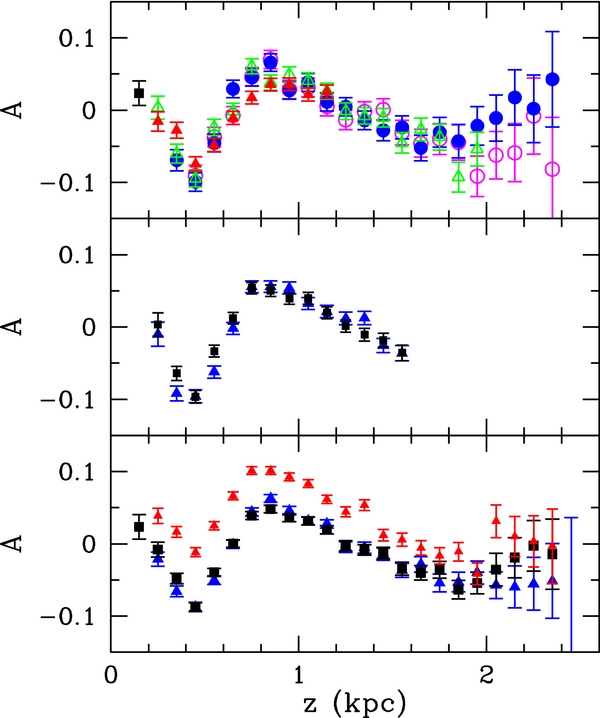
Figure 2. North–South asymmetry parameter A as a function of z. Top panel shows A(z) for 0.2 mag color bins: black square: r − i = {1.2–1.4}; red filled triangle: r − i = {1–1.2}; green open triangle: r − i = {0.8–1}; blue filled circle: r − i = {0.6–0.8}; magenta open circle: r − i = {0.4–0.6}. Middle panel gives the average A for the color bins and z-range used in Figure 1. Black squares were generated using the photometric parallax relation from Ivezić et al. (2008a). Bottom panel gives the average A over the full range in z and colors. Red triangles assume z☉ = 39 pc instead of z☉ = 15 pc.
Download figure:
Standard image High-resolution imageThe statistical significance of the North–South asymmetry may be tested using the Kolmogorov–Smirnov (K-S) test where the statistic D is defined as the maximum difference between fractional cumulative distributions of stars North and South of the Galactic midplane. We carried out a K-S test for subsamples with different numbers of stars N and found that D ≃ 0.035–0.055 for N > 9000. The probability that the stars North and South of the midplane are drawn from the same distribution is P ≃ exp (− D2N) (Press et al. 1992). Thus, with only a few percent of the full data set we rule out the null hypothesis (North–South symmetric distribution) at the 10−5 level. For the full data set, P is vanishingly small.
In Figure 3 we show the two-dimensional asymmetry, A2D(R, z), where R is the Galactocentric radius. This figure may be compared with Figure 26 from Jurić et al. (2008), who also studied SDSS stars. The asymmetry described in this Letter appears to be evident in the bottom right panel of their figure.

Figure 3. North–South asymmetry A2D as a function of z and the Galactocentric distance R. We assume 8 kpc for the Sun–Galactocenter distance.
Download figure:
Standard image High-resolution imageWe now consider the spectroscopic sample, which comprises some 11,000 SEGUE stars. The (l, b)-footprint for this sample is slightly larger than the footprint for the photometric sample, though the (l, b) coverage is not uniform (Yanny et al. 2009). We include stars with 1.0 < g − i < 1.9 that satisfy the stellar surface gravity cut from Lee et al. (2008), which restricts our sample to dwarfs. Proper motions6 and radial velocities are converted to a (vx, vy, vz) coordinate system using the standard transformation laws (Johnson & Soderblom 1987). Errors in vz are typically 6–11 km s−1 and result from uncertainties in proper motions, radial velocities, and distances. We consider stars with |vz| < 125 km s−1 so as to avoid contamination from high-velocity outliers. In Figure 4 (top panel) we see a trend in 〈vz〉 across the midplane as well as small-scale undulations. These results suggest that there is a coherent motion of solar neighborhood stars away from the Galactic midplane. We note that recently Bochanski et al. (2011) found evidence for variations in 〈vz〉 with M-star color, which is correlated with z. Figure 4 (bottom panel) shows an increase in σz with |z|, which may be attributed to an increase in the fraction of kinematically "hotter" thick disk stars as one moves away from the midplane.
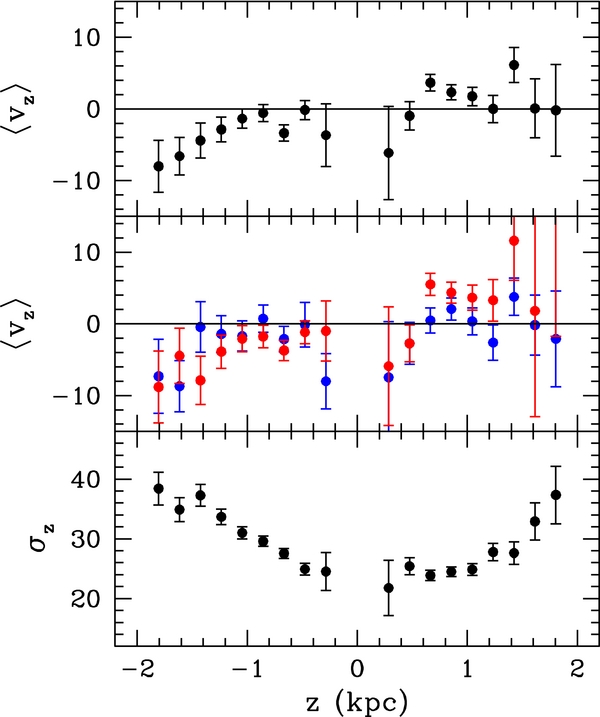
Figure 4. Bulk velocity 〈vz〉 and velocity dispersion σz as a function of z in units of km s−1. Top panel shows the bulk velocity as a function of z for the entire spectroscopic sample. Middle panel shows the bulk velocity profile for the "red" subsample (g − r > 1) and "blue" subsample (g − r < 1). The peculiar motion of the Sun (vz, ☉ = 7.2 km s−1; Dehnen & Binney 1998) has been subtracted from 〈vz〉. Bottom panel shows the velocity dispersion.
Download figure:
Standard image High-resolution imageVarious systematic effects can produce trends in 〈vz〉. Bond et al. (2010) analyzed SDSS-DR7 data and reported a difference of ∼8 km s−1 between the bulk motions North and South of the midplane; they attributed this difference to a systematic radial velocity error for M dwarfs possibly due to the limited set of velocity template spectra used in the SDSS cross-correlation. To explore this issue, we consider red and blue subsamples. The results, shown in Figure 4 (middle panel), do indeed indicate a stronger trend in the red subsample, though a trend and small-scale features are still evident in the blue subsample. Another example is a systematic offset in distances, which would enter 〈vz〉 through the proper motions, especially at mid-Galactic latitudes (Schönrich et al. 2012), though a large offset (∼30%) is required to explain the trend seen in Figure 4 (top panel) in toto. Clearly, a definitive statement on the z-dependence of 〈vz〉 will require improvements in radial velocity and distance measurements along with better coverage toward the Galactic poles.
A primary goal of the SDSS and SEGUE projects is to discover new structure in the Galaxy's stellar halo. Jurić et al. (2008), for example, detected several new overdensities in the thick disk and stellar halo. These features are usually interpreted as stellar debris from a tidally disrupted satellite. While it is tempting to seek a similar explanation for the features described in this Letter we explore a different interpretation: the structures seen in both the photometric and spectroscopic data represent coherent wavelike perturbations in the Galactic disk.
Evidence for this interpretation can be found in the preceding figures. The model residuals (Figure 1) and North–South asymmetry (Figure 2) extend above and below the Galactic midplane and exhibit a wavelike structure. Furthermore, the structures appear to run parallel to the Galactic midplane, as seen in Figure 3. In addition, the bulk velocity exhibits a trend running through the midplane and smaller-scale fluctuations. Finally, and perhaps most importantly, the asymmetry appears to be largely independent of color (Figure 2 (top panel)). A strong color dependence would have suggested that the asymmetry was due to different stellar populations North and South of the midplane. Indeed, Schlafly et al. (2010) note that F turn-off stars in the South appear to be systematically redder in g − r by 0.02 mags than in the North. However, these stars are typically located 5–10 kpc from the Galactic plane, and therefore well beyond the extent of the thin or thick disk stars studied here.
3. THEORETICAL CONSIDERATIONS
We now demonstrate that these features naturally arise in a perturbed self-gravitating stellar disk. For simplicity, we ignore interstellar matter and model the Galactic disk in the solar neighborhood as a collisionless system of stars. We further assume that the disk is self-gravitating, though it is easy to include additional components to the gravitational field. Finally, since we work close to the Galactic plane, we assume that we can decouple vertical motions of disk stars from radial and azimuthal motions.
We consider small perturbations to the equilibrium solution for a single-component, self-gravitating, isothermal plane. The distribution function, density, and potential for the equilibrium solution are
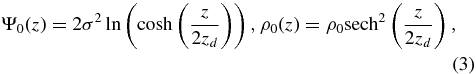
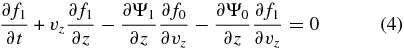
where ρ0 = σ2/8πGz2d ((Spitzer 1942), see, also Binney & Tremaine (2008), problem 4.21). The linearized Boltzmann and Poisson equations are
and
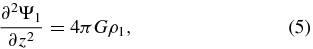
where ρ1(z, t) = ∫dvzf1(z, vz, t). Equation (5) implies that the vertical force perturbation, F1 ≡ −∂Ψ1/∂z, is proportional to the perturbed surface density, as defined from the Galactic midplane, i.e., F1(z) = 4πG(Σ1(z) − Σ1(0)), where Σ1(z) ≡ ∫z− ∞dz ρ1(z). Moreover, we can integrate Equation (4) over vz to obtain the linearized continuity equation
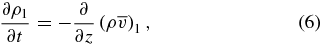
where  . The mean velocity is therefore related to the surface density and vertical force:

which implies a connection between the vertical perturbations considered here and the Oort problem.
Equations (4) and (5) do not admit simple plane wave solutions since the unperturbed model depends on z. Nevertheless, the standard Jeans stability analysis suggests that waves are described by the dispersion relation
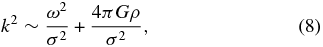
where k and ω are the wavenumber and angular frequency, respectively. A lower bound on the Jeans length, the minimum length scale for gravitationally unstable modes, is obtained by setting ω = 0 and ρ and σ equal to values characteristic of the Galactic midplane. We find λJ = 2π/kJ = (πσ2/Gρ)1/2 ≃ 2 kpc. Since λJ is much larger than the characteristic scale height of the disk, we conclude that vertical perturbations are stable and behave like pressure-supported waves. Equation (8), together with the fact that ρ/σ2 decreases with |z| implies that the wavelength for these perturbations will be somewhat less than λJ and will increase as one moves away from the midplane. These conclusions are consistent with the asymmetry shown in Figure 2.
Since the equilibrium distribution function is even in both z and vz, the characteristic modes of the perturbed system have definite parity in both phase space coordinates. Any perturbation can be modeled by displacing stars in position and velocity, that is, by replacing the unperturbed phase space positions, z0 and v0 with z = z0 + z1(z0) and vz = v0 + v1(z0). For the simplest perturbation, all stars are displaced in the same direction. We refer to this type of perturbation as an m = 0 mode since there are no nodes in the displacement functions z1 and v1. The m = 0 mode amounts to a local displacement of the stellar disk as a whole and affects any determination of z☉ and vz, ☉ from solar neighborhood data. (For observational evidence of m = 0 modes or midplane displacement in the molecular gas distribution of the Galaxy, see Nakanishi & Sofue (2006).)
The next simplest perturbation is an m = 1 (breathing) mode where displacements and peculiar velocities have opposite signs above and below the midplane. However, the density perturbation is an even function in z and therefore n(z) alone cannot reveal the presence of an m = 1 perturbation. However, the m = 1 mode would show up as a North–South trend in the bulk velocity, which is consistent with what we see in Figure 4.
The North–South asymmetry seen in Figure 2 is then likely a combination of m = 2, 4, ... modes. The local extrema in A at 400 and 800 pc (and possibly 1200 pc) imply nodes in z1 at the corresponding positions in z. These higher order modes may also be present in the velocity data.
We have numerically solved for the evolution of a one-dimensional collisionless N-body system where each "particle" corresponds to an infinite plane, which moves under the influence of the gravitational field generated by the other planes. The gravitational force on a given plane is proportional to the difference between the number of planes to the North and the number to the South. (Similar simulations were performed by Sánchez-Salcedo et al. (2011) in order to study vertical equilibrium solutions of galactic disks.)
We chose an equilibrium model given by Equations (2) and (3) with σ = 31 km s−1 and zd = 500 pc. These parameters imply a surface density at 1.1 kpc of 71 M☉ pc−2, which is the value obtained by Kuijken & Gilmore (1989a). The initial perturbation is chosen to roughly match the results found in Figures 1 and 4. The evolution of the system is shown in Figure 5.7 The simulations illustrate the interplay between density and velocity perturbations. Waves appear to reflect off the low-density regions at high-z, a phenomenon reminiscent of waves propagating in the Sun, and decay over a period of 200–300 Myr.

Figure 5. Density, bulk velocity, and vertical force as a function of z for the initial conditions and for three time frames from the one-dimensional simulation described in the text. Top panel shows Δ = (ρ(z) − ρ0)/ρ0, where ρ0 is the unperturbed density. Middle panel shows the bulk velocity. Bottom panel shows the difference between the vertical force for the perturbed and unperturbed disk. Blue points represent results from our analysis of the SDSS and SEGUE data.
Download figure:
Standard image High-resolution image
4. CONCLUSIONS
Finally, we speculate on the origin of vertical perturbations in galactic disks. An isolated, self-gravitating disk can develop non-axisymmetric structure, such as spiral arms and bars, through gravitational instabilities (see Binney & Tremaine 2008; Sellwood 2010). On the other hand, the vertical modes are stable and must be excited by some agent. Of course, stellar disks of even relatively isolated galaxies, such as the Milky Way, interact with satellite galaxies and, presumably, halo substructure. There is an extensive body of literature on disk heating, dating back to the work of Lacey & Ostriker (1985), who considered disk heating by supermassive black holes, and Velazquez & White (1999), who considered disk heating by satellite galaxies. In addition, Gauthier et al. (2006) and Dubinski et al. (2008) showed that satellites and halo substructure can provoke spiral-type structures in a stellar disk and trigger bar formation. More recently, Purcell et al. (2011) proposed that the Sagittarius dwarf galaxy was responsible for setting up the particular pattern of spiral structure seen in the Milky Way. Our conjecture is that the vertical waves are another manifestation of disk-heating and disk-substructure interactions.
The observational, theoretical, and numerical analyses presented in this Letter can be extended to incorporate variations in the disk plane and provide a more complete picture of the perturbed disk. On the observational front, future experiments, such as Gaia (Perryman et al. 2001; Wilkinson et al. 2005) and LSST (Ivezić et al. 2008b), which aim to measure distances and velocities for some one billion stars, will provide a picture of the phase space distribution of the Galaxy in unprecedented detail. These studies may well reveal a rich structure of waves in the disk, and thereby open a new window into the dynamics of the Galaxy.
We thank Nathan Deg, Evalyn Gates, Kristine Spekkens, John Dubinski, Ralph Schönrich, and John Bochanski for useful conversations and the Aspen Center of Physics for its hospitality. We acknowledge use of SDSS-III data (http://www.sdss3.org). L.M.W. is supported by the Natural Sciences and Engineering Research Council of Canada. S.D. is supported by the U.S. Department of Energy, including grant DE-FG02-95ER40896, and by the National Science Foundation under grant AST-090872. S.G. acknowledges partial support from the U.S. Department of Energy under contract DE-FG02-96ER40989.
Footnotes
- 6
Early SDSS DR8 proper motions were corrected for a small astrometry systematic. Our results are not significantly affected by this change.
- 7
See http://www.astro.queensu.ca/~widrow/OortExplorers.html for an animation of the simulation.