Abstract
Nitrogen-vacancy (NV) centers in diamond have attracted significant interest because of their excellent spin and optical characteristics for quantum information and metrology. To exploit these characteristics, precise control of the orientation of the NV axis in the lattice is essential. Here we show that the orientation of more than 99% of the NV centers can be aligned along the [111] axis by chemical vapor deposition homoepitaxial growth on (111) substrates. We also discuss the alignment mechanisms. Our result enables a fourfold improvement in the magnetic field sensitivity and opens new avenues to the optimum design of NV center devices.
Export citation and abstract BibTeX RIS
One of the most intensively studied atom-like solid-state systems is the nitrogen-vacancy (NV) center in diamond. It is composed of a substitutional nitrogen (N) and a vacancy (V) on adjacent lattice sites in diamond (Fig. 1). It has attracted significant interest because of its excellent spin and optical characteristics for quantum information processing, communication, sensing, and metrology.1–6)

Fig. 1. Four possible orientations of NV centers in diamond. Green and brown arrows indicate orientations of NV axes in a magnetic field. The angle between them is represented by θNV-B.
Download figure:
Standard image High-resolution imageIn the diamond crystal structure, the orientations of the NV centers are classified according to their alignment along one of four possible crystallographic axes: [111], [ ], [
], [ ], or [
 ] (Fig. 1). In most diamond samples, the NV centers occupy these four orientations equally. It was recently shown that in synthetic diamond grown via chemical vapor deposition (CVD) on (110) substrates, the NV centers can be incorporated into the lattice and are found in only two of the four orientations.7) Furthermore, this 50% preferential NV orientation can be realized in CVD diamond samples grown on (100) substrates.8) In this sample with NVs oriented only along two axes, twofold improvements in the readout contrast R and magnetic field sensitivity η were demonstrated when compared with those of standard samples with equal population of all the NV orientations.8) This is consistent with the relationship of the shot-noise limited sensitivity, η ∝ 1/R.6,8) It also indicates that a fourfold improvement in η can be expected if the orientation is aligned along only one axis.
However, such perfect alignment has not yet been realized. Control of the orientation of the NV axis is very important for not only sensing but also quantum information applications because the spin and optical characteristics strongly depend on this orientation. When photoluminescence (PL) is detected from the [111] direction, the PL intensity from NV centers in which the NV axis is parallel to [111] (NV ∥ [111]) is higher than that from the others because electric dipole transitions are allowed for dipoles in the plane perpendicular to the NV axis.9) Furthermore, because growth occurs on a (111) face, the magnetic field can be directly aligned perpendicular to the surface, which is the easiest configuration from a practical point of view. With respect to the spin, the electron spin of a negatively charged NV (NV−) is expected to play a key role at the quantum interface with photons1) and superconducting flux qubits.2) Coupling with nearby NV−'s is also expected to be a quantum register resource.3) Future applications of these systems will require precise control of not only the position but also the orientation of the NV axis.
We investigated five samples (Table I). The conditions used for diamond growth or NV center creation differed among them. The diamond films of samples A, B, and D were epitaxially deposited on high-pressure and high-temperature (HPHT) synthetic Ib diamond (111) substrates (2 × 2 × 0.5 mm3 for A and B and 1 × 1 × 0.3 mm3 for D). These samples were grown in a microwave-plasma-enhanced CVD reactor (ASTeX) using 1% CH4 diluted with H2 for cases A and B and in a reactor (Arios, spherical resonant cavity type)10) using 0.25% CH4 diluted with H2 for D. The gas pressure, total gas flow rate, and microwave power were 150 Torr, 1,000 cm3/min, and 3,500 W, respectively, for A; 130 Torr, 990 cm3/min, and 3,700 W, respectively, for B; and 20 kPa, 100 cm3/min, and 400 W, respectively, for D. For B, O2 was added (0.5 cm3/min) to suppress the incorporation of impurities.11) The substrate temperature was maintained at 850, 1,100, and 900 °C for A, B, and D, respectively. The film thicknesses of A, B, and D were approximately 11, 8, and 18 µm, respectively. N was unintentionally incorporated during the growth of A, B, and D. Because no NV centers were observed in B and C, 15N was ion implanted into these samples [IIa HPHT (111) substrate, 2 × 2 × 0.5 mm3] at a dose of 1 × 10⁹/cm2 and an acceleration energy of 30 keV at 600 °C. In sample E, electrons were irradiated at 0.5 MeV and a density of 1.5 × 10¹⁶/cm2 to HPHT Ib(111) diamond. Samples B, C, and E were annealed at 1,000 °C under an Ar atmosphere for 2 h and subsequently cleaned with H2SO4 and HNO3 solutions at 200 °C for 30 min.
Table I. Ratio of N–V axes aligned along [111] in each sample.
| Sample | Synthesis | Incorporation of NV | Measured NV | NV ∥ [111] (%) | Thickness of CVD film (µm) |
|---|---|---|---|---|---|
| A | CVD growth on Ib(111) substrate by ASTeX reactor | Grow-in | Single | >99 | 10 |
| B | CVD growth on Ib(111) substrate by ASTeX reactor | 15N ion-implantation (Intentional addition of O2) | Single | 42 | 8 |
| C | IIa HPHT | 15N ion-implantation to (111) surface | Single | 35 | — |
| D | CVD growth on Ib(111) substrate by Arios reactor | Grow-in | Ensemble | >99 | 24 |
| E | Ib HPHT | e-irradiation to (111) surface | Ensemble | 43 | — |
The orientation of the NV axis was investigated by optically detected magnetic resonance (ODMR) using a confocal microscope at room temperature. The electron ground state of an NV− is a spin triplet. Upon optical excitation, NV−'s exhibit strong fluorescence. The fluorescence intensity of NV−'s is spin dependent owing to spin-selective relaxation via a singlet state, which allows optical readout of the single-electron spin resonances of the |MS〉 = |0〉  |−1〉 and |MS〉 = |0〉
  |1〉 transitions. Microwave fields are used for coherent manipulation of a single-electron spin. An external magnetic field was applied by a permanent magnet.
To quantitatively characterize the electron spin states, the ODMR spectra were simulated by exact diagonalization of the spin Hamiltonian.

where the electron spin S = 1 is considered, and βe is the Bohr magneton. Reported values for the zero-field splitting parameter (D = 2.87 GHz) and the isotropic electron Zeeman g-value (ge = 2.0028) were used.12) The ODMR spectrum of NV−'s can be explained mainly by Zeeman splitting ( ) and zero-field splitting (
 ) if hyperfine splitting can be neglected.13) We assume that the zero-field splitting parameter of E is zero because the symmetry of NV−'s belongs to the C3v point group.13) Under this condition and a constant magnetic field strength, the ODMR frequency is simply determined by the angle between the directions of the NV axis and the magnetic field (θNV-B, Fig. 1).13) As shown in Fig. 1, four θNV-B angles are possible depending on the four orientations of the NV axis under an arbitrary magnetic field orientation, which produces four ODMR frequencies.
A scanning confocal microscope image of sample A is shown in Fig. 2(a). Bright spots are single NV−'s, which were confirmed by the PL spectrum [Fig. 2(e)] and anti-bunching measurements. The ODMR spectrum of a single NV− in sample A is shown in Fig. 2(b). The magnetic field was applied along the [111] axis (B ∥ [111]) with a magnitude of 5.5 mT. The |MS〉 = |0〉  |−1〉 and |MS〉 = |0〉
  |1〉 transitions were observed at low and high frequencies, respectively. The difference in their ODMR intensities is attributed to the impedance mismatching of a Cu wire for irradiation by a microwave field. A simulated spectrum of a single NV− when the magnetic field is parallel to the NV axis (θNV-B = 0°) is shown in Fig. 2(c); the simulated spectrum reproduced the experimental results well. The simulated spectrum of a single NV− for θNV-B = 109.47° is shown in Fig. 2(d). This corresponds to the situation where B ∥ [111] and
 ![$\text{NV}\parallel [1\bar{1}\bar{1}],\ [\bar{1}1\bar{1}],\ [\bar{1}\bar{1}1]$](https://content.cld.iop.org/journals/1882-0786/7/5/055201/revision1/AP140151if014.gif) . In this case, the ODMR frequencies of NV−'s for
. In this case, the ODMR frequencies of NV−'s for ![$\text{NV}\parallel [1\bar{1}\bar{1}],\ [\bar{1}1\bar{1}],\ [\bar{1}\bar{1}1]$](https://content.cld.iop.org/journals/1882-0786/7/5/055201/revision1/AP140151if015.gif) correspond to each other because of the C3v symmetry; however, these frequencies differ from those of NV ∥ [111], as shown in Figs. 2(c) and 2(d). Therefore, we can clearly identify the orientation of the NV axis from the ODMR spectrum. In total, we investigated 100 randomly chosen single NV−'s in sample A and found that all of the NV axes were oriented parallel to the [111] axis. On the basis of these results, the orientations of more than 99% of the NV axes were aligned along the [111] axis in sample A. In samples B and C, 100 and 50 randomly chosen single NV− centers, respectively, were measured. The results indicate that about 43 and 35% of the NV−'s exhibited NV ∥ [111] alignment in samples B and C, respectively, as summarized in Table I. Note that we cannot distinguish NV ∥ [111] from
correspond to each other because of the C3v symmetry; however, these frequencies differ from those of NV ∥ [111], as shown in Figs. 2(c) and 2(d). Therefore, we can clearly identify the orientation of the NV axis from the ODMR spectrum. In total, we investigated 100 randomly chosen single NV−'s in sample A and found that all of the NV axes were oriented parallel to the [111] axis. On the basis of these results, the orientations of more than 99% of the NV axes were aligned along the [111] axis in sample A. In samples B and C, 100 and 50 randomly chosen single NV− centers, respectively, were measured. The results indicate that about 43 and 35% of the NV−'s exhibited NV ∥ [111] alignment in samples B and C, respectively, as summarized in Table I. Note that we cannot distinguish NV ∥ [111] from ![$\text{NV}\parallel [\bar{1}\bar{1}\bar{1}]$](https://content.cld.iop.org/journals/1882-0786/7/5/055201/revision1/AP140151if017.gif) in our experiment.
in our experiment.

Fig. 2. (a) Scanning confocal microscope image of sample A. The excitation wavelength was 532 nm, and the laser power was 200 µW. The bright spots are single NV−'s, which were confirmed by PL and anti-bunching measurements. (b) ODMR spectrum of single NV in sample A. The magnetic field was applied along the [111] axis (B ∥ [111]). The |MS〉 = |0〉  |−1〉 and |MS〉 = |0〉
  |1〉 transitions are observed at low and high frequencies, respectively. (c) Simulated spectrum of single NV for B ∥ NV (θNV-B = 0°). (d) Simulated spectrum of single NV for θNV-B = 109.47°. This corresponds to the situation where B ∥ [111] and
 ![$\text{NV}\parallel [1\bar{1}\bar{1}],\ [\bar{1}1\bar{1}],\ [\bar{1}\bar{1}1]$](https://content.cld.iop.org/journals/1882-0786/7/5/055201/revision1/AP140151if011.gif) . (e) PL spectrum of single NV−. The excitation wavelength was 532 nm, and the laser power was 100 µW.
. (e) PL spectrum of single NV−. The excitation wavelength was 532 nm, and the laser power was 100 µW.
Download figure:
Standard image High-resolution imageThe NV− concentration in sample D is higher than that in sample A; we measured NV− ensembles. The difference in the NV densities between samples A, B, and D is attributed to the difference in background pressure in the reactor, which was (1–2) × 10−8 Torr for samples A and B and 10−6 Torr for sample D. In addition, O2 was added for sample B. Notably, both samples A and B were synthesized under high-quality synthesis conditions that favored lateral growth.14) On the basis of the approximately tenfold greater PL intensity of NV−'s compared with that of a single NV−, we surmised that the ODMR spectrum of sample D in Fig. 3(a) consists of the signals of approximately 10 NV−'s. For reference, the ODMR spectrum of sample E (red) under the same direction of magnetic field as in Fig. 3(a) (almost B ∥ [111]) and its simulated spectrum (blue) are shown in Fig. 3(b). These consist of NV ∥ [111] and ![$\text{NV}\parallel [1\bar{1}\bar{1}],\ [\bar{1}1\bar{1}],\ [\bar{1}\bar{1}1]$](https://content.cld.iop.org/journals/1882-0786/7/5/055201/revision1/AP140151if021.gif) signals. In the simulation, we tilted the direction of the magnetic field slightly to reproduce the experimental results well because the direction of the magnetic field deviated slightly from the [111] axis in our measurements. The definitions of the angles θB and ϕB are shown in Fig. 3(d). The parameters used in the simulation of the spectrum in Fig. 3(b) were a magnetic field of 5.05 mT, θB = 3°, and ϕB = 6°. A comparison of the spectra in Figs. 3(a) and 3(b) reveals that all of the NVs in sample D exhibit an NV ∥ [111] orientation. We investigated more than 10 randomly chosen locations and confirmed that all of the NVs exhibit an NV ∥ [111] orientation. On the basis of this result and the simultaneous measurement of approximately 10 NVs in our detection spot, we estimate that more than 99% of the NVs in sample D exhibit an NV ∥ [111] orientation.
signals. In the simulation, we tilted the direction of the magnetic field slightly to reproduce the experimental results well because the direction of the magnetic field deviated slightly from the [111] axis in our measurements. The definitions of the angles θB and ϕB are shown in Fig. 3(d). The parameters used in the simulation of the spectrum in Fig. 3(b) were a magnetic field of 5.05 mT, θB = 3°, and ϕB = 6°. A comparison of the spectra in Figs. 3(a) and 3(b) reveals that all of the NVs in sample D exhibit an NV ∥ [111] orientation. We investigated more than 10 randomly chosen locations and confirmed that all of the NVs exhibit an NV ∥ [111] orientation. On the basis of this result and the simultaneous measurement of approximately 10 NVs in our detection spot, we estimate that more than 99% of the NVs in sample D exhibit an NV ∥ [111] orientation.

Fig. 3. (a) ODMR spectrum of ensemble NV centers in sample D under almost B ∥ [111]. (b) ODMR spectrum of sample E at almost B ∥ [111] (red) and simulated spectrum (blue). This consists of the signals of NV ∥ [111] and ![$\text{NV}\parallel [1\bar{1}\bar{1}]$](https://content.cld.iop.org/journals/1882-0786/7/5/055201/revision1/AP140151if018.gif) , [
, [ ], [
], [ ]. The parameters were a magnetic field of 5.05 mT, θB = 3°, and ϕB = 6°. (c) ODMR spectrum of sample E with almost B ∥ [111] (red) and simulated spectrum (blue). The parameters were a magnetic field of 4.5 mT, θB = 103°, and ϕB = 4°. (d) Definitions of angles θB and ϕB.
Download figure:
Standard image High-resolution imageFigure 3(c) shows the ODMR spectrum of sample E under almost ![$\mathbf{B}\parallel [1\bar{1}\bar{1}]$](https://content.cld.iop.org/journals/1882-0786/7/5/055201/revision1/AP140151if022.gif) (red) and a simulated spectrum (blue). The spectra simulated for a ratio of about 43% NV ∥ [111] exhibited the best fit, as shown by the blue lines in Figs. 3(b) and 3(c). The parameters used to simulate the spectrum in Fig. 3(c) were a magnetic field of 4.5 mT, θB = 109.4°, and ϕB = 8°. In Figs. 3(a)–3(c), the signal intensities were normalized by their integrated values. In samples B, C, and E, the NV centers were slightly preferentially aligned with the [111] axis. We deduce that the reason is related to the fact that implantation and e-irradiation were performed from the direction of the [111] axis. As far as we know, results related to preferential alignment by ion implantation and e-irradiation have not yet been reported; elucidation of the mechanism and improvement of the ratios are very important in the next step.
(red) and a simulated spectrum (blue). The spectra simulated for a ratio of about 43% NV ∥ [111] exhibited the best fit, as shown by the blue lines in Figs. 3(b) and 3(c). The parameters used to simulate the spectrum in Fig. 3(c) were a magnetic field of 4.5 mT, θB = 109.4°, and ϕB = 8°. In Figs. 3(a)–3(c), the signal intensities were normalized by their integrated values. In samples B, C, and E, the NV centers were slightly preferentially aligned with the [111] axis. We deduce that the reason is related to the fact that implantation and e-irradiation were performed from the direction of the [111] axis. As far as we know, results related to preferential alignment by ion implantation and e-irradiation have not yet been reported; elucidation of the mechanism and improvement of the ratios are very important in the next step.
Next, we present a theoretical investigation of how the NV centers are aligned in the  direction when they are created. Recall that we are not discussing whether the NV centers are more likely to form than single substitutional N defects. The most probable scheme of NV formation seems stepwise, as Atumi et al.15) noted, where the nitrogen atom is incorporated first, and the vacancy is incorporated second. The N should be threefold coordinated together with the lone pair as the source of the vacancy. During CVD crystal growth, the C adatoms should "skip" the N lone pairs because they tend to stick to the C dangling bonds to gain as much energy per unit time as possible. Our first-principles energetics calculations16) showed that putting a CH3 unit on N as a substitute for the topmost C atom in a flat (111) terrace is large (3 eV) relative to the reference with CH3 on the topmost C itself.17) If this type of N atom is abundant, the NV centers should be [111]-oriented with additional crystal layers grown over.
However, one cannot exclude the formation of NV defects oriented with [ ], [
], [ ], and [
 ], depending on the formation energetics of N atoms in different environments from the topmost terrace sites. Therefore, to explain the experiment, it is necessary to find in the C(111) growth process the origin of the alignment that allows us to generate N atoms in the topmost C positions of the surface.
Lateral layer-by-layer growth is essential to high-quality CVD growth of diamond surfaces.18,19) Edmonds et al.7) discussed the origin of the NV alignment in either the [111] or [ ] direction for the (110) surface. They argue that, once an N atom is incorporated into the trough flow, the site adjacent to the N atom is very attractive for C addition because the chemisorbed atom would form two bonds with the surface, whereas the N atom adopts a threefold coordination.
A recent experiment on high-quality layer-by-layer growth of the (111) surface has demonstrated that the lateral growth results from "kink flow", where the kink [Fig. 4(a)] rapidly propagates along the step edge taking adatoms into it. If the kink runs from one apex of the island to the other, the step edge grows by a unit length in the step-down direction.20)
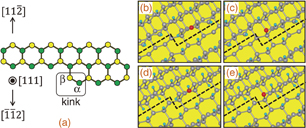
Fig. 4. (a) Schematic representation of kinked [ ]- and straight [
 ]-oriented steps on (111) diamond surface. We focus on the former in this paper. Green and yellow circles represent the atoms in two sublattices in one bi-layer. The former are the topmost C atoms, whereas the latter are the C atoms second from the top. The kink sites are labeled α and β. Panels (b)–(e) represent the optimized structures of a nitrogen atom at the kink of the [
 ] step edge. Dashed zigzag line in each panel is a guide to the eyes to help identify the position of the kink. Gray, blue, and red circles represent C, H, and N atoms, respectively. Panels (b) and (c): N atoms at the α and β kink sites, respectively, where both step edges are reconstructed. Panels (d) and (e): N atoms at the α and β kink sites, respectively, where both step edges are unreconstructed.
Download figure:
Standard image High-resolution image
On the basis of this growth picture, we performed further first-principles energetics calculations16) of various structures with N in kinks at the step edge of C(111)-1 × 1:H. The configuration leading to the [111]-oriented NV centers is that shown in Fig. 4(a), in which the N occupies the α site, rather than that with N at the β site of the kink.
We indeed identified possible atomic structures that favor the N in the α position at the kink of the [ ] step [Fig. 4(a)]. This step has been not only studied theoretically as a hydrocarbon incorporation mechanism21,22) but also experimentally observed.20,23) We considered two possible N positions at the kink (α and β sites), each of which is further examined in two different step-edge structures (reconstructed and unreconstructed). We found that the N at the α kink site is energetically favorable for formation at both reconstructed and unreconstructed step edges. The energy gain relative to N at the β site is 0.51 eV for the reconstructed step edge [Fig. 4(b) relative to Fig. 4(c)] and 0.46 eV for the unreconstructed step edge [Fig. 4(d) relative to Fig. 4(e)]. In combination with the consideration above, our result shows that layer-by-layer growth via the fast kink flow enables the [111]-oriented NV centers to be frozen in the (111) surface in the absence of unwanted NVs arranged in other directions. Thus, our theoretical study explains the experiment.
In summary, ODMR experiments revealed that the orientations of more than 99% of the NVs can be aligned along the [111] axis in diamond through high-quality CVD homoepitaxial growth on (111) substrates. A possible clue to the NV alignment in lateral layer-by-layer growth is the preferential generation of N atoms occupying the topmost C positions at the kinks in the [ ] steps, which will become threefold coordinated after surface layer completion. Their lone pairs produce the vacancies on top of N, and the [111]-aligned NV centers are embedded in the subsequent growth.
While preparing this manuscript, we became aware of similar research submitted to arXiv related to the alignment of NV in diamond grown on diamond (111) substrates by the CVD growth technique.24,25) In one of the submitted preprints, the authors24) briefly comment on a possible mechanism of the NV alignment, focusing on the step equivalent to the [ ]-oriented one shown in Fig. 4(a).
Acknowledgments
The authors acknowledge financial support from the SCOPE, JST-CREST, KAKENHI, and NICT programs.