Abstract
We performed spectroscopic observations of the 698-nm clock transition in 87Sr confined in an optical lattice using a laser linewidth transfer technique. A narrow-linewidth laser interrogating the clock transition was prepared by transferring the linewidth of a master laser (1064 nm) to that of a slave laser (698 nm) with a high-speed controllable fiber-based frequency comb. The Fourier-limited spectrum was then observed for an 80-ms interrogating pulse. We determined that the absolute frequency of the 5s2 1S0–5s5p 3P0 clock transition in 87Sr is 429 228 004 229 872.0 (1.6) Hz referenced to the SI second.
Export citation and abstract BibTeX RIS

Content from this work may be used under the terms of the Creative Commons Attribution 4.0 license. Any further distribution of this work must maintain attribution to the author(s) and the title of the work, journal citation and DOI.
This article was made open access on 16 September 2015
The precise measurement of time and frequency is of great interest for a wide range of applications, including fundamental science and metrology. Optical frequency standards have been extensively studied, and great strives have been made in improving their frequency stability and reducing uncertainty over the past few decades. Optical clocks have been realized with various ions and atoms including Al+,1) Hg+,2) Sr,3) and Yb.4,5) Because some optical clocks have already outperformed the best microwave clocks, they are being studied by the International Committee for Weights and Measures (CIPM) with a view to redefining the second. Along with several single-ion optical clocks, both Sr and Yb optical lattice clocks were recommended by the CIPM as secondary representations of the second (candidates for the redefinition of the second).6) The absolute frequency of the clock transition of the Sr optical lattice clock was measured by groups at JILA (Boulder),7) SYRTE (Paris),8,9) UTokyo–NMIJ,10) PTB (Braunschweig),11) and NICT (Koganei).12,13) The CIPM is expecting to receive additional measurement resultsfrom independent groups to confirm the agreement of the clocks, search for any undiscovered uncertainty factors, and update the recommended clock frequency. Furthermore, the realization of different kinds of high-performance optical clocks would allow us to measure the high precision frequency ratio of clocks, which is important for tests in fundamental physics, such as for studying the temporal variation of the fine-structure constant.14)
In the clock experiments, a clock laser with an ultranarrow linewidth is usually prepared to interrogate the clock transition by stabilizing its frequency to a high-finesse optical reference cavity with an ultra-low-expansion (ULE) spacer and mirrors with high reflectivity and a low-loss coating. However, thermally induced fluctuations in the constituents of the cavity impose a fundamental limit on the linewidth of the clock laser.15) To reduce thermal noise, a silicon reference cavity operating at a cryogenic temperature is used.16) In the same context, a mirror with an AlGaAs multilayer coating has also been studied.17) Although these experiments were not performed at a clock transition frequency, a frequency comb makes it possible to transfer the linewidth and stability to that at the clock transition frequency. Since a frequency comb can distribute the linewidth of a master laser to slave lasers at arbitrary wavelengths covered by the frequency comb, only a single ultranarrow linewidth master laser is necessary even in an experiment with multiple clock transitions.
To measure the clock transition of 87Sr, the frequency stability of a light source at 729 nm was transferred to a light source at 698 nm with a titanium-sapphire laser comb.12) However, because of the limited feedback bandwidth of the comb, the linewidth of the 729-nm laser was not transferred to the 698-nm laser. In this case, in addition to the stability transfer using the comb, a high-finesse cavity was needed to prestabilize the laser at 698 nm. A fiber-based frequency comb (fiber comb) is superior to a titanium-sapphire comb in terms of its long-term robustness, which is an important characteristic for frequency measurement experiments. Very recently, a group at PTB reported experimental results on transferring laser frequency stability at the 10−16 level with a fiber comb and demonstrated the spectroscopy of Sr in an optical lattice.18) However, because of the limiting servo bandwidth of the comb (500 Hz), they also needed an extra high finesse cavity for prestabilization of the clock laser. The feedback bandwidth of the fiber comb can be increased with an intracavity electro-optic modulator (EOM),19) and the increased feedback bandwidth is sufficiently broad to reduce the comb linewidth.20,21) By using a narrow-linewidth fiber comb, the spectroscopy of 171Yb in an optical lattice was successfully demonstrated based on laser linewidth transfer.22,23) However, in the previous experiment,23) the Fourier-limited spectrum was only observed for an interrogation time of up to 40 ms (corresponding to the spectrum linewidth of 20 Hz).
In the present work, we observe the Fourier-limited spectrum for an 80-ms interrogation pulse. We also perform an absolute frequency measurement of the 5s2 1S0–5s5p 3P0 clock transition in 87Sr with the laser linewidth transfer technique. In this experiment, a narrow-linewidth laser operated at 689 nm for intercombination magneto-optical trapping (MOT) is also prepared with the laser linewidth transfer technique.24) This has reduced the work needed to build a 689-nm high-finesse cavity and simplified the optical lattice clock system. Furthermore, the optical frequency comb described in this paper can be employed to prepare clock lasers for both Yb and Sr optical lattice clocks from a common master laser. In such cases, because the frequency noise of the clock lasers is correlated, the measurement stability of a Yb/Sr frequency ratio measurement can be improved by a synchronous interrogation of the two clock transitions.25)
Figure 1 shows a schematic diagram of our experimental setup. The master laser was a monolithic nonplanar-ring-oscillator (NPRO) Nd:YAG laser emitting at 1064 nm with a free-running linewidth of several kilohertz. The frequency of the master laser was stabilized to a high-finesse ULE cavity by using the Pound–Drever–Hall method. The instantaneous linewidth of the master laser was less than 3.5 Hz. However, the linewidth including frequency jitter at an averaging time of several seconds was 10 Hz. We compensated for the linear frequency drift of the master laser (85 mHz/s) caused by the creep of the reference cavity26) by using an acousto-optic modulator (AOM). A fiber comb equipped with an intracavity EOM was used to obtain a broad servo bandwidth for linewidth transfer. The repetition rate of the comb was approximately 43.4 MHz. The carrier-envelope offset frequency was detected by using a conventional f–2f interferometer and stabilized to a hydrogen maser at our institute. Our fiber-based frequency comb is described in detail elsewhere.20) A heterodyne beat between the master laser at around 1064 nm and the comb component (fcomb–YAG) was detected to stabilize the repetition rate of the comb by using the intracavity EOM. The linewidth of the comb components was reduced to the hertz level owing to the broad servo bandwidth (approximately 1.4 MHz) of the EOM. The clock laser was a homemade extended cavity diode laser (ECDL) with an antireflection-coated diode laser. The free-running linewidth of the ECDL was ≈300 kHz. The ECDL generated 20 mW of output light with an injection current of 70 mA. A heterodyne beat note was observed by mixing part of the ECDL output (1 mW) and the second-harmonic comb modes around 698 nm, which were generated by a periodically poled lithium niobate (PPLN) crystal. The ECDL was phase-locked to one appropriate mode of the narrow-linewidth optical comb by employing direct feedback control to the injection current of the diode laser. The servo bandwidth of the phase-locking was approximately 700 kHz. The tight phase lock allowed the linewidth of the comb to be transferred to the ECDL. The remaining output of the ECDL traveled through a double-pass AOM to control the laser frequency and was used for the spectroscopy of the 1S0–3P0 transition. The narrow-linewidth comb was also used for preparing the narrow-linewidth cooling laser for the intercombination MOT at 689 nm (not shown in Fig. 1).24)

Fig. 1. Schematic diagram of experimental setup. ECDL, extended cavity diode laser; PPLN, periodically poled lithium niobate; ULE cavity, ultra-low-expansion cavity; PDH lock, Pound–Drever–Hall lock; AOM, acousto-optic modulator; EOM, electro-optic modulator; SMF, single-mode fiber; EM-CCD, electron multiplying charged coupled device. Local oscillators (LO) are microwave sources.
Download figure:
Standard image High-resolution imageThe Sr optical lattice clock operates with lattice-confined 87Sr atoms with nuclear spin I = 9/2. After two-stage laser cooling using the 1S0–1P127) and the 1S0–3P1 transitions,24) about 103 atoms were loaded onto a vertically oriented one-dimensional (1D) optical lattice. The lattice laser was generated by an ECDL at 813 nm and amplified by a tapered amplifier (TA). A transmission grating was used to remove the amplified spontaneous emission generated by the TA. The polarization axis of the lattice laser was parallel to that of the clock laser and an applied magnetic field during optical pumping and spectroscopy. The lattice laser frequency was set at 368 554.72(6) GHz, where we confirmed experimentally that the differential AC Stark shift of the clock transition was canceled. The lattice laser frequency was stabilized to another frequency comb and monitored with a wavemeter. The trap depth of the lattice was 24Er (where the recoil energy Er/kB = 170 nK). The clock laser was injected from the retro-reflection mirror of the optical lattice and aligned coaxially with the lattice laser so that the clock laser was coupled to the fiber of the lattice laser. The beam diameter of the clock laser was ∼310 µm, which was much larger than that of the lattice beam (180 µm). The larger beam waist ensured the homogeneous excitation of the atoms. To reduce line-pulling and collision shifts, the atoms were optically pumped to either of the stretched states  by a circularly polarized 25-ms light pulse resonant with the 1S0 (F = 9/2)–3P1 (F = 9/2) transition. During optical pumping, a homogeneous magnetic field of 91 µT parallel to the polarization of the lattice and clock lasers was used to define the quantization axis. The magnetic field was maintained during the spectroscopy. To observe the clock transition, a first π pulse by the clock laser was applied to the stretched-state atoms
  in the optical lattice to excite the atoms from the 1S0 state to the 3P0 state. To count the number of unexcited atoms, we measured the fluorescence (Iunexcited) on the strong 1S0–1P1 transition using an electron multiplying charged coupled device (EM-CCD) camera. We then applied a second π pulse of 4.5 ms to repump the atoms in the 3P0 state to the 1S0 state and counted the number of excited atoms by measuring the fluorescence (Iexcited). Figure 2
shows a typical Zeeman component (mF = −9/2) signal [Iexcited/(Iexcited + Iunexcited)] obtained by the first π pulse of 80 ms. A lineshape of 10 Hz is observed with a high excitation probability. The spectral structure of the mF = ±7/2 component resulting from the imperfect optical pumping was not observed. Therefore we neglected the line-pulling effect in the frequency measurement. For the clock operation, we optically pumped the atoms to each of the stretched states in turn. The interrogation cycle for each stretched state was 2 s. By averaging the frequency of the two states, we could eliminate the first-order Zeeman shift and determine the line center of the clock transition. In practice, by probing both sides of the spectrum at its full width at half maximum, the deviation of the clock laser frequency from the atomic resonance could be detected and used to stabilize the clock laser frequency.
in the optical lattice to excite the atoms from the 1S0 state to the 3P0 state. To count the number of unexcited atoms, we measured the fluorescence (Iunexcited) on the strong 1S0–1P1 transition using an electron multiplying charged coupled device (EM-CCD) camera. We then applied a second π pulse of 4.5 ms to repump the atoms in the 3P0 state to the 1S0 state and counted the number of excited atoms by measuring the fluorescence (Iexcited). Figure 2
shows a typical Zeeman component (mF = −9/2) signal [Iexcited/(Iexcited + Iunexcited)] obtained by the first π pulse of 80 ms. A lineshape of 10 Hz is observed with a high excitation probability. The spectral structure of the mF = ±7/2 component resulting from the imperfect optical pumping was not observed. Therefore we neglected the line-pulling effect in the frequency measurement. For the clock operation, we optically pumped the atoms to each of the stretched states in turn. The interrogation cycle for each stretched state was 2 s. By averaging the frequency of the two states, we could eliminate the first-order Zeeman shift and determine the line center of the clock transition. In practice, by probing both sides of the spectrum at its full width at half maximum, the deviation of the clock laser frequency from the atomic resonance could be detected and used to stabilize the clock laser frequency.

Fig. 2. Typical spectrum of one Zeeman component (mF = −9/2) of 87Sr for a π pulse of 80 ms, fitted with a sinc function.
Download figure:
Standard image High-resolution imageFor absolute frequency measurements, the repetition rate of the frequency comb used for the linewidth transfer and the frequency driving the AOM to stabilize the clock laser were recorded by frequency counters, whose microwave references were coordinated universal time UTC(NMIJ). Figure 3(a) shows six absolute frequency measurements obtained over five days (May 23 to 27, 2013). Figure 3(b) shows a typical Allan standard deviation of the measured absolute frequency [measurement #3 in Fig. 3(a)] against UTC(NMIJ). The Allan standard deviation was 2.4 × 10⁻¹³ for an 8-s averaging time, and it improved after a 3700-s averaging time to 2.0 × 10⁻¹⁵. We note that the measured Allan deviation follows the stability of UTC(NMIJ). The uncertainty was given by the Allan standard deviation at the longest averaging time for each measurement [e.g., the uncertainty for measurement #3 in Fig. 3(a) was calculated by using the Allan standard deviation in Fig. 3(b)]. The standard deviation of the measurements of over five days [shown in Fig. 3 (a)] was calculated to be 9.3 × 10⁻¹⁶, which indicates the measurement statistics in the experiment.

Download figure:
Standard image High-resolution image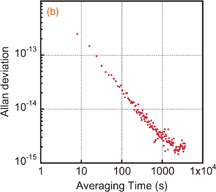
Fig. 3. (a) Absolute frequency measurements obtained over 5 days. Data shown in this figure do not include systematic corrections. (b) The Allan standard deviation of the frequency measurement against UTC(NMIJ).
Download figure:
Standard image High-resolution imageThe corrections and uncertainties for the 87Sr optical lattice clock are listed in Table I . The largest correction was due to the blackbody radiation shift, which was estimated to be 55.3(2.3) × 10−16 for the temperature of the vacuum chamber [T = 303(3) K].28) For the AC Stark shift caused by the lattice laser, the second-order Zeeman shift, and the collision shift, we experimentally determined the systematic shift by employing an interleaved scheme, in which we varied the parameters to be investigated between two values synchronized with the clock cycle. The AC Stark shift caused by the lattice laser, second-order Zeeman shift, and collision shift were determined experimentally to be 0.0(1.8) × 10−16, −4.3(1.1) × 10−16, and 0.0(2.1) × 10−16, respectively. The AC Stark shift induced by the clock laser was estimated to be −0.2(2) × 10−16. The gravitational shift was calculated to be 22.7(6) × 10−16 by using the height of the trapped atoms from the geoid surface of 20.9(5) m. While stabilizing the clock laser to the clock transition, we recorded the excitation ratio and evaluated the servo error to be 0.5 × 10⁻¹⁶. All the above corrections add up to 37.0 × 10⁻¹⁶ with an uncertainty of 3.8 × 10⁻¹⁶ (Table I).
Table I. Frequency corrections and their uncertainties.
| Effect | Correction (10−16) | Uncertainty (10−16) |
|---|---|---|
| Blackbody radiation | 55.3 | 2.3 |
| AC Stark (lattice) | 0.0 | 1.8 |
| AC Stark (probe) | 0.2 | 0.2 |
| Second-order Zeeman | 4.3 | 1.1 |
| Collision | 0.0 | 2.1 |
| Gravitation | −22.7 | 0.6 |
| Servo error | 0.0 | 0.5 |
| Sr systematics total | 37.0 | 3.8 |
| UTC(NMIJ) | — | 33.0a) |
| UTC(NMIJ)–TAI | −6.9 | 13.1 |
| TAI–SI | 4.0 | 2.0 |
| Measurement statistics | 9.3 | |
| Total | 34.1 | 37.0 |
a) The uncertainty is due to the short measurement time. See text.
UTC(NMIJ) is compared with International Atomic Time (TAI) via a satellite link at five-day intervals. However, because the Sr lattice clock was operated several hours a day, we conservatively estimate the uncertainty attributed to the measurement time gap to be 33.0 × 10⁻¹⁶ based on the frequency variation of UTC(NMIJ). The results of the frequency link between UTC(NMIJ) and TAI can be found in Circular T, which is published on the BIPM web page.29) From Circular T 305, the correction of the link between UTC(NMIJ) and TAI was found to be −6.9(13.1) × 10−16. The correction between TAI and SI of 4.0(2.0) × 10−16 was also obtained from Circular T 305.
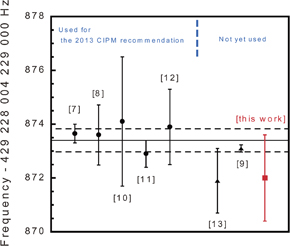
The total systematic uncertainty of the absolute frequency measurement in Table I is 37.0 × 10⁻¹⁶ (1.6 Hz), including the measurement statistics. The inclusion of the corrections in Table I gives a final absolute frequency of 429 228 004 229 872.0 (1.6) Hz referenced to the SI second. Figure 4 shows the frequencies of the 87Sr clock transition measured at different laboratories. Our measurement result agrees with measurements performed at different laboratories within the uncertainty. The measured absolute frequency will be reported to the CIPM via the next Consultative Committee for Time and Frequency meeting scheduled for 2015 and will contribute to discussions regarding updating of the recommended frequency value ofthe 87Sr lattice clock, which is one of the secondary representations of the second.
Fig. 4. Comparison of the absolute frequencies of the 87Sr clock transition measured at different laboratories. The horizontal solid and broken lines represent the recommended value and its uncertainty for 87Sr by the CIPM in 2013. The solid circles represent the data used for the 2013 CIPM recommendation. The solid triangles represent the data not yet reported to the CIPM. The red solid rectangle represents the result of this work.
Download figure:
Standard image High-resolution image
Acknowledgment
This research was supported by the Japan Society for the Promotion of Science (JSPS) through its FIRST Program and by JSPS KAKENHI Grant Number 13222778.