Abstract
As the first line of defence, skin is regularly exposed to a variety of biological, physical and chemical insults. Therefore, determining the skin sensitization potential of new chemicals is of paramount importance from the safety assessment and regulatory point of view. Given the questionable biological relevance of animal models to human as well as ethical and regulatory pressure to limit or stop the use of animal models for safety testing, there is a need for developing simple yet physiologically relevant models of human skin. Herein, we describe the construction of a novel immunocompetent 3D human skin model comprising of dendritic cells co-cultured with keratinocytes and fibroblasts. This model culture system is simple to assemble with readily-available components and importantly, can be separated into its constitutive individual layers to allow further insight into cell–cell interactions and detailed studies of the mechanisms of skin sensitization. In this study, using non-degradable microfibre scaffolds and a cell-laden gel, we have engineered a multilayer 3D immunocompetent model comprised of keratinocytes and fibroblasts that are interspersed with dendritic cells. We have characterized this model using a combination of confocal microscopy, immuno-histochemistry and scanning electron microscopy and have shown differentiation of the epidermal layer and formation of an epidermal barrier. Crucially the immune cells in the model are able to migrate and remain responsive to stimulation with skin sensitizers even at low concentrations. We therefore suggest this new biologically relevant skin model will prove valuable in investigating the mechanisms of allergic contact dermatitis and other skin pathologies in human. Once fully optimized, this model can also be used as a platform for testing the allergenic potential of new chemicals and drug leads.
Export citation and abstract BibTeX RIS

Content from this work may be used under the terms of the Creative Commons Attribution 3.0 licence. Any further distribution of this work must maintain attribution to the author(s) and the title of the work, journal citation and DOI.
1. Introduction
The primary focus of tissue engineering approaches has been repair, replacement and/or regeneration of damaged or diseased tissue by the exploitation of cells, biomaterials and specific growth factors. Such applications have gained significant momentum over the years due to the intense demand for tissues substitutes. However, the need for using biologically relevant tissue constructs as alternatives to animal models for drug development and/or disease modelling has furthered interests within the field (Ghaemmaghami et al 2012, Elliott and Yuan 2011, Haycock 2011, Langer and Vacanti 1993).
Skin is one of body's first defence barriers and consists of an outer epidermal layer of keratinocytes and a lower dermal layer of fibroblasts, interspersed with a family of dendritic cells (DCs) which contribute to regulating the immune response of the skin (see reviews by Metcalfe and Ferguson 2007, Callard and Harper 2007, Ryan et al 2007). Ever since the seminal work of Rheinwald and Green (1975), a variety of skin substitutes have been developed over the years that include both acellular and cellular alternatives and, to this end, several commercial products have been available for use in the clinic (reviewed in Shevchenko et al (2010)). Moreover, several models also exist which replicate diseased states and/or mimic the dermal physiological environment e.g. wound healing, diabetes, skin contraction, pigmentation and tumour invasion (Groeber et al 2011, Lammers et al 2011, Brohem et al 2011, MacNeil 2007, Harrison et al 2006).
We are increasingly exposed to a variety of new chemicals that are used in personal and healthcare products. The potential toxicity of any chemical is always a cause of concern but their ability to elicit adverse dermal allergenic/immunogenic responses also needs to be considered. Historically, such concerns have led to the development of numerous test-methods including the guinea pig maximization test (Magnusson and Kligman 1969), the Buehler test (Robinson et al 1990) and the local lymph node assay in its original and modified versions (Hilton and Kimber 1995, Kimber et al 1995, 2001). Whilst informative and still in current use (under the implementation of the Registration, Evaluation, Authorisation and Restriction of Chemicals (REACH) 1907/2006 regulation (Adler et al 2011)), the majority of these models suffer from several limitations including their questionable biological relevance to humans. Moreover, it is expected that the use of animal models in safety testing will be significantly limited due to introduction of the 7th Amendment to the EU Cosmetics Directive. Therefore, there is an urgent need to establish more reliable and physiologically relevant models for the assessment of substances that may cause skin sensitization and also address the ethical aspects of animal testing. Whilst a number of human skin model equivalents exist and have been successfully used for skin 'irritation' studies, there are very few skin models, which are 'immunocompetent' and hence suitable for performing skin 'sensitization' studies (Reuter et al 2011, Johansson et al 2012, Pistoor et al 1996, LeClaire and de Silva 1998, Streilein 1989). With only a limited number of models currently available and to close the clear gap in the growing pool of in vitro sensitization methods, our aim was to develop a physiologically relevant human based 3D model of keratinocytes, DCs and fibroblasts which can be readily assembled and, importantly, be separated into its constitutive individual layers to allow further elucidation of cell–cell interactions and detailed studies of the mechanisms of skin sensitization. Not only can this model be used for the testing of the allergenic potential of novel chemicals but can also provide valuable insight to the molecular basis of skin sensitization.
2. Materials and methods
2.1. Ethics approval
The isolation of human epidermal keratinocytes and human dermal fibroblasts was performed from skin samples obtained, with prior written consent, from female patients undergoing surgery for breast reductions or abdominoplasty. The procedure was approved by the local ethics committee (Sheffield NHS Trust, Sheffield, UK) and samples were handled and stored under The Human Tissue Authority (UK) license number 12179. Peripheral blood of healthy volunteers was used for the generation of monocyte-derived DCs which was obtained with prior written consent and the approval of the University of Nottingham Medical School Research Ethics Committee.
2.2. Scaffold generation
A commercially available microfibre-based construct (i.e. SLS Selectwipes™, SLS, Nottingham, UK), made of wet spun PES/viscose rayon microfibre material containing a butadiene copolymer, was used as the cell scaffold support throughout this study. These scaffolds were cut into 2 cm diameter circles (200 µm thickness) and stored in 70% (v/v) IPA before use. Prior to surface modification, scaffolds were washed thrice in sterile PBS before air-drying on 90 mm petri dishes in a microbiological safety cabinet. For the plasma polymerization process, an in-house developed radio frequency (RF) plasma polymer deposition reactor consisting of a glass cylindrical tube (L: 40 cm;  : 10 cm) enclosed within a copper coiled element and closed by aluminium/brass endplates (QVF, Stafford, UK) was used. Briefly, operating conditions consisted of a base and working pressure of 3×10⁻³ mbar and 6×10⁻³ mbar respectively to ensure a steady acrylic acid flow rate of 2.4–2.5 cm3 min–1 throughout the system. Acrylic acid (147230, Sigma-Aldrich, Poole, UK) plasma formation was initiated and sustained at 13.56 MHz (15 W discharge power) using a RF signal generator (Coaxial Power Systems Ltd, Eastbourne, UK) and the process terminated following a 10 min coating cycle. Impedance matching was used throughout the process to ensure that the reflected RF power was minimized.
2.3. Isolation of keratinocytes and fibroblasts from donor skin
The isolation of dermal fibroblasts and epidermal keratinocytes from freshly acquired skin was performed as previously described (Ralston et al 1999, Goberdhan et al 1993). Briefly, skin samples were cut into 0.5 cm2 pieces and left overnight at 4 °C in Difco-trypsin (0.1% (w/v) trypsin, 0.1% (w/v) D-glucose in PBS, pH 7.45) before being washed and maintained in PBS. The epidermis was excised before the papillary surface of the dermis was gently scraped to remove basal keratinocytes, harvested by centrifugation (200 g for 5 min) and then resuspended in Green's medium (Cantòn et al 2010, Haddow et al 1999). Subsequently, keratinocytes were seeded (1×10⁶ cells cm–2) into 75 cm2 tissue culture flasks containing a feeder layer of irradiated mouse 3T3 cells and incubated in a humidified incubator (37 °C and 5% (v/v) CO2) until reaching 80–90% confluency. For 3D cultures, keratinocytes were used between passages 1 and 2. Fibroblast isolation was achieved by mincing the dermis with a scalpel blade into 5–10 mm2 pieces before incubating them overnight at 37 °C in a solution of 0.5% (w/v) collagenase A. The suspension of fibroblasts that remained was collected via centrifugation (400 g for 10 min) and resuspended in DMEM containing 10% (v/v) FBS, 100 IU ml–1 penicillin, 100 mg ml–1 streptomycin, 2 mM L-glutamine and 0.625 µg ml−1 amphotericin B. Cells were seeded into a 25 cm2 tissue culture flask and cultured in a humidified incubator (37 °C and 5% (v/v) CO2) until 80–90% confluent. For 3D cultures, fibroblasts were used between passages 4 and 7.
2.4. Purifying monocytes and generation of monocyte derived dendritic cells (mDCs)
mDCs were generated from peripheral blood monocytes (PBMC) of healthy volunteers as previously described (Horlock et al 2007). Briefly, PBMC were separated from heparinized whole blood by a standard density gradient centrifugation protocol using Histopaque®1077 (Sigma, Poole, UK). Monocytes were purified using the MACS™ anti-CD14 microbead separation kit (Miltenyi Biotec, Woking, UK). Generation of immature DCs consisted of culturing 1×10⁶ CD14+ cells (with >90% purity) in 1 ml RPMI medium supplemented with 10% (v/v) FCS, 2mM L-glutamine and 1% (v/v) penicillin–streptomycin solution, 250 U ml–1 recombinant human (rh) IL-4 and 50 ng ml–1 (rh) GM-CSF (R&D Systems, Oxford, UK), for six days, in a 12-well plate (Corning, CA).
2.5. Immune layer: mDCs incorporated agarose–fibronectin gel
mDCs were incorporated within an agarose–fibronectin gel and this whole construct formed the 'immune layer' of the 3D model. Briefly, a 4% (w/v) agarose solution (Sigma-Aldrich, Poole, UK) was heated in a water-bath at 80 °C until completely solubilized. 450 µl of this molten agarose was then transferred to a well (24 well-plate) and allowed to cool <37 °C before 50 µl of 0.1% (w/v) fibronectin solution (from human plasma, Sigma-Aldrich) was added directly to the well and mixed thoroughly by pulsing the pipette tip. Immediately thereafter, 25–50 µl of mDCs cell suspension was added to the centre of the agarose–fibronectin gel and the whole construct transferred to a humidified incubator (at 37 °C and 5% CO2) for 30 min to allow the gel to set. Following this incubation, 300 µl of complete media was added to the well and the plate returned to the incubator for a further 90 min before the centre of the cells-in-gel was removed/cut-to-size using a standard sized cork-borer (Size 4, Sigma-Aldrich, Poole, UK) and used immediately thereafter.
2.6. Construction of a 3D co-culture model
Keratinocytes (5×10⁵) were seeded onto a four-layer thick stack of acrylic acid pre-treated microfibre scaffolds, contained within a stainless steel ring ( : 1 cm), and cultured for two days in Green's medium. In parallel, fibroblasts (1.5×10⁵) were seeded on a four-layer thick stack of untreated scaffolds, within a stainless steel ring (
 : 1 cm), and cultured for two days in complete DMEM. Following two days of culture in a humidified incubator at 37 °C and 5% (v/v) CO2, the metal rings were removed and the top layer of each cell line specific scaffold stack were combined using CellCrown™ inserts ensuring that fibroblasts were placed at the bottom, a 4% (w/v) agarose gel insert (
 : 1.2 cm) in the middle and the keratinocyte layer at the top. This construct was then placed into a six well-plate and complete medium added to ensure that the upper (keratinocyte) layer was at the air–liquid (A–L) interface and cultured for a total of six days. The initial five days was in complete Green's medium followed by one day in Green's medium without hydrocortisone (HC) or cholera toxin (CT). Following this culture period, the 4% (w/v) agarose gel was removed and replaced with the mDCs incorporated fibronectin–agarose gel insert as described above and cultured in a (50:50) mixture of Green's medium (without HC and CT): RPMI medium (supplemented with 10% (v/v) FBS, 2 mM L-glutamine and 1% (v/v) penicillin–streptomycin solution) and kept in a humidified incubator at 37 °C and 5% (v/v) CO2, overnight, prior to immediate use. The number of cells of each population was pre-defined at a ratio of (30:10:1) for the (keratinocyte:fibroblast:mDCs) for the complete 3D cell model set-up. To ensure that differentiation was permissible, the construct was placed on a plastic support in order to maintain culture at an A–L interface (figure 1).

Figure 1. Schematic of the complete 3D co-culture model. 500 K keratinocytes, 150 K fibroblasts and 15 K mDCs were pre-seeded onto the appropriate scaffolds/matrix before being assembled together using CellCrown™ inserts—ensuring that the agarose gel was sandwiched between the upper (keratinocyte) and bottom (fibroblast) layers. This entire construct was then placed onto a plastic platform insert (blue square) with sufficient medium added to each well to ensure an A–L interface was maintained throughout the culture period.
Download figure:
Standard image High-resolution image2.7. Scanning electron microscopy (SEM)
Scaffold layers from the 3D cell model were fixed in 3.7% (w/v) glutaraldehyde (in 0.1M PBS) for 4 h at 4 °C, washed twice (15 min intervals) with cold 0.1 M PBS and then treated with 2% (v/v) osmium tetraoxide solution for 1 h. Following this fixation step, samples were washed twice with cold 0.1 M PBS and then processed through a series of 15 min dehydration steps involving ethanol (50%, 75%, 95% and 100%) before being left to air-dry over anhydrous copper sulfate for 15 min. Samples were then placed in a (50:50) mixture of (100% hexamethyldisiazane:100% ethanol) for 30 min followed by another 30 min in 100% hexamethyldisiazane before being left to air-dry overnight. Specimens were thereafter mounted on 12.5 mm aluminium SEM stubs using double-sided sticky tabs and then gold coated (25 nm layer), under an argon atmosphere, in an Edwards S150B sputter-coater. Coated samples were examined using a Philips XL-20 SEM unit operating at an accelerating voltage of 20 kV.
2.8. Immunostaining of layers for imaging
Following a one-week culture at an A–L interface, the 3D constructs were fixed in 3.7% (v/v) formaldehyde before being washed thrice with PBS. The construct was then dismantled and both the upper (keratinocytes) and bottom (fibroblasts) layers were permeabilized using 1% (v/v) Triton-X100, 1 h at 4 °C, before being washed thrice again with PBS. For the keratinocytes, the layer was pre-blocked with 5% (w/v) BSA (in PBS) for 1h, at room temperature, followed by three washes with PBS and then incubated with cytokeratin pan AE1/AE3 mouse monoclonal antibody (1:50 with 1% (w/v) BSA in PBS) (GTX73583, Source Bioscience, UK) overnight, at 4 °C. Following this incubation, the sample was washed thrice with PBS and then incubated with a biotinylated goat anti-mouse secondary antibody (1:500 with 1% (w/v) BSA in PBS) (BA 9200, Vector Laboratories, UK) for 1 h, at room temperature, before being washed as above. Finally, fluorescein streptavidin (1:100 with 1% (w/v) BSA in PBS) (SA 5001, Vector Laboratories, UK) was added to the layer and incubated for 30 min, at room temperature, and washed again. For both layers, an additional staining with phalloidin-TRITC (1:250) (P1951, Sigma-Aldrich, UK) and DAPI (1:1000) (D9542, Sigma-Aldrich, UK) in PBS were performed and incubated for 1 h, at room temperature, followed by three washes with PBS. All the samples were imaged, in PBS, using a 40× water-dipping lens on a Zeiss LSM510 META confocal microscope.
2.9. Histology and immunohistochemistry
3D models were fixed in 3.7% (v/v) formaldehyde, dehydrated, cleared and infiltrated with molten paraffin wax using a Leica 1020 Tissue Processor. Initial experiments were performed using cryosectioning but fracturing of the scaffold fibres was found to introduce artefacts to the sections and cause physical disruption to the organized structure. Briefly, samples were then cut vertically in half and embedded in paraffin wax so that sectioning was perpendicular to the surface of the sample. Sections (8 µm) were mounted on Superfrost glass microscope slides, allowed to air-dry overnight, de-waxed and rehydrated (xylene and 100%, 90% and 70% (v/v) graded alcohol in tap water) before staining with haematoxylin and eosin (H&E). Stained samples were dehydrated and mounted with DPX mounting medium before imaging. For visualizing specific proteins within the 3D model, the following antibodies were used: mouse monoclonal Ki67 antigen (NCL-L-Ki67-MM1, Novocastra™, Leica Microsystems, UK), mouse monoclonal to Involucrin, clone SY5 (NCL-INV, Novocastra™, Leica Microsystems, UK), mouse monoclonal to Cytokeratin pan (AE1/AE3) antibody (GTX73583, Source Bioscience, UK), mouse monoclonal (DE-K10) to cytokeratin-10 (ab9026, Abcam, UK) and mouse monoclonal (LL002) to cytokeratin-14 (ab7800, Abcam, UK). Immunohistochemical staining was carried out on tissue sections using Vectastain Elite ABC kit (PK-6100, Vector Laboratories, UK).
2.10. Electrical skin impedance determination
The barrier properties of the 3D constructs were assessed using a NOVA Technologies DPM9003 electrode (NOVA Technologies Corporation, LA, USA) to directly measure skin impedance/relative hydration. Impedance for each sample was measured following an initial 5 s steady state contact time with the sample. Values were compared and normalized against a sample of tissue-engineered skin (fibroblasts and keratinocytes seeded onto the papillary surface of de-epidermalized dermis and cultured at the A–L interface in Green's medium) (Smith et al 2010, Chakrabarty et al 1999).
2.11. Total collagen deposition within individual scaffold layers
The 3D co-culture model was cultured for one week at an A–L interface (37 °C and 5% CO2) and then fixed in 3.7% (v/v) formaldehyde. After separating the layers, samples were washed thrice in PBS and then incubated for 18 h at room temperature with 0.1% (w/v) Sirius Red in picric acid. Each layer was then washed thoroughly using tap water and air-dried before taking photographs.
2.12. Stimulating the 3D co-culture model
An established skin sensitizer, dinitrochlorobenzene (DNCB), at 2 µM was used to stimulate this model for 24 h (Kuper et al 2008). In short, 20 µl of the DNCB solution was directly added to the upper layer (keratinocytes) of the model and then left in a humidified incubator at 37 °C and 5% (v/v) CO2. Following 24 h of incubation, the model was then separated into its individual layers: the agarose gel transferred to a bijoux containing RPMI for DC retrieval and phenotyping while the scaffold layers analysed for cell viability using a standard MTT assay according to the manufacturer's instructions (0.5 mg ml−1 MTT in PBS, 45 min at 37 °C) and/or immunohistochemistry/confocal imaging/microscopy. Supernatants from the culture constructs were also collected, centrifuged (to collect migrated DCs) before being frozen (−20 °C) immediately for cytokine analysis at a later date. The cell pellet was resuspended in complete RPMI medium in preparation for flow cytometry analysis.
2.13. Recovering mDCs from agarose–fibronectin gel layer
DCs were retrieved from the agarose–fibronectin gel using a combination of mild mechanical homogenization and straining/sieving. Briefly, gel samples were removed from the well plate/experimental set-up and placed in a GentleMACS C-tube (Miltenyi Biotec, Woking, UK) with 15 ml of PBS. Tubes were then processed using the pre-loaded programmes on the GentleMACS Dissociator namely, a four-step cycle of 'spleen_01, lung_01, heart_01 and spleen_01' prior to being centrifuged, at 350 g for 5 min, to collect any cells/debris dispersed at the base of the cap or around the impeller of the C-tube. Following centrifugation, the supernatant was removed and the pellet resuspended in 20 ml of PBS. This mixture was then passed through a 100 µm BD Falcon cell strainer (BD Biosciences, Oxford, UK) into a 50 ml Falcon tube to remove the larger sized debris. The cell strainer was then washed with a further 20 ml of PBS before the sample centrifuged at 350 g for 5 min. Again, the supernatant was removed and the resuspended pellet (20 ml of PBS) passed through a 70 µm BD Falcon cell strainer and washed as above. The remaining cell pellet was then collected by centrifugation at 350 g for another 5 min. If samples were to be processed for FACS analysis, an additional step using a 40 µm BD Falcon cell strainer was performed.
2.14. Flow cytometry for expression of cell surface markers
Expression of cell surface markers was assessed by the addition of monoclonal antibodies with specificity for individual cell surface markers. All antibodies and isotype controls were purchased from Beckman Coulter (High Wycombe, UK) unless otherwise stated. The panel of antibodies used in this investigation include: PE-CD11c (clone BU15, IgG1), FITC-CD14 (clone RMO52, IgG2a), FITC-CD54 (clone 84H10, IgG1), FITC-CD80 (clone MAB104, IgG1), PCy5-CD83 (clone HB15a, IgG2b), PE-CD86 (clone HA5.2B7, IgG2bκ), DEC205 (clone MG38, IgG2b, AbD Serotec), PE-CD206 (clone 3.29B1.10, IgG1), PE-CD209 (clone AZND1, IgG1), PCy5-HLA-DR (Immu-357, IgG1), FITC-CD324 (clone 67A4, IgG1, BioLegend) and FITC-Annexin V (clone VA33, IgG2a, AbD Serotec). Additionally, an unstained sample and the appropriate isotype control were included in each batch analysis to address autofluorescence and non-specific binding, respectively.
Cells were harvested and washed twice with PBA (0.5% (w/v) BSA and 0.1% (w/v) sodium azide in PBS). Following the final wash, the supernatant was removed and 5 µl of each of the antibodies of interest were added to the resultant cell pellet (residual volume ∼50 µl) before being vortexed and incubated, in the dark, for 20 min at 4 °C. Following incubation, the sample was washed with PBA before the addition of 600 µl of fixing solution (0.5% (v/v) formaldehyde, in PBS) and stored in the dark, at 4 °C, for a maximum of seven days. Acquisition was achieved using a Beckman Coulter EPICS Altra™ flow cytometer (Beckman Coulter, High Wycombe, UK) with a minimum of 8000 events collected for each sample. Data was analysed thereafter using WinMDI 2.9 software (build #2, 6-19-2000; Scripps Research Institute. http://facs.scripps.edu/software.html). Viable DCs were gated based on cells forward and side scatter characteristics as well as the expression of a lineage marker (i.e. CD11c). The absolute mean fluorescence intensity (MFI) value for each marker was determined. Absolute MFI value is defined as: [absolute MFI] = [MFI value of sample] – [MFI value of isotype/unstained sample].
2.15. Cytokine expression
Cytokine production by cells was quantified using the Human IL-1α, IL-6 and IL-8 ELISA kits (Peprotech, London, UK) according to the manufacturer's instructions. Detection was achieved using a BioTek ELx800 plate reader (Potton, Bedfordshire, UK) operating at 405 nm (630 nm correction) and normalized against the standard blank controls.
2.16. Investigation of the influence of keratinocyte differentiation on the response to SDS
Normal human keratinocytes were seeded on tissue culture plastic and cultured in Green's medium (10% FCS, 1.8 mM CaCl2) at 37 °C and 5% CO2. Keratinocytes were either cultured to 80–90% confluency so that the cells were largely proliferative or for 3–5 days to achieve post-100% confluency and inducing differentiation. In both conditions, keratinocytes were washed three times with serum-free DMEM (sfDMEM) and then incubated with 10−4 M SDS (in sfDMEM) for 24 h. sfDMEM was used as the negative control. Following 24 h incubation, the medium was collected and immediately frozen for subsequent analysis of IL-1α expression by ELISA. The cells were incubated in lysis buffer (48% urea, 5% SDS) for 1 h at 37 °C and then immediately frozen. A BCA protein assay was performed according to the manufacturer's instructions to quantify the total protein content of the cell lysate.
2.17. Statistical analysis
Mean values and standard deviations were calculated for each sample and the differences between the means were compared using Student's t-test (two-tailed) or one-way ANOVA where appropriate with p < 0.05 considered as significant. Microsoft Excel 2007 and/or SigmaPlot (Stat) software were used to perform the analysis.
3. Results
3.1. Establishing a media for cell co-culture
Initial work focused on defining a mutually compatible media in which keratinocytes and fibroblasts could be maintained following their individual expansion. In contrast, the challenge for mDCs co-culture was to prevent their constitutive maturation. Thus, a number of media combinations were investigated and it was found that a mixture of RPMI and Greens media was optimal as summarized in table 1. The selected media composition not only supported the growth and differentiation of all three cell-types but did not induce any detrimental impact on cell viability, phenotype and function.
Table 1. Composition of selected media formulations and its interaction with monocyte-derived dendritic cells.
| g L–1 | |||||||
|---|---|---|---|---|---|---|---|
| Component/media | RPMI (R0883) | DMEM (41965039) | Ham's F12 (21765029) | Greens (3×DMEM:1×F12) | Co-culture (RPMI:Greens) | ||
| Others | |||||||
| D-glucose | 2.0 | 4.5 | 1.8 | 3.8 | 2.9 | ||
| Supplements | |||||||
| FCS/FBS (% v/v) | 10 | 10 | – | 10 | 10 | ||
| L-glutamine (mM) | 2 | 2 | – | 2 | 2 | ||
| Penicillin (ILU ml–1) | 100 | 100 | – | 100 | 100 | ||
| Streptomycin (µg ml–1) | 100 | 100 | – | 100 | 100 | ||
| Amphotericin B (µg ml–1) | – | 0.62 | – | 0.62 | 0.31 | ||
| Epidermal growth factor (ng ml–1) | – | – | – | 10 | 5 | ||
| Hydrocortisone (µg ml–1) | – | – | – | 0.4 | – | ||
| Cholera toxin (mol L–1) | 1×10⁻¹⁰ | – | |||||
| Adenine (mol L–1) | 1.8×10⁻⁴ | 0.9×10⁻⁴ | |||||
| Insulin (µg ml–1) | – | – | – | 5 | 2.5 | ||
| Transferrin (µg ml–1) | 5 | 2.5 | |||||
| Triiodothyrionine (mol L–1) | – | – | – | 2×10⁻⁸ | 1×10⁻⁸ | ||
| Greens | Co-culture | ||||||
| mDCs characterization (n = 5) | RPMI | DMEM | Ham's F12 | With HC/CT | Without HC/CT | With HC/CT | Without HC/CT |
| % Cell viability (trypan blue exclusion assay) | 99±3.72 | – | – | 96±2.61 | 98±2.82 | 99±3.81 | 99±4.01 |
| Cell surface marker | 84.56 (CD86) | – | – | 87.84 | 142.02 | 82.18 | 117.08 |
| Expression level | 190.88 (CD54) | – | – | 45.61 | 117.71 | 71.83 | 115.42 |
| Absolute MFI valuea | 585.44 (CD11c) | – | – | 407.18 | 10.38 | 526.04 | 771.80 |
| Endocytosis uptake level (ΔMFI)b | 27.32 | – | – | 23.50 | 3.52 | 26.49 | 23.69 |
aAbsolute MFI value = (MFI of sample) – (MFI isotype/unstained sample) based on representative sample. bΔMFI = (MFI of sample at 37 °C) – (MFI of sample at 4 °C) based on representative sample. MFI = mean fluorescence intensity, HC = hydrocortisone, CT = cholera toxin, mDCs = monocyte-derived dendritic cell.
3.2. Construction of the multi-layered model
The isolation and routine culture of individual populations of primary keratinocytes and fibroblasts on acrylic acid coated microfibre-based scaffolds was achieved. Importantly, these cells were able to lay down their own ECM, which can be seen to intercalate and/or coat the pores of the scaffold construct within seven days of culture. Figures 2(A)–(B) show by SEM, a high resolution three-dimensional observation of the top surface and transverse edge of keratinocytes cultured on the scaffolds. Samples produced a stratum of ∼100 µm thickness within seven days and the cells appeared to populate the scaffold throughout. In contrast, the fibroblast layer only reached a thickness of ∼30 µm and the cells remain localized on the surface of the construct even following 14 days of culture (data not shown).

Figure 2. (A) Aerial view. (B) Lateral view scanning electron microscopy (SEM) images of individual layers of microfibre-based scaffolds with or without keratinocytes/fibroblasts. Cells were seeded and cultured (A–L interface; at 37 °C and 5% (v/v) CO2) on the appropriate scaffolds for seven days before being fixed, 1% osmium tetraoxide treated and mounted onto SEM stubs. Samples were gold coated (25 nm layer) before being examined using a Philips XL-20 SEM unit operating at an accelerating voltage of 20 kV and at the corresponding magnifications. Red arrows correspond to areas of fibroblast and keratinocyte localization.
Download figure:
Standard image High-resolution imagemDCs were successfully incorporated within a 4% agarose–fibronectin gel layer. CD11c, CD54, CD83, CD86, and HLA-DR expression and the ability to uptake FITC-dextran (i.e. endocytosis) confirmed that the cells maintained their immature phenotype and functionality throughout the culture period within this matrix following their recovery as described in section 2 (data not shown). Importantly, the mDCs were homogenously distributed within the matrix and time-lapse imaging demonstrated that they were viable and able to migrate both vertically and horizontally for up to five days (figure 3). On day 5, the majority of mDCs had migrated from the agarose layer and appeared in the supernatant. Cells in the supernatant maintained greater than 90% viability (data not shown).

Figure 3. Incorporation and migration of mDCs within 4% agarose–fibronectin gel insert. Confirmation of the mDCs incorporation within the gel was achieved using standard histology techniques as described in section 2: the 8 µm section stained using 0.25% (w/v) May-Grunwald (in methanol) and 0.4% (w/v) Giemsa stains (in methanol) prior to imaging with a Nikon SM21500 microscope. (A) mDCs can be seen as small dark spots within the gel matrix (red arrow) with the (insert) depicting an aerial view of the gel matrix under ×10 magnification. (B(i)–(vi)) Composite numbered images derived from a brightfield time-lapse movie of mDCs incorporated within the 4% agarose gel and cultured for five days at 37 °C and 5% (v/v) CO2. Images document horizontal movement of specific mDCs (within red circle) and vertical movement (ghosting of cell, i.e. moving in/out of focus) from the region of interest. Each panel is corresponds to ∼24 h time point.
Download figure:
Standard image High-resolution imageThus, 3D models consisting of keratinocytes and fibroblasts, with or without an agarose–fibronectin gel layer insert, were constructed and used to assess structural integrity and barrier formation. Histological assessment of sectioned samples (8 µm) was achieved using H&E staining followed by specific staining for proliferation markers and key dermal structural proteins such as Ki67, involucrin, pancytokeratin, cytokeratin-10 and cytokeratin-14. It is important to note that keratinocytes were contained within a microfibre scaffold, the fibres of which were dissolved by the solvents used in standard histological processing. This resulted in an atypical appearance of 'ghosting' observed for H&E and immunolabelled histology. With this in mind, it can be seen that although both model constructs (i.e. with or without agarose–fibronectin gel) demonstrated positive staining for all aforementioned markers, with the keratinocyte organization more evident in samples where the agarose–fibronectin gel layer was present during the seven-day culture period (figures 4(A)–(D)). At this time point, Ki67 was expressed by the nuclei of basal keratinocytes, with a negative expression in keratinocytes in the upper layers. However, by day 14 no expression of Ki67 was observed in any of the keratinocyte layers. Similarly, the differentiation marker cytokeratin-10 was observed at day 7 in the uppermost layer of keratinocytes with negative staining in the basal layers, but by day 14 uniform expression across basal and upper layers was observed. Cytokeratin-14, a basal epithelial cell marker, was expressed at day 7 by more basally-located keratinocytes, whereas by day 14 little expression was seen. Thus, keratinocytes appeared to have terminally differentiated by day 14 and in the presence of the agarose–fibronectin gel layer, the presence of which appeared to support better epithelial formation.

Figure 4. Histological analyses of epidermal layer following culture with and without the agarose–fibronectin gel layer insert. Samples were cultured for one week and two weeks at an A–L interface (at 37 °C and 5% (v/v) CO2) before being processed (8 µm sections) using standard IHC staining protocols as described in section 2. (A) Control samples with no 4% agarose–fibronectin gel layer; (B) Samples with 4% agarose–fibronectin gel layer—1 week; (C) Sample with 4% agarose–fibronectin gel layer—2 weeks; (D) High magnification of markers for samples grown in 4% agarose–fibronectin at 1 and 2 weeks.
Download figure:
Standard image High-resolution imageConfocal and brightfield microscopy were used to assess barrier formation and samples were compared against tissue-engineered skin (see section 2) (Chakrabarty et al 1999, Smith et al 2010). Z-stack reconstruction of 3D model with agarose–fibronectin gel was made, which demonstrated properties of epithelial organization. This was evident by a complete coverage of the upper scaffold when labelled for pancytokeratin, which was expressed further and inter-dispersed by more deeply located keratinocytes (figures 5(A)–(B)). On the bottom scaffold, the presence of fibroblasts within a dense network of actin fibres was seen (figure 5(C)). Collagen production by the keratinocytes (with a confirmed viability assessment) was maintained following culture within the 3D co-culture construct as evidenced by picosirius red positive staining. In addition the method used would identify ECM proteins, plus intermediate filament proteins such as keratin, and hence the strong positive stain from the top layer containing keratinocytes is of note (figure 6). Barrier formation and integrity were further characterized using transepithelial impedance measurements (figure 7). Samples were investigated under wet and dry conditions. The impedance technique relies on the presence of water and a major difference was observed between all four samples when measured wet versus dry. The highest wet impedance data were recorded for TE skin and the 3D model. Interestingly, donor skin gave a lower value to that of these samples and was similar to that of the wet scaffold alone. We conclude that this was due to the TE skin and 3D model samples being 'alive' and able to actively maintain a barrier. The donor skin in contrast was an excised sample and the time between retrieval and analysis was 24 h. Consequently the cellular integrity would have started to decline. On the basis of these results, the seven-day culture period sample (at an A–L interface) was selected for functional stimulation studies.
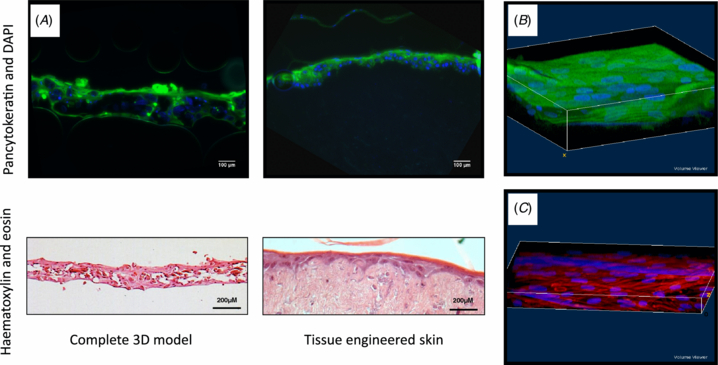
Figure 5. Structural integrity of 3D cell model construct. (A) Confocal and H&E histology was used to assess the structural integrity of the 3D co-culture model following a seven-day culture period (A–L interface; at 37 °C and 5% (v/v) CO2). For histology, tissue-engineered skin was used based on human allodermis. 8 µm section samples were stained using pancytokeratin (green) and DAPI (blue) before being viewed using a Zeiss LSM510 META confocal microscope or, H&E stained and viewed using a Leica DM-IRB brightfield microscope. Reconstructed Z-stack confocal images of the 3D model scaffolds with (B) upper layer of keratinocytes stained with pancytokeratin (green) and DAPI (blue), and (C) bottom layer of fibroblasts stained for phalloidin-TRITC (red) and DAPI (blue)
Download figure:
Standard image High-resolution image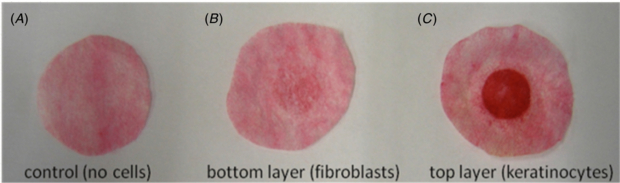
Figure 6. Total collagen deposition within individual scaffold layers/cell populations. Samples were cultured for one week (A–L interface; at 37 °C and 5% (v/v) CO2) before being dismantled and then stained using 0.1% (w/v) Sirius Red in picric acid (18 h, room temperature). Images representative of three independent sample model constructs.
Download figure:
Standard image High-resolution image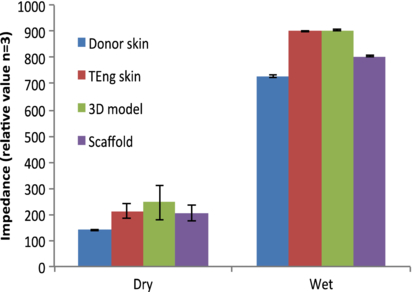
Figure 7. Transepithelial skin impedance. Electrical impedance measurements for human donor skin, tissue engineered skin (i.e. de-epidermalized dermis incorporating keratinocytes and fibroblasts), a cell-free scaffold and the 3D model construct were assessed under wet and dry conditions using a Nova Technologies DPM9003 electrode according to the manufacturer's instructions. Measurements were taken after a steady state reading was achieved (10 s) following initial electrode contact and results are the mean values ±SD from three independent experiments.
Download figure:
Standard image High-resolution image3.3. Model stimulation and cell migration
Stimulation of the complete 3D co-culture model was achieved using 2 µM DNCB which was delivered by the direct addition to the top layer of the construct (keratinocytes) in a 20 µl volume. Following stimulation, parallel samples of the model were processed for imaging (to study cell migration) and the recovered mDCs (from both the supernatant and agarose–fibronectin gel layer) were subjected to phenotype and cytokine expression (ELISA-based) analyses. Movement of the mDCs into the scaffold layers was characterized by live cell fluorescence imaging (confocal microscopy) (figure 8). The number of labelled cells, within five random fields of vision was assessed following 24 h stimulation with 2 µM or 10 µM DNCB (table 2). It was observed that mDCs migration between the scaffold layers occurred for all sample conditions but, following stimulation with DNCB, a greater number of mDCs moved towards the bottom scaffold (i.e. fibroblast layer) in agreement with observations reported in the literature (Ouwehand et al 2008, 2010).
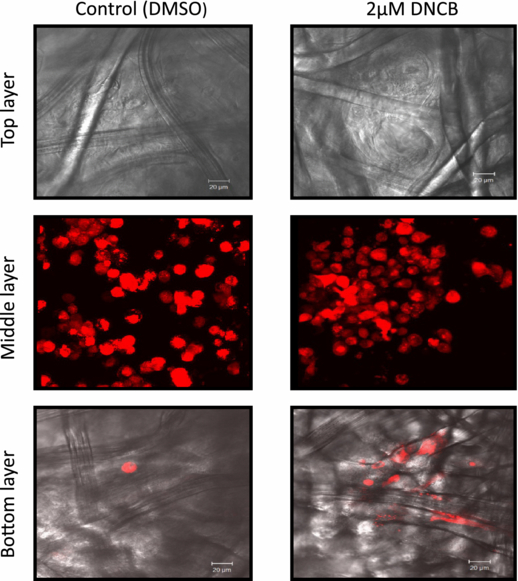
Figure 8. mDCs localization within the 3D construct following stimulation with 2 µM DNCB. Live cell fluorescence imaging (Zeiss LSM510 META confocal microscope) was used to assess the migration of mDCs following 24 h stimulation with 2 µM DNCB between the different scaffold layers. Images are the representative samples from five random fields of vision with the corresponding cell populations labelled with different contrasting agents: keratinocytes, Cell Tracker Green and DAPI; mDCs, Cell Tracker Red; fibroblasts, DAPI-only as described in section 2.
Download figure:
Standard image High-resolution imageTable 2. Summary of the number of mDCs present in the scaffold layers following stimulation with 2 and 10 µM DNCB for 24 h (37 °C and 5% CO2). Sample images were selected from a random field of vision and viewed using confocal microscopy. Control = no treatment; (T) = top layer; (B) = bottom layer.
| Control (T) | Control (B) | DMSO (T) | DMSO (B) | 2 µM DNCB (T) | 2 µM DNCB (B) | 10 µM DNCB (T) | 10 µM DNCB (B) | |
|---|---|---|---|---|---|---|---|---|
| Number of cells | 3 | 5 | 1 | 2 | 0 | 14 | 1 | 14 |
| Number of images | 5 | 4 | 3 | 3 | 3 | 6 | 3 | 5 |
| Av. number of cells/0.21 mm2 | 0.6 | 1.25 | 0.33 | 0.67 | 0 | 2.3 | 0.33 | 2.8 |
3.4. Cytokine production in response to DNCB in 2D and 3D model
Expression of IL-1α, IL-6 and IL-8 were measured by ELISA in the 3D model following addition of 2 µM DNCB to the upper epithelial surface for 24 h. A standard irritant (10−4M SDS) was also included in the experiment for comparison. No significant differences were observed for either DNCB or SDS-stimulated samples versus the un-stimulated or DMSO stimulated control samples (figure 9(a)). In addition, IL-1α, IL-6 and IL-8 were also measured in 2D cultures for comparison with the 3D culture data. Here 2 µM DNCB or 10−4M SDS were added to human keratinocytes, cultured in 12 well plates, for 24 h and the conditioned media removed for analyses. Furthermore, 2D cultures of dermal fibroblasts were stimulated with keratinocyte-conditioned media (see above) for 24 h and the presence of cytokines analysed by ELISA. No significant increase in IL-1α, IL-6 or IL-8 was observed when 2 µM DNCB was added to keratinocytes directly or to fibroblasts indirectly (via the DNCB-stimulated keratinocyte conditioned medium) (figure 9(b)). However, a significant increase in IL-1α production was observed when 10−4M SDS was added to keratinocytes in 2D culture (p = 0.0012) and a further significant increase in IL-6 was observed when keratinocyte conditioned medium (containing 10−4M SDS) was added to fibroblasts (p = 0.0019). No increase in IL-8 was observed under any condition. An explanation of why IL-1α should vary in the models was investigated in regards to the age and differentiation of the keratinocytes in culture. Thus, keratinocytes were either cultured until 80–90% confluence so that cells were proliferative, or for 3–5 days post confluence to allow cells to form a multi-layered sample. They were then incubated with 10−4 M SDS in serum-free DMEM for 24 h, medium collected and IL-1α measured. When corrected for total protein it was found that the subconfluent keratinocytes produced more IL-1α compared to the older multi-layered sample.
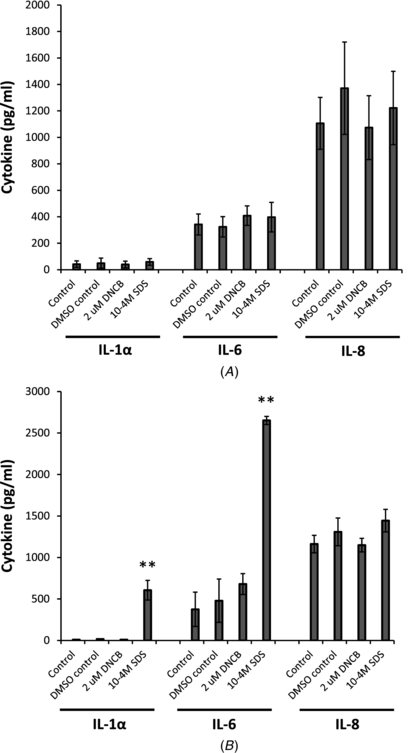
Figure 9. IL-1α, IL-6 and IL-8 expression in culture models following direct stimulation with 2 µM DNCB or 10−4M SDS. (A) Following seven-day culture (A–L interface; at 37 °C and 5% (v/v) CO2), the complete 3D model was stimulated for 24 h with removal of conditioned medium for analysis by ELISA (n = 4 DNCB; n = 2 SDS), (B) human keratinocytes and fibroblasts cultured separately in 2D. Following seven days in 2D culture, keratinocytes were stimulated for 24 h with removal of conditioned medium for IL-1α analysis by ELISA. Keratinocyte-conditioned medium was in turn added to human dermal fibroblasts in 2D culture for 24 h, with detection of IL-6 and IL-8 thereafter in conditioned medium by ELISA (n = 4 DNCB; n = 2 SDS; **p < 0.01)
Download figure:
Standard image High-resolution imageThe surface phenotype of mDCs upon stimulation with DNCB was then investigated. Cells collected from the supernatant or retrieved from the agarose–fibronectin layer were examined for lineage marker (CD11c) expression to ensure that they were of dendritic-cell lineage and also to minimize inclusion of any gel (or other cellular) debris. The expression levels of CD86 and HLA-DR on the cells recovered from the DNCB stimulated models (mDCs-only or complete three cell type model) after 24 h is summarized in figures 11(A) and (B), respectively. In addition, the insert in figure 11(A) compares CD86 expression between a 2D mDCs-only culture (i.e. on tissue culture plastic and in the presence of fibronectin) against a 3D mDCs-only culture (i.e. within an agarose–fibronectin gel). Significant upregulation of CD86 can be seen to occur in the mDCs (recovered from the complete 3D model) following stimulation with DNCB compared to the mDCs-only control samples (p < 0.001). Expression of HLA-DR was also significantly upregulated (p < 0.001) following stimulation with DNCB (figure 11(B)).
4. Discussion
There is an urgent need for the development of a simple, cost-effective and physiologically relevant in vitro model of human skin. Although several models currently exist, most of them concentrate on a single cell type only and lack immunocompetency. In this study we describe the development and initial characterization of a novel immunocompetent 3D co-culture model. Importantly, the design of this model is amenable to interactive control and monitoring of cell migration/activation and ideally suited to studies of mechanisms of skin sensitization.
The first step in development of the 3D model was seeding of primary human keratinocytes and dermal fibroblast to a modified commercially available microfibre-based scaffold. SEM images showed the presence of ECM and cells covering and permeating throughout the structural pores of scaffolds which are characteristic of cell growth and differentiation. This is in agreement with our previous published work that demonstrated similar scaffold material is conducive to the viability and proliferation of keratinocytes and fibroblasts during culture (Sun et al 2006a, 2005b). In addition, another important advantage of using such a scaffold is that it permits raising the cells to an A–L interface, ensuring correct differentiation and strata formation during the extended culture period (Poumay and Coquette 2007, Sun et al 2007, 2006a, 2005a, 2005b,). To facilitate construction of the model we performed pre-treatment of the scaffolds using acrylic acid plasma polymerization. This process allows a faster and enhanced attachment of cells without affecting any biological characteristics (Eves et al 2005, Higham et al 2003, Haddow et al 1999). Moreover, previous work within our group has documented that the paracrine signalling between keratinocytes and fibroblasts plays an important role in the optimal cell self-organization as well as in response to pro-inflammatory stimuli (Cònton et al 2010, Sun et al 2007, 2006b, Smith-Thomas et al 2001). Therefore, to maintain the stromal-epithelial interdependency inclusion of fibroblasts into the model was through to be crucial (Werner et al 2007, Nolte et al 2008). These 3D 'layers' of keratinocytes and fibroblasts were then used for the construction of the immunocompetent model.
mDCs can readily be generated in the laboratory and have been extensively investigated over the past two decades (Gluckman et al 1997, Zhou and Tedder 1996, Sallusto and Lanzavecchia 1994). This includes characterization of their responses (mostly in single cell 2D cultures) to chemical sensitizers and reported to be comparable to those of Langerhans cells (Tuschl and Kovac 2001, Rustemeyer et al 2003, De Smedt et al 2002). Although other significant immunological cells exists (e.g. mast cells) (Bischoff 2007) and correct biological mimicry important, the aim of this work was to ultimately develop a simple and easy-to-construct model for drug screening. Thus, for the 'immune layer' of our 3D model we chose to work with mDCs that were encapsulated within a permeable agarose–fibronectin gel, and subsequently sandwiched between keratinocyte and fibroblast cell layers. The agarose layer provided a convenient means of incorporating and maintaining a defined number of mDCs within the 3D model, and equally importantly served as a platform for delivering a key ECM protein (i.e. fibronectin). Previous research within our group demonstrated that mDCs that are cultured in the presence of fibronectin maintain a more immature phenotype, express higher levels of endocytic receptors and demonstrate a superior ability to sample the microenvironment and induce T cell activation (García-Nieto et al 2010). Interestingly, fibronectin has also been extensively implicated in cell attachment (Pankov and Yamada 2002, Freedberg et al 2001, Ruoslahti and Pierschbacher 1987, Hynes and Yamada 1982) and, in particular, associated with the onset of terminal differentiation in keratinocytes (Clark et al 1985). Therefore, the presence of fibronectin within the agarose gel potentially provides several advantages of this construct over existing models.
To this end, a defined cell number ratio of (5×10⁵ keratinocytes, 1.5×10⁵ fibroblasts and 3×10⁴ mDCs) was used throughout model development to ensure relevance to an in vivo environment (Facy et al 2005, Schempp et al 2000). Characterization of the keratinocyte layer was also performed by H&E staining as Ki-67 expression is reported to be only associated with cell proliferation (Scholzen and Gerdes 2000). Interestingly, differentiation and structural integrity/barrier formation of the model was significantly enhanced by the presence of the agarose–fibronectin layer as evidenced by a more localized, higher and more rapid expression of key structural proteins such as the collagens, cytokeratins and involucrin compared with a fibronectin-lacking model. These proteins have been widely reported to be the hallmarks of an organized and stratified epithelia as well as being involved in the correct formation of a keratinocyte cornified envelope (Schweizer et al 2006, Eckert et al 2004). Barrier formation and integrity was further investigated by measuring the skin impedance. This data suggested that barrier properties of the 3D model was comparable to tissue-engineered skin and was also broadly in line with the properties of native skin. Whilst higher skin impedance measurements are generally indicative of confluent cell layers with functional tight junctions as well as formation of a multi-layer stratification (van der Valk et al 2005, 1990, Narai et al 1997), it is also worth pointing out that the level of impedance signal may be influenced by water content derived from the presence of the agarose gel, age of the (donor) samples/cells or, the sampling methodology and/or location (Johnsen et al 2009, Potts et al 1984). Accordingly high water content of agarose gel in the 3D skin model could have contributed to the high impendence readings.
DNCB, a widely used sensitizer, was exploited throughout this study due to its extensive cell-response documentation in the literature (Sakaguchi et al 2009, Hooyberghs et al 2008, Azam et al 2006, Fentem et al 2001). However, an optimal DNCB concentration was required that not only induced a response within the 3D model but more importantly did not infer toxicity on the individual cell populations involved. Using a combination of cell viability assays (MTT/MTS activity) and microscopy, it was found that cells remained viable (>90%) at DNCB concentration of <3 µM, <10 µM and <50 µM for the keratinocytes, fibroblasts and mDCs, respectively, within a 24 h culture period. Therefore, to avoid compromising cell viability, the 3D model was stimulated with 2 µM of DNCB in subsequent experiments. To simulate the physiological condition for chemical exposure the DNCB was added to the upper keratinocyte layer so that it was able to permeate through the different strata layers as expected in vivo without being diluted out in the culture medium or come in contact with other cell types within the 3D model. Thus, changes in the expression of key pro-inflammatory cytokines were documented and compared with the corresponding responses in a 2D single cell or co-cultures. Interestingly, our data showed that addition of DNCB or SDS to the upper surface of the 3D model did not significantly elevate IL-1α, IL-6 or IL-8 levels compared to control DMSO or un-stimulated cultures (figures 9(A) and (B)). To explore the difference in response between the 3D model and cells in 2D culture, we investigated the potential role of keratinocytes 'age' and their differentiation status. This data demonstrated that keratinocytes (cultured to subconfluent levels) remained more responsive to stimulation with SDS compared to heavily confluent multi-layered keratinocytes (grown 3–5 days post full confluency) (figure 10). As such, the lack of cytokine response in the 3D model could potentially be contributed to the differentiated status/phenotype of the keratinocytes. Intriguingly, our data indicate that stimulation with 2 µM DNCB leads to a 5–10 fold higher expression of CD86 and HLA-DR by mDCs within the 3D model compared to a single culture (in agarose–fibronectin gel) of these cells and in the absence of keratinocyte and fibroblast layers (p < 0.01) (figures 11(A) and (B)). Whilst the exact mechanism of such differences in mDCs responses are yet to be elucidated, they are most likely due to paracrine cross-talk between mDCs, keratinocytes and fibroblasts.
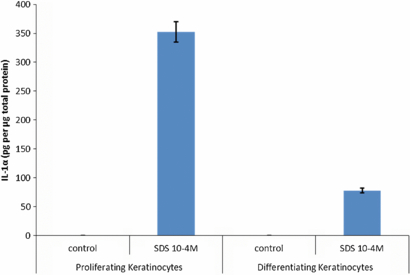
Figure 10. Keratinocyte phenotype is associated with IL-1α release in response to SDS. Keratinocytes were either cultured until 80–90% confluence so that cells were proliferative, or for 3–5 days post confluence to allow cells to form a multi-layered more differentiated sample. Keratinocytes were washed three times with serum-free DMEM and then incubated with 10−4 M SDS (in serum-free DMEM) for 24 h (serum-free DMEM was the control). Following 24 h incubation, medium was collected and IL-1α measured by ELISA. To determine total protein a BCA protein assay of the remaining cell lysate was performed and data shown as pg of IL-1α/µg total sample protein (n = 3).
Download figure:
Standard image High-resolution image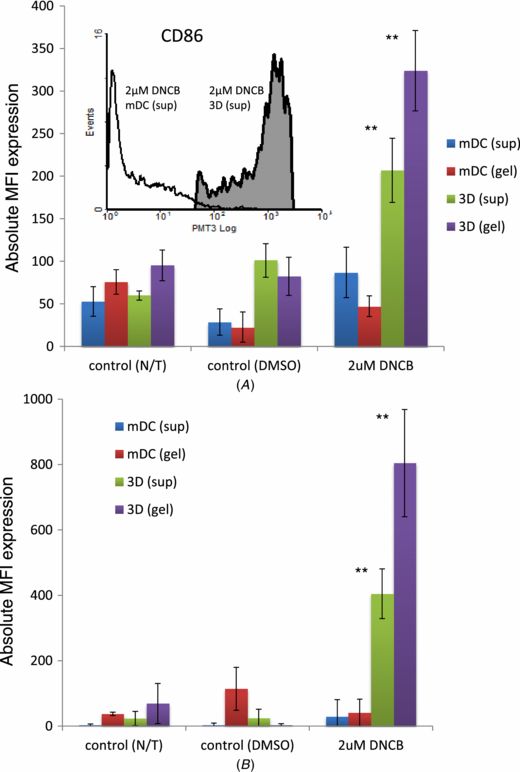
Figure 11. mDCs surface marker expression following stimulation with 2 µM or 10 µM DNCB (direct addition). Following seven-day culture (A–L interface; at 37 °C and 5% (v/v) CO2), the complete 3D model was stimulated with direct addition of 2 µM DNCB for 24 h. mDCs were then recovered from both the supernatant (sup) and the agarose gel (gel) and analysed using flow cytometry for (A) CD86 and (B) HLA-DR expression. Absolute MFI value = (MFI sample) – (MFI isotype/unstained sample). mDCs-only 3D samples (i.e. incorporated within the agarose–fibronectin gel) were used as the control (n = 3; **p < 0.01).
Download figure:
Standard image High-resolution image
5. Conclusion
Herein, we describe a novel immunocompetent three-layer model comprised of a layer of keratinocytes, a layer of fibroblasts and a central matrix of immune cells (mDCs) (cultured within an agarose–fibronectin gel). This construct has been specifically designed to be readily assembled/disassembled and allows the analyses of the different cell types localized within the scaffolds, gel or supernatant. We demonstrate that the model responds to topical application of a skin sensitizer as evidenced by the up-regulation of CD86 and HLA-DR on the mDCs. Intriguingly, these same cells produce a significantly weaker response to DNCB when in isolation. However, none of the cytokines we examined (i.e. IL-1α, IL-6 and IL-8) were up-regulated in response to DNCB or SDS stimulation and is most likely due to more differentiated nature of keratinocytes, thus leaving the search for an indicative soluble marker in this model open. We therefore conclude that the model has potential for research groups interested in the basic mechanisms of skin sensitization and may also serve as a foundation for developing future platforms for the allergenic assessment of chemicals and drugs.
Acknowledgments
The authors would like to thank Nina Lane and Dr Adrian Robbins for their useful discussions in flow cytometry analyses, Paul Cato for help with DC generation and Dr Daniel Howard for an overview of histology.
The authors have declared that no competing interests exist.