
Abstract
Three-dimensional tissue culture, and particularly spheroid models, have recently been recognized as highly relevant in drug screening, toxicity assessment and tissue engineering due to their superior complexity and heterogeneity akin to the in vivo microenvironment. However, limitations in size control, shape reproducibility and long maturation times hinder their full applicability. Here, we report a spheroid formation technique based on the magnetic aggregation of cells with internalized magnetic nanoparticles. The method yields magnetic spheroids with high sphericity and allows fine-tuning the final spheroid diameter. Moreover, cohesive spheroids can be obtained in less than 24 h. We show the proof of concept of the method using the CT26 murine colon carcinoma cell line and how different cell proliferation and invasion potentials can be attained by varying the spheroid size. Additionally, we show how the spheroid maturation impacts cell invasion and doxorubicin penetrability, highlighting the importance of this parameter in drug screening and therapeutic applications. Finally, we demonstrate the capability of the method to allow the measurement of the surface tension of spheroids, a relevant output parameter in the context of cancer cell invasion and metastasis. The method can accommodate other cell lines able to be magnetically labeled, as we demonstrate using the U-87 MG human glioblastoma cell line, and shows promise in the therapeutic screening at early time points of tissue formation, as well as in studies of drug and nanoparticle tumor penetration.
Export citation and abstract BibTeX RIS

Original content from this work may be used under the terms of the Creative Commons Attribution 4.0 license. Any further distribution of this work must maintain attribution to the author(s) and the title of the work, journal citation and DOI.
1. Introduction
The path to drug implementation involves a vigorous screening process in order to determine drug efficacy on a specific target, and it is typically first carried out in vitro before moving onto in vivo animal testing. As development costs expand further down the clinical testing pipeline, it is more economically favorable to filter out non-viable drugs as early as possible [1]. Robust in vitro testing platforms are thus highly desirable in order to reliably evaluate a potential drug and obtain similar results to those expected in its ultimate testing phase.
Until recently, the cell monolayer (2D) culture has been the model of choice in drug development due to its relatively easy implementation, low cost and reproducibility. However, such a model lacks the intrinsic and relevant properties inherent to a three-dimensional (3D) tissue construct, such as cell heterogeneity, cell-cell signaling, cell-extracellular matrix interactions, tumor growth kinetics and hypoxia [2], as well as the highly relevant factor of therapeutic drug resistance [3], that altogether resemble in vivo tissue more closely. Additionally, it is thought that the lack of these relevant physiological conditions in 2D cultures lead to a different protein expression, biodistribution of biomolecules and drug kinetics [4], and it is believed to be an important contributor to the low success rate in clinical drug screening [5]. Naturally, 3D models such as spheroids have emerged as superior representative and predictive models of in vivo events with the potential to facilitate drug advances by bridging the gap between 2D cultures and animal in vivo testing [4, 6–8].
Current methods to generate 3D cultures can be divided into scaffold-based and scaffold-free methods [9]. In the former, the cells attach to or mix into an artificial structure that mimics that of the extracellular matrix, forming a tissue as they grow. Many biocompatible materials have been proposed [3]; however, reproducibility issues, high cost and the possible interaction of the substrate with drugs in the form of absorption and adhesion hinder their applicability in drug screening [10–12]. Scaffold-free methods promote the aggregation of cells into spheroids, where no external growth substrate is needed and where cell-cell interactions are favored and cell-substrate attachment is avoided. The typical methods that have achieved these criteria involve culturing the cells under continuous stirring conditions [13, 14], enclosed in hanging drops [15] and using non-adherent substrates [16, 17], or more recently with the implementation of microfluidic devices [18, 19] and bioprinting [20–22]. More recent technological advances aim at improving experimental procedures and at offering tighter control on spheroid size, sphericity and maturation times. Moreover, spheroid models have grown in complexity, often incorporating multiple cell lines, diversifying the extracellular matrix composition or simulating tumoral vasculature, thus enhancing the amount and quality of the output data that can be obtained [23].
The use of magnetic nanoparticles for cell labeling and as drivers of cell aggregation has been successfully implemented as a novel method to facilitate and improve spheroid formation parameters. For instance, labeling of cells with magnetoferritin, a biological magnetic nanoparticle, and their subsequent culture using the standard hanging drop technique resulted in the incorporation of the magnetic nanoparticles by the spheroids with no alterations in cell viability, which could then be magnetically patterned into specific shapes [24]. Magnetic labeling can also been combined with agarose well patterning [25] and bioprinting [26] in order to obtain similar results. Furthermore, the aggregation of labeled cells into spheroids can also be driven by magnetic forces in scaffold-free configurations [27, 28], which can then be used to engineer tissue constructs [29, 30]. We have previously demonstrated a similar approach based on magnetic tips as the drivers of force to produce multicellular 3D aggregates [31], and extended their use to show the chondrogenesis potential of mesenchymal stem cell aggregates [32], as well as the aggregation of embryonic stem cells into embryoid bodies [33, 34].
Here, we build on the concept of utilizing external magnets and magnetically labeled cells by combining it with an agarose scaffold in order to obtain tumor-like spheroids from cancer cells with a tightly controlled sphericity and tunable diameters. The method is highly reproducible, and mature spheroids can be obtained in less than a day of incubation. We show how the spheroid maturation time influences cancer cell invasion as well as drug penetration. The magnetic nature of the spheroids additionally allows the monitoring of the surface tension parameter, which is relevant in cancer tumor cell cohesiveness and invasiveness. Furthermore, the methodology can accommodate other cell lines capable of magnetic nanoparticle internalization, and the experimental setup can be easily upscaled.
2. Materials and methods
2.1. Iron oxide nanoparticles
Iron oxide nanoparticles were produced by PHENIX Laboratory (UMR8234, Paris) using the standard Massart procedure of iron salts co-precipitation [35], with the resulting magnetite (Fe3O4) nanoparticles then being oxidized into maghemite (γ-Fe2O3). The magnetic nanoparticles were then stabilized in aqueous solution via citrate chelation in order to achieve electrostatic repulsion. The resulting nanoparticles possessed an average diameter of 8 nm.
2.2. Cell culture
CT26 murine colon carcinoma and U-87 MG human glioblastoma cells (ATCC®) were cultured in Dulbecco's Modified Eagle Medium (DMEM, Gibco®) supplemented with 10% fetal bovine serum (Gibco®) and 1% penicillin-streptomycin (Gibco®) and grown at 37 °C in a humidified incubator with 5% CO2. Upon reaching the desired confluence, the cells were detached with 0.05% trypsin-EDTA (Gibco®).
2.3. Magnetic cell labeling and quantification of iron uptake
The cells were labeled with a solution of magnetic nanoparticles at [Fe] = 1 mM suspended in cell medium and left to incubate overnight before detachment from the culture flasks. The iron uptake per cell was calculated through single cell magnetophoresis, as described previously [36]. Briefly, the measurement is based on the velocity of a single magnetically labeled cell as it is attracted by a known, constant magnetic gradient. The drag force of the cell Fd =3πηDν thus balances the magnetic force Fm = Mcell × gradB, yielding the magnetic moment of a single cell through equation (1):
where η is the viscosity of the carrier medium, D is the cell diameter, ν is its velocity, Mcell its magnetic moment and gradB the magnetic gradient. The Mcell value is related to the number of loaded particles per cell, from where the total iron mass per cell can be calculated.
2.4. Magnetic molding of magnetically labeled cells into spheroids
The method is based on the magnetic attraction of labeled cells towards a fixed magnet, a force which ultimately drives cell aggregation into a defined shape. Briefly, a 22.1 cm2 petri dish (TPP®) is placed on top of a network of 6 × 2 mm cylindrical neodymium magnets (Supermagnete). Then, stainless steel beads (CIMAP) with a diameter of 0.4, 0.5, 1 or 1.6 mm are placed inside the dish and fixed into position as they are attracted to the magnets. A previously heated and homogenized 2% agarose (A0576, Sigma-Aldrich) solution in phosphate buffered saline is then poured into the dish in a sufficient amount to leave the top part of the steel beads uncovered. After agarose gelation, the beads are carefully removed and a quasi-spherical mold is obtained, which ultimately defines the spheroid shape. The molds are sterilized by UV light exposure for 30 min and filled with cell medium. Then, using the network of cylindrical magnets, previously detached and concentrated labeled cells (100 000 cells µl−1) are seeded into each mold. The attraction of the cells to the magnet drives their aggregation into the spherical mold, forming an easily observable spheroid within minutes. The number of cells attracted into the mold is on average 11 400 ± 1700, 24 000 ± 6000, 106 000 ± 15 000 and 180 000 ± 22 000 for molds of 0.4, 0.5, 1 and 1.6 mm in diameter, respectively, as determined by trypsinization and cell counting of over eight spheroids for each condition. After 3 min of cell seeding, the magnets are removed. The dish is then carefully washed, filled with cell medium and then placed in the incubator to allow spheroid maturation. After overnight incubation, spheroids are removed from the agarose mold with the aid of a micropipette. For all experiments performed, spheroids were placed in plasticware coated with Anti-Adherence Rinsing Solution (07010, STEMCELL™ Technologies) to prevent adhesion, unless otherwise specified.
2.5. Hanging drop spheroid formation
After cell detachment from the culture flasks, they were counted using the standard trypan blue technique. Single drops of 30 µl of cell medium containing 5000 cells were pipetted onto the lid of a 60 cm2 tissue culture dish (TPP®), evenly separated. The lids were then inverted and placed on the dishes, each one of the latter filled with 10 ml of PBS to prevent evaporation of the drops. The hanging drops were cultured under the previously described conditions, and spheroids were collected after 2 d of incubation. The spheroids were placed in plasticware coated with Anti-Adherence Rinsing Solution (07010, STEMCELL™ Technologies) to prevent adhesion for all experiments, unless otherwise specified.
2.6. Spheroid shape and sphericity analysis
The spheroid morphology and growth was monitored using a Leica DM IL LED microscope (Leica Microsystems) coupled to a Canon EOS 50D digital single-lens reflex camera (Canon®). Images taken at the desired time points were analyzed using the ImageJ open source software for diameter and sphericity quantification. For the latter, the sphericity index (SI) was defined by equation (2) [15]:
where A is the projected area of the spheroid and P its perimeter.
2.7. Spheroid proliferation quantification
The alamarBlue™ metabolic assay (DAL1100, Invitrogen™) was used to assess the proliferative potential of single spheroids and following the vendor's standard procedure in 96-well plates. A single spheroid was measured for all instances, with an incubation time with the reagent set at 2 h, and the fluorescence was recorded with an EnSpire® Multimode Plate Reader (PerkinElmer), using a fluorescence excitation and emission wavelength of 570 and 585 nm, respectively.
2.8. Live/dead fluorescent staining and visualization
The LIVE/DEAD™ Cell Imaging Kit (R37601, Invitrogen™) was used to assess cell viability in live spheroids. Following vendor protocols, spheroids at day 3 of maturation were stained with Live Green/Dead Red staining solution in non-adherent dishes for 2 h at 37 °C in a humidified incubator with 5% CO2. Then, the staining solution was removed and the spheroids were then stained for the cell nuclei with Hoechst 33342 (H3570, Invitrogen™) at a 1:200 dilution in DMEM without phenol red (Gibco®) for 30 min at room temperature. The spheroids were then imaged using an Olympus IX81F-3 inverted microscope (Olympus®) coupled with a laser dual spinning disc unit (Yokogawa CSU-X1) and an Andor iXonEM + CDD camera (Andor™ Technology), with a 10x objective. Images were processed using ImageJ, using the Grid/Collection Stitching plugin for spheroid reconstruction.
2.9. Spheroid drug resistance and penetration visualization
Liposomal-encapsulated doxorubicin (300112S-1EA, Avanti® Polar Lipids) was selected to study drug resistance in magnetically molded spheroids due to its clinical relevancy. After 1 d of maturation, the spheroids were placed in 96-well plates at increasing doxorubicin concentrations in the range of 0.01–100 µg ml−1. Following a 72 h incubation period, the cell death percentage was evaluated using the alamarBlue™ metabolic assay following the previously described protocol used to monitor spheroid growth. 2D cell cultures at a seeding density of 25 000 per well were also prepared in parallel under similar conditions for comparison purposes. The 50% inhibition concentration (IC50) value was determined from the dose-response curves after fitting to a four parameter logistic regression model [37].
For fluorescence imaging, the spheroids were fixed in 4% paraformaldehyde in phosphate buffered saline for 1 h at room temperature after the desired incubation time with doxorubicin at 10 µg ml−1. The spheroids were then washed and embedded in optimal cutting temperature compound (361603E, VWR™) for 1 h at room temperature and shortly after frozen in 2-Methylbutane, GPR Rectapur® (VWR™) cooled with liquid nitrogen, and then stored at −20 °C. Cryosections of 20 µm were obtained from the center area of each spheroid using a Cryostat (CM3050 S, Leica Microsystems) and then mounted on slides using Fluoromont™ Aqueous Mounting Medium (F4680, Sigma-Aldrich). All samples were stored at 4 °C after gelation of the mounting medium. Imaging of doxorubicin fluorescence was performed using the confocal microscopy setup described previously, with a 60x oil immersion objective. Images were processed using ImageJ, using the Grid/Collection Stitching plugin for spheroid reconstruction.
2.10. Spheroid cell invasion
Matrigel® Basement Membrane Matrix (356234, Corning®) at 9.8 mg ml−1 of protein concentration was used to study cell invasion at the periphery of growing spheroids. Pre-chilled 96-well plates were coated with 40 µl of Matrigel following standard vendor procedures. After Matrigel gelation for 30 min at 37 °C, a single spheroid at the desired maturation time was placed in each well and allowed to grow and spread. Images at each stage of invasion were taken using the previously mentioned optical microscope setup, and image analysis to quantify the area of spread was done using ImageJ.
2.11. Surface tension measurement
Spheroids were collected after 1 d of maturation in the molds. The measurement of surface tension was either done right away (day 1) or after two more days of maturation (day 3). For the measurement, the spheroids were placed in a 37 °C thermoregulated chamber filled with Dulbecco's Modified Eagle Medium without phenol red (Gibco®). The chamber was enclosed with glass slides on two of its sides to allow for side view imaging, and at its bottom with a glass slide coated with Anti-Adherence Rinsing Solution (07010, STEMCELL™ Technologies) in order to ensure non-wetting conditions. A cylindrical neodymium permanent magnet (6 × 6 mm), generating a uniform magnetic field gradient (gradB= 170 T m−1) within a cylindric volume of 2 mm in height and 2 mm in diameter, was positioned under the spheroid, in direct contact with the bottom glass slide. Upon magnet application, the spheroids become compressed in the direction of the magnetic field gradient. The spheroid's lateral profile was then monitored with a digital camera (QICAM FAST 1394, QImaging) for 10 min until its equilibrium compressed shape was reached. This equilibrium shape is determined by the balance between magnetic forces per unit of volume, fv with fv = Mv × gradB and capillary forces (surface tension). The experimental profile of each compressed spheroid was next computed using ImageJ edge recognition, and fitted to the theoretical profile of a drop submitted to a volume force (such as gravity) derived from the Laplace law of capillarity in non-wetting conditions. The theoretical profile was obtained using Matlab's function ode45 to numerically integrate the Laplace law [38]. The corresponding fitting directly infers the macroscopic tension of the spheroid.
3. Results
3.1. Magnetic molding of tumor spheroids
Magnetic cell labeling of CT26 cells translated to an iron loading dose of 8.1 ± 2.6 pg per cell after endocytosis (figure 1(a)), as determined by single-cell magnetophoresis. The magnetic moment of each cell provided by this nanoparticle load corresponds to an average of 5.3 × 10⁻¹³ A m2, and it is the driving force for cell aggregation into magnetic spheroids.
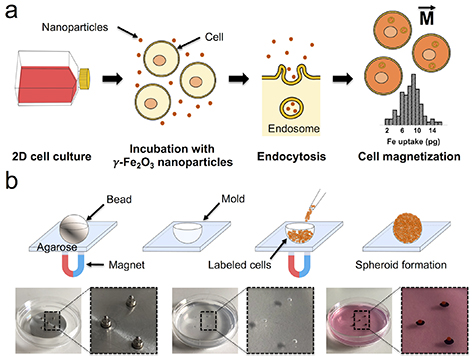
Figure 1. Cell labeling with magnetic nanoparticles and magnetic molding of tumor spheroids. (a) Cell labeling process and magnetization of cells. The cells are co-incubated with magnetic nanoparticles in 2D culture, conferring them with a magnetic moment  after endocytosis. The distribution of iron loading is shown, with an average of 8.1 ± 2.6 pg per cell, as determined by single-cell magnetophoresis (n = 100 cells analyzed). (b) For the magnetic molding procedure, a steel bead with a defined diameter is embedded in a layer of agarose and fixed in place using an array of 6 × 2 mm cylindrical neodymium magnets, leaving a spherical mold after its removal. Then, using the same external magnet setup, the magnetically labeled cells are seeded and aggregated into a spheroid as they are attracted by the magnetic field gradient created by each magnet.
Download figure:
Standard image High-resolution imageThe magnetic molding process is illustrated in figure 1(b). It is based on the preparation of an agarose mold using a steel bead fixed in place by an array of 6 × 2 mm cylindrical magnets placed below the culture dish. The diameter of the selected bead ultimately defines the spheroid diameter, thus allowing the tuning of this parameter from this very early step. Upon removal of the steel beads, and using the same array of magnets, magnetically labeled cells are seeded on top of the molds and, being attracted to the magnets, aggregate in situ and adopt the spherical shape conferred to the mold by the beads. The magnetically-driven cell aggregation takes place instantaneously, and a spheroid can be visibly observed typically within 3 min of cell seeding. This time of aggregation is similar to a centrifugation process: the magnetic field gradient gradB created by each 6 × 2 mm cylindrical magnet below each mold, in the order of 200 T m−1, translates into a volume magnetic force Mv × gradB, Mv being the cell magnetization (magnetic moment per unit of volume, in the order of 500 A m−1). The range of this volume force, around 105 N m−3, would be equivalent to 100 g, assuming the cell density close to 1.1 relative to water. Remarkably, it is in the same order of force applied under a routine cell culture centrifugation at 100–300 g, also applied for a few minutes. After cell aggregation in the molds, the magnets are removed. More importantly, mature and cohesive spheroids can be collected under 1 d of incubation within the mold.
We proceeded to show the proof of concept of the methodology by selecting a variety of steel bead sizes, and compared spheroid sphericity, average diameter and cell proliferation with the standard hanging drop technique. Figure 2(a) shows the typical spheroid morphology for an initial bead size of 0.4, 0.5 and 1 mm, as well as for hanging drop spheroids. The magnetic spheroids possess a slightly smaller initial diameter (day 1 of maturation) than that imposed by the mold, at 344 ± 18, 435 ± 15 and 820 ± 25 µm for the initial conditions of 0.4, 0.5 and 1 mm, respectively (figure 2(b)). For all magnetic molding conditions, highly spherical spheroids (SI ≥ 0.9) can be observed from day 1 and up to day 5 of culture, with negligible variability (figure 2(c)). On the other hand, the hanging drop spheroids can only attain the same consistent high level of sphericity towards their 5th day of maturation.

Figure 2. Morphology and growth characterization of spheroids obtained through magnetic molding (MM) of 0.4, 0.5 and 1 mm initial size and compared to those obtained with the hanging drop (HD) method. (a) Spheroid typical morphology at maturation days 1, 2 and 4 (MM) and at days 2, 3 and 4 (HD). (b) and (c) Spheroid average diameter and sphericity, respectively. Data represent mean ± SEM (n = 3).
Download figure:
Standard image High-resolution image3.2. Spheroid proliferation and viability
Quantitative cell proliferation data was obtained using the alamarBlue™ metabolic assay. Magnetic spheroids of sizes of 0.4, 0.5, 1 and 1.6 mm, as well as hanging drop ones, were prepared in order to assess the correlation between the alamarBlue™ fluorescent signal of a single spheroid and the total number of cells within it, after its dissociation with trypsin. The correlation curve is shown in figure 3(a). Remarkably, the proliferation data are perfectly comparative for each spheroid size and/or condition, demonstrating the robustness of the assay in providing a reliable estimation of the number of cells within a spheroid. Figure 3(b) shows the cell proliferation in 0.4, 0.5 and 1 mm magnetic spheroids, as well as hanging drop ones, in relation to their maturation in days. For all conditions, the spheroids were still in a proliferative state up to day 5 of maturation, with proliferative rates correlating to spheroid size. Interestingly, the proliferation rate of CT26 cells with the hanging drop method can be matched by that of the magnetically molded spheroids with a diameter of 0.4–0.5 mm of initial mold size.
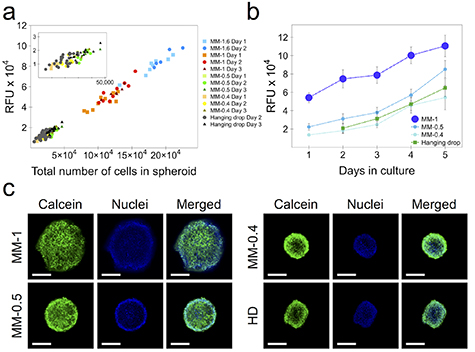
Figure 3. Spheroid proliferation and viability. (a) Correlation of alamarBlue™ fluorescent signal of single spheroids and the total number of cells counted after trypsinization. Each point corresponds to one spheroid, for 0.4, 0.5, 1 and 1.6 mm magnetic molding (MM) ones, as well as those made by hanging drop (HD). (b) Spheroid proliferation over 5 d of maturation. Data represent mean ± SEM (n = 3). RFU = relative fluorescent units, as per alamarBlue™ metabolic assay. (c) Live/dead fluorescent staining of spheroids at day 3 of maturation. The green fluorescent signal corresponds to Live Green (calcein), whereas the blue one is that of cell nuclei (Hoechst 33 342). No Dead Red signal was observed.
Download figure:
Standard image High-resolution imageThe viability of the magnetic molding spheroids was additionally characterized using the LIVE/DEAD™ Cell Imaging Kit. Spheroids at day 3 of maturation were stained with the Live Green/Dead Red staining solution, as well as with Hoechst 33 342 dye to observe the cell nuclei, and then imaged by confocal microscopy. Characteristic images of the fluorescent distribution for each spheroid condition is shown in figure 3(c). Only the Live Green (calcein) signal was observed, homogeneously throughout the spheroid for all conditions. However, it should be noted that the imaging corresponds to the outer and first layers of cells within the spheroid, as it remains a difficult prospect to image a spheroid's core in live settings, especially ones with the diameters shown here.
Finally, we demonstrate that the magnetic molding method can accommodate other cell lines by using the U-87 MG glioblastoma cell line. Figure 4 shows the resulting spheroids obtained from 1 mm molds, featuring a very similar diameter and cell proliferation profiles to those of CT26, highlighting the robustness of the method.

Figure 4. Magnetic molding of U-87 MG human glioblastoma cells at 1 mm of initial size. Plot shows spheroid average diameter and proliferation over 4 d of culture. Data represent mean ± SD (n = 30 and n = 15 spheroids analyzed for diameter and proliferation, respectively). Scale bars = 250 µm.
Download figure:
Standard image High-resolution image3.3. Visualization of drug penetration and cytotoxicity assessment
We investigated the cell penetration and distribution of liposomal-encapsulated doxorubicin (DOX) in magnetically molded spheroids of 1 mm initial size. Figure 5(a) shows the fluorescent intensity of DOX of a typical cross-section at the center of the spheroid, as determined by confocal microscopy imaging. Spheroid maturation times of 4 h, 1 d and 3 d were analyzed at different DOX incubation times. The maturation time point of 4 h was chosen for its relevancy as a tumoral model of early maturation and thus of less cohesiveness. For this early maturation condition, DOX penetration can be observed after 2 h of incubation throughout the area of the spheroid in a discrete manner, with full cellular penetration taking place. The drug penetration increases considerably after 1 d of incubation, and reaching higher levels after 3 d. For spheroids at day 1 of maturation, there is little to no drug penetration after 2 h incubation with DOX. However, at 1 d of incubation drug penetration can be observed at the periphery of the spheroid, at approximately 50 µm from its border periphery, with a significant increase after 3 d of incubation. Lastly, spheroids at day 3 of maturation saw no DOX penetration after 2 h of incubation, but some drug fluorescent signal was observed after 1 d of incubation all around the periphery of the spheroid, at 50 µm in depth from its border. We then observed the penetration of DOX in hanging drop spheroids at two days of maturation and incubated with the drug for 1 d (figure 5(b)). Similarly to the longer DOX incubation times in the 1 mm magnetic spheroids, a high DOX fluorescent signal was detected throughout the entire hanging drop spheroid. This can be explained by the spheroid cohesiveness: whereas the magnetic one is well into its maturation state, the hanging drop spheroid has barely achieved a cohesive state by this maturation time, which translates to a more uniform drug penetration profile.
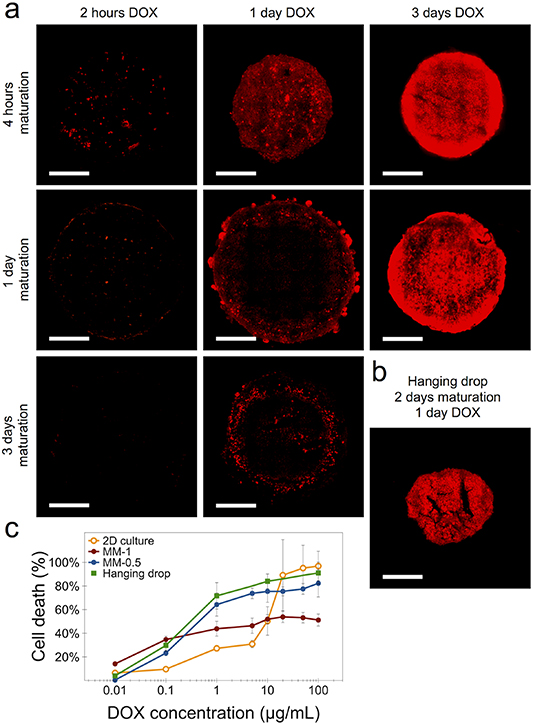
Figure 5. Doxorubicin penetration and toxicity in magnetically molded (MM) spheroids. (a) Fluorescence intensity distribution of doxorubicin for spheroids of 1 mm initial size and incubated with 10 µg ml−1 of liposomal doxorubicin for 2 h, 1 d and 3 d. The incubation with the drug was initiated at spheroid maturation times of 4 h, 1 d and 3 d. (b) Doxorubicin distribution in hanging drop sppheroids at day 2 of maturation and incubated for 1 d with the drug. Scale bars = 200 µm. (c) Doxorubicin response curves for cells in 2D culture, for magnetic spheroids of 0.5 mm and 1 mm of initial size and matured for 1 d, and for hanging drop spheroids matured for 2 d. For all conditions, doxorubicin incubation was of 3 d, and cell death % was determined with the alamarBlue™ metabolic assay. Data represent mean ± SEM (n = 3).
Download figure:
Standard image High-resolution imageThe alamarBlue™ metabolic assay was used to determine DOX cytotoxicity in CT26 cells cultured in standard 2D conditions, in magnetic spheroids of 0.5 mm and 1 mm of initial size at day 1 of maturation, and in hanging drop spheroids at day 2 of maturation (figure 5(c)). The IC50 value was calculated to be at 7.4 µg ml−1 (13.6 µM) for CT26 cells cultured in 2D, in the same range as reported elsewhere [39]. After 3 d of DOX incubation, and for the three spheroid types, the cells respond better to the treatment at low doses than cells cultured in 2D, but the effect is not amplified at higher doses, with the spheroids' metabolic activity saturating at 40% and 60% for the 0.5 mm and 1 mm spheroids, respectively. The hanging drop spheroids' drug response is very similar, and almost parallel, to that of the 0.5 mm magnetic ones. It should be remarked that the magnetic spheroids were placed in the DOX drug at day 1 of maturation, whereas the hanging drop ones could only be collected and placed in the drug after 2 d of maturation. The cells in the 3D spheroid configuration thus show a higher resistance to DOX compared to those in 2D culture, with the 1 mm spheroids showing the highest one. This indicates a limited penetration of the drug towards the spheroid core, with an observable increase in 0.5 mm spheroids.
3.4. Spheroid cell invasion into Matrigel
We next evaluated the cell invasion potential of magnetically molded spheroids in order to further characterize the suitability of the method for assessing cell invasiveness potential as an experimental output. We selected Matrigel as a culture basement membrane matrix for this purpose.
Magnetic spheroids of 0.4, 0.5 and 1 mm initial size were placed on Matrigel after 4 h, 1 d and 2 d of maturation, and their area of growth and cell invasion into the layer of Matrigel matrix was quantified. Spheroids formed through the hanging drop method are also shown along with the 2 d of maturation condition for comparison purposes. The 4 h maturation time was chosen to show the advantage of the magnetic attraction ability of the magnetic molding method to produce cohesive spheroids at early incubation time points. This particular experimental setup shows how the cell proliferation under this early maturation condition compares to that of cell invasion studies where longer maturation times are used, a limitation which is imposed by the typical spheroid formation methods.
Spheroids formed through the magnetic molding method and cultured on Matrigel at 4 h of maturation (figure 6(a)) show a similar invasion area of spread compared to that at day 1 (figure 6(b)) and day 2 (figure 6(c)). Magnetic spheroids of the two smaller sizes appear to reach an overall invasion area as high as that of 1 mm ones under all three maturation conditions. Akin to the parameters of spheroid diameter and proliferation, the cell invasion potential of CT26 hanging drop spheroids (day 2 of maturation) shows a similar pattern to that of the magnetically formed spheroids in the lower range of sizes. Remarkably, all spheroids present similar invasion areas over a long term, one week of culture.
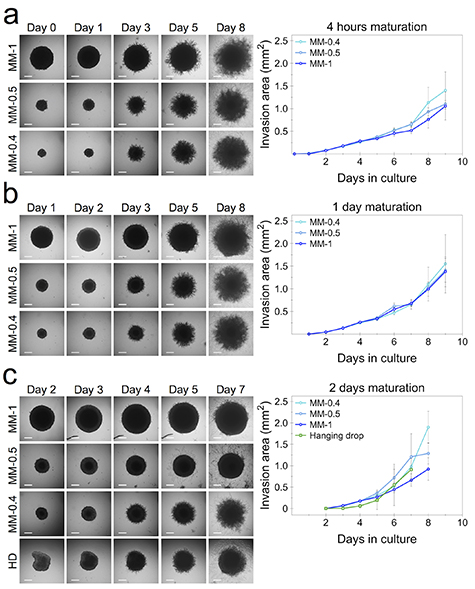
Figure 6. Spheroid cell invasion into Matrigel. Magnetically molded (MM) spheroids of 0.4, 0.5 and 1 mm initial size were placed in Matrigel basement membrane matrix after (a) 4 h, (b) 1 d and (c) 2 d of maturation, with the last condition also compared with the hanging drop (HD) method. Plots show the invasion area into Matrigel over one week of culture. Data represent mean ± SD (n = 5 spheroids analyzed for each condition). Scale bars = 150 µm.
Download figure:
Standard image High-resolution image3.5. Spheroid surface tension: an original magnetic-derived output parameter
The spheroid's magnetic moment, created due to the magnetic nanoparticle loading, provides it with magnetic responsiveness and allows for its remote stimulation by external magnets. One direct application is the measurement of the surface tension, mediated by magnetic flattening. Indeed, by placing a spheroid on top of a 6 × 6 mm cylindrical magnet developing a magnetic field gradient of gradB= 170 T m−1, the spheroid experiences a volume force created by its magnetization (magnetic moment per unit of volume Mv), which was found to be in the same range for CT26 and U-87 MG spheroids, at 362 ± 48 A m−1 and 414 ± 45 A m−1, respectively. This magnetic volume force can be seen as super-gravity, in the range of 100 g, which compresses the magnetic spheroid in the z-direction and ultimately reaching an equilibrium shape that can be fitted to capillary Laplace equations. From this equilibrium profile of a spheroid in super-gravity, the macroscopic surface tension can be calculated. This parameter, signature of tumor cohesiveness [40], is generally unreachable for typical non-magnetic spheroids without the use of more complicated setups such as micropipettes [41] or microplate devices [42].
Figure 7 shows the surface tension measurement for spheroids made from the two tested cancer cell lines: CT26 colon carcinoma and U-87 MG glioblastoma. Figure 5(a) shows the spheroid lateral profile for CT26 under control conditions and when placed on top of the magnet, at day 1 and 3 of maturation. The surface tension value increased almost two-fold from day 1 to day 3, at 8.8 ± 1.6 and 16 ± 1.8 mN m−1, respectively, indicating a tightening of cell interactions and thus an increase in spheroid cohesiveness within this timeframe (figure 7(b)). U87-MG spheroids show a similar flattened profile when placed on top of the magnet (figure 7(c)). The surface tension at day 1 was about half the one of CT26, with a value at 4.9 ± 1 mN m−1, and its increase towards day 3 was more than 2-fold, to 12.4 ± 1.8 mN m−1 (figure 7(d)).

Figure 7. Surface tension measurement in magnetic spheroids. Spheroids of 1 mm initial size were placed on top of a 6 × 6 mm cylindrical magnet and showcased a flattened profile due to the experienced magnetic force. The profile was then fitted to capillary Laplace equations to obtain the surface tension parameter. (a) Lateral profile of control and flattened CT26 spheroids at day 1 and 3. (b) Surface tension of CT26 spheroids. (c) Lateral profile of U-87 MG spheroids under the same conditions. (d) Surface tension of U-87 MG spheroids. Data represent mean ± SEM (n = 4–6 spheroids analyzed depending on the condition). Scale bars = 200 µm.
Download figure:
Standard image High-resolution image
4. Discussion
The need for a thorough understanding of the underlying mechanisms governing cancer maturation, invasion and metastasis, as well as the interplay of these with potential treatment agents has driven the development of in vitro tumoral models that aim to provide platforms to study such variables. Technological advances have allowed methods to grow in complexity, with different models providing tools for investigating specific output parameters, such as angiogenesis, intravasation, extravasation and immune response, among others [23]. Nevertheless, the typical spheroid formation methodologies retain some limitations, usually in the form of one of or a combination of spheroid shape and size control, long maturation times, reproducibility, requirement of complex equipment and scalability. The long maturation time of spheroids is relevant in drug screening, as it limits the timeframe in the assessment of drug incorporation to conditions where the tumoral cells have already established a high cell-cell adhesion and thus critical data regarding early tumor formation is lost.
The magnetic molding method introduced in this work is based on the labeling of cells with γ-Fe2O3 magnetic nanoparticles. These nanoparticles were previously deemed as biocompatible for the doses used [43], having for instance no impact on stem cell differentiation [44], and we further evidence here no detrimental effects of the magnetic labeling on spheroid morphology and growth, cell proliferation, viability and invasiveness (figures 2, 3 and 6). The spheroid formation relies on the magnetic attraction of labeled cells towards a fixed external magnet, with the magnetic force acting remotely to actively aggregate the cells into a spherically-shaped agarose mold. It is important to mention that the exposure to the external magnetic force acts only during the cell aggregation process, taking place within minutes, after which the magnets are removed. The mechanical stress imposed by longer exposure times to a magnetic field could have detrimental effects for the spheroid microenvironment. For instance, a force as low as 6 pN has been shown to be sufficient to increase the activation of the β-catenin/E-cadherin complex, known for its role in cell-cell adhesion and thus in spheroid cohesiveness [45]. Nevertheless, longer exposure times to magnetic forces, i.e. 2 d into the spheroid formation process, have been reported to have no negative effect on cell viability in spinal cord spheroids, which additionally maintain their physiological relevancy as models of the central nervous system [26]. In the scaffold-free magnetic cell levitation method, similar long-exposure times to the magnetic driving force showed no negative effects in cell viability, and the formed spheroids showed a typical expression of the N-cadherin protein [28].
As the mold morphology is perfectly defined by a spherical steel bead, the spheroid diameter can be finely tuned by selecting the bead diameter, with negligible variability, and the method yields magnetic spheroids with a high reproducibility in shape and sphericity. This is an important parameter to ensure reproducibility in drug screening, as changes in tumoral size are translated to changes in oxygen diffusion and nutrient and waste concentrations, as well as drug penetrability [46, 47]. An important advantage too is the high compactibility provided by the external magnetic field on the magnetically labeled cells, allowing the formation and collection of cohesive spheroids at very early time points, with the earliest one reported here being after 4 h of cell seeding into the mold. Although data vary depending on the cell line used and the initial number of cells, this feature is remarkable in comparison with other methods that require 3 d or more of maturation time before a fully formed spheroid can be obtained and collected for further experimental output [15, 28]. More recent efforts have focused on the high-throughput generation of spheroids in microwells [48, 49]. Although high-end equipment and experimental expertise can be required to produce the microwell molds, a tight control of spheroid size and diameter can be achieved, yielding spheroids with high sphericity. However, the spheroid maturation time needed remains high due to the lack of an external aggregating force, limiting experimental output of early tissue formation. Conversely, the microwell-based method has been coupled with centrifugation as an aggregating force, speeding the spheroid formation time, yet with less control on sphericity [50]. Nevertheless, the high-throughput feature of the microwells method remains an attractive advantage for drug and cancer screening, and is one that the magnetic molding method can too accommodate.
Tumor size is regarded as an important factor in drug penetrability, with larger tumors showing an increased resistance, an effect that too has been shown to take place in 3D tumor spheroid models [48, 51]. 3D tumor spheroids possess a more complex structure compared to cell monolayers, with extensive cell-cell and cell-matrix interactions, and develop a chemical gradient of nutrients and oxygen at diameters between 200 and 500 µm, with a distinct hypoxic and necrotic core typically present at sizes exceeding these values [52]. The presence of a hypoxic core in solid tumors has been found to translate into tumor progression and therapeutic resistance [53, 54], while additionally inducing a low-pH, acidic microenvironment that can further influence drug protonation and thus a less efficient uptake [55]. Furthermore, the tighter interactions between cells themselves, and between cells and the matrix produce a higher density that imposes a physical barrier and limits drug penetrability [2]. Here, we show that the magnetic spheroids produced by our method retain the expected drug penetrability profile (figure 5), with a higher resistance observed in comparison to cells cultured in monolayers. Similar results have been reported elsewhere for 3D tumor spheroid models and free DOX [48, 56]. The drug interaction profile presented here thus evidences the magnetic spheroid models as suitable for drug screening, where the advantages of size-tuning and low spheroid maturation times offered by the method can provide enhanced experimental output depending on the specific therapeutic needs.
Metastasis is a hallmark in cancer progression [57]. Cell invasion into adjacent tissue is the first step of the metastatic process and, for cells in solid epithelial tumors to achieve this, they must cross the basement membrane, a thin layer of extracellular matrix that acts as a structural barrier [58, 59]. The in vitro culturing of cells in 2D and 3D has thus shifted to incorporate elements of the extracellular matrix to model the basement membrane and to study cell invasion in conditions that better mimic the in vivo microenvironment, such as enhanced cell-extracellular matrix protein interactions. Here, we used Matrigel, a basement membrane matrix composed mostly of laminin, collagen, proteases and growth factors [60], to further demonstrate the suitability of the magnetic molding method to produce tumor spheroids that recapitulate cell invasion into the surrounding matrix. As we previously mentioned, one of the major aspects of the method is the ability to produce cohesive spheroids within a day of initial cell seeding. We therefore tested how spheroids obtained at very early time points after the formation process, i.e. 4 h (figure 6(a)), behave. Interestingly, they were found similar regarding cell invasiveness compared to spheroids collected at later time points. Of importance as well, the range of sizes tested (0.4, 0.5 and 1 mm) showed a comparable pattern in the increase of area of spread over one week, and also comparable to that of the hanging drop spheroids, suggesting no correlation between spheroid size and invasiveness and in agreement with previous findings [61]. In the context of drug screening, the use of an extracellular matrix in the culture of in vitro 3D models is of great significance, as the adhesion of tumor cells to the extracellular matrix contributes to therapeutic resistance in what is known as cell adhesion-mediated drug resistance paradigm [62], which has been evidenced for Matrigel [63].
The studying of tissue as a viscoelastic entity was brought forward by Steinberg, showing how embryonic tissues behave like a liquid and possess a defined surface tension [64–66]. This was later shown to be the case too for cell aggregates, with a direct linear correlation between cadherin expression and surface tension, indicating that stronger cell-cell adhesion gives rise to an increase in surface tension [40]. Moreover, the expression of cadherins has for long been associated with tumor malignancy, with their absence being a hallmark of cell invasion in many carcinomas [67]. Within this context, surface tension has thus emerged as a reliable experimental output parameter to model the mechanical properties of tumors [68], and it has been demonstrated that in less cohesive tumor spheroids (i.e. by suppressing the expression of E-cadherin) cells can escape the aggregate individually, akin to the metastatic process [69]. It seems natural then that surface tension can be used to study and predict tumor malignancy and metastasis in vitro. In this work, we show the advantage inherent to the magnetic properties of our tumor spheroids to manipulate and measure their surface tension through their deformation by external magnets, creating overall a condition of super-gravity. For the two model cell lines used (figure 7), an increase in the surface tension of the spheroid from day 1 to day 3 of maturation is observed, indicating an increase in spheroid cohesiveness, and our results for U-87 MG spheroids are similar to those previously reported in the literature [70]. Lastly, the increase in spheroid cohesiveness observed is in agreement with the decrease in DOX penetrability (figure 5). Overall, this further showcases the versatility of the magnetically molded tumor spheroids in generating reliable output data relevant in the context of cancer progression.
5. Conclusion
In summary, we report a tumor spheroid aggregation methodology based on magnetic cell labeling and the use of external magnetic forces. The process is highly reproducible, can be easily upscaled and produces cohesive spheroids with a high degree of sphericity and whose diameter can be finely-tuned, under very low maturation times. The magnetic spheroids accurately recapitulate the inherent behavior of 3D tumor cell aggregates, like size-dependent and limited drug penetrability, as well as cell invasiveness. Lastly, the magnetic properties of the spheroids allow the straight-forward evaluation of their surface tension, an important marker of tumor cohesion and metastasis. Taken together, these attributes make the magnetic molding method an attractive platform for therapeutic and cancer screening.
Acknowledgments
This work was supported by the European Union (ERC-2014-CoG project MaTissE #648779). We thank Aude Michel (Sorbonne Université, CNRS, PHENIX, UMR8234) for nanoparticle synthesis, Gaëtan Mary and Alexandre Fromain (Université de Paris, CNRS, MSC, UMR7057) for help with initial experimental work and magnetic characterization of the spheroids, respectively, and Myriam Reffay, Alberto Curcio and Aurore Van de Walle (Université de Paris, CNRS, MSC, UMR7057) for discussion.