
Abstract
In vivo cells express their characteristics in three-dimensional (3D) microenvironments via cell-cell interactions through autocrine, contact-dependent, paracrine, and synaptic signaling, often between heterologous cell types. Various in vitro 3D microwell-based culture methods have been proposed to further identify cellular characteristics by recreating cellular environments, typically in the form of spheroids and organoids, thereby realizing contact-based cell-cell interactions. However, in vivo cells generally exhibit multiple cellular interaction modes that have not been completely evaluated using existing microwell-based methods. This has led to a demand for more advanced and comprehensive methods. This study introduces a novel apparatus, the membrane-bottomed microwell (MBM) for non-contact co-cultures and 3D cell cultures. The MBM is a combination of a Transwell and a microwell array; these have previously been utilized to facilitate heterologous cell co-culturing and spheroid 3D cell culturing, respectively. In the Transwell insert, the lower part of the MBM is immersed in the culture media in which the cells are being two-dimensionally (2D) cultured, and the spheroids of the MBM are affected by the 2D cultured cells via the membrane at the bottom of the microwell. Here, we describe the methods for manufacturing the MBM in detail and elucidate the results of simulations of diffusion through the bottom of the membrane. We validate the proposed MBM for the spheroid culture of spermatogonial stem cells (SSCs), which had previously been 2D co-cultured with Sandos inbred mouse (SIM)-derived 6-thioguanine- and ouabain-resistant (STO; a mouse embryonic feeder cell line) feeder cells. The proposed system is shown to facilitate successful SSC spheroid culturing with paracrine signaling of STOs through an apparatus that simplifies both the loading and the evaluation processes; therefore, we believe that our findings will enable a more comprehensive understanding of SSCs and associated phenomena and that our system can be applied to various in vitro cell and tissue experiments.
Export citation and abstract BibTeX RIS

Original content from this work may be used under the terms of the Creative Commons Attribution 4.0 license. Any further distribution of this work must maintain attribution to the author(s) and the title of the work, journal citation and DOI.
1. Introduction
Two-dimensional (2D) in vitro monolayer cell culturing methods, as represented by Petri dish cultures, have been widely used in cell-based studies; however, it has been noted that the inconsistency between in vivo cellular environments and 2D monolayer in vitro culture environments can result in non-negligible issues in the test reliability of the experimental results [1–3]. In vivo cells express their unique functions in response to their three-dimensional (3D) microenvironments; that is, their interactions with neighboring cells, the extracellular matrix (ECM), and various mechanical/chemical stimuli [4]. To remedy such inconsistencies and improve the reliability of in vitro cell experiments, microwell-based 3D spheroid culture methods have been proposed for various cell biology studies; they exhibit various advantages, including ease of use, uniform formation of spheroids, and high-throughput productivity (despite being limited by the number of microwells). Previous studies regarding microwell array systems applied to 3D cell culturing have investigated embryonic stem cells [5, 6], neurons [7], hepatocytes [8–11], and breast cancer cells [12]. Such systems seek to recreate in vivo-like 3D cell interactions with their surroundings. However, it should be noted that the cell–cell interactions that occur in a spheroid are primarily realized through autocrine signaling (a signal, in the form of a hormone or chemical messenger, binds to receptors on the secreting cell), contact-dependent or juxtacrine signaling (through direct contact of the extra cellular membranes of cells), paracrine signaling (via local mediators released by cells into extracellular regions), and neuron cell synaptic signaling.
In vivo cell–cell interactions occur not only between homogeneous cells but also between heterologous cells. Interactions between heterologous cell types are considered suitable for providing deeper insights into the mechanisms of regeneration processes, immune responses, metastatic processes, and developmental processes. Therefore, these interactions have attracted increased attention from the scientific community. To generate such interactions in microwell array systems, a suspension mixture of different cell types is poured into the microwells to form 3D multicellular spheroids, facilitating heterologous cell–cell interactions under direct contact. For example, human hepatocytes were co-cultured in microwells with primary human endothelial cells to model non-alcoholic fatty liver disease [4], while islet cells were co-cultured with human amniotic epithelial cells (hAECs) [13] and islet endothelial cells (iECs) [14] to generate high-quality islet spheroids as part of a study regarding islet transplantation therapy for type 1 diabetes mellitus (T1DM). In contrast, the cell–cell interactions manifested via endocrine signaling (a long distance intercellular signaling mechanism) or paracrine signaling—which are realized via diffusible biomolecules mediating between heterologous cells that are not in direct contact via their cell membranes—often need to be recreated in vitro. This type of culturing method (in which different cell types are cultured in separate culture chambers between which diffusive molecular signaling is possible but direct membrane contact does not occur between cells) is often referred to as an 'indirect' co-culture—this term will be used frequently in the present paper. The Transwell culture system has often been used to generate the interactions satisfying these requirements; in one study, tumor spheroids were loaded into the bottom chamber, and a Transwell insert seeded with fibroblasts was placed on top of it, to mimic the epithelial-mesenchymal transition state (EMT-state) observed in in vivo tumors in early metastasis [15]. A further study was conducted to investigate neuroendocrine tumors in the tumor microenvironment [16]. For this investigation, tumor spheroids were first cultured on a separate platform, then transferred onto the Transwell insert and placed on the bottom chamber seeded with fibroblasts. There are several drawbacks to using the Transwell culturing system: additional work is required to prepare the spheroids and a supportive material such as collagen or Matrigel is necessary to root the spheroids on the plate or Transwell insert. To provide an in vivo-like liver environment, hepatic stellate cells (HSCs) were co-cultured with hepatocyte spheroids in the microfluidic channel connecting the two chambers in which each cell type was cultured [17]. However, to transfer the biomolecules secreted from the HSCs to the hepatocyte spheroids, an additional pumping system was needed to generate flow in the microfluidic channel. These additional equipment requirements and process steps could be regarded as obstacles to the universal utilization of Transwell or microwell platforms for 3D indirect co-culturing. It is therefore necessary to develop more advanced co-culture platforms capable of simulating 3D environments of indirect cell–cell interactions between multiple cell types.
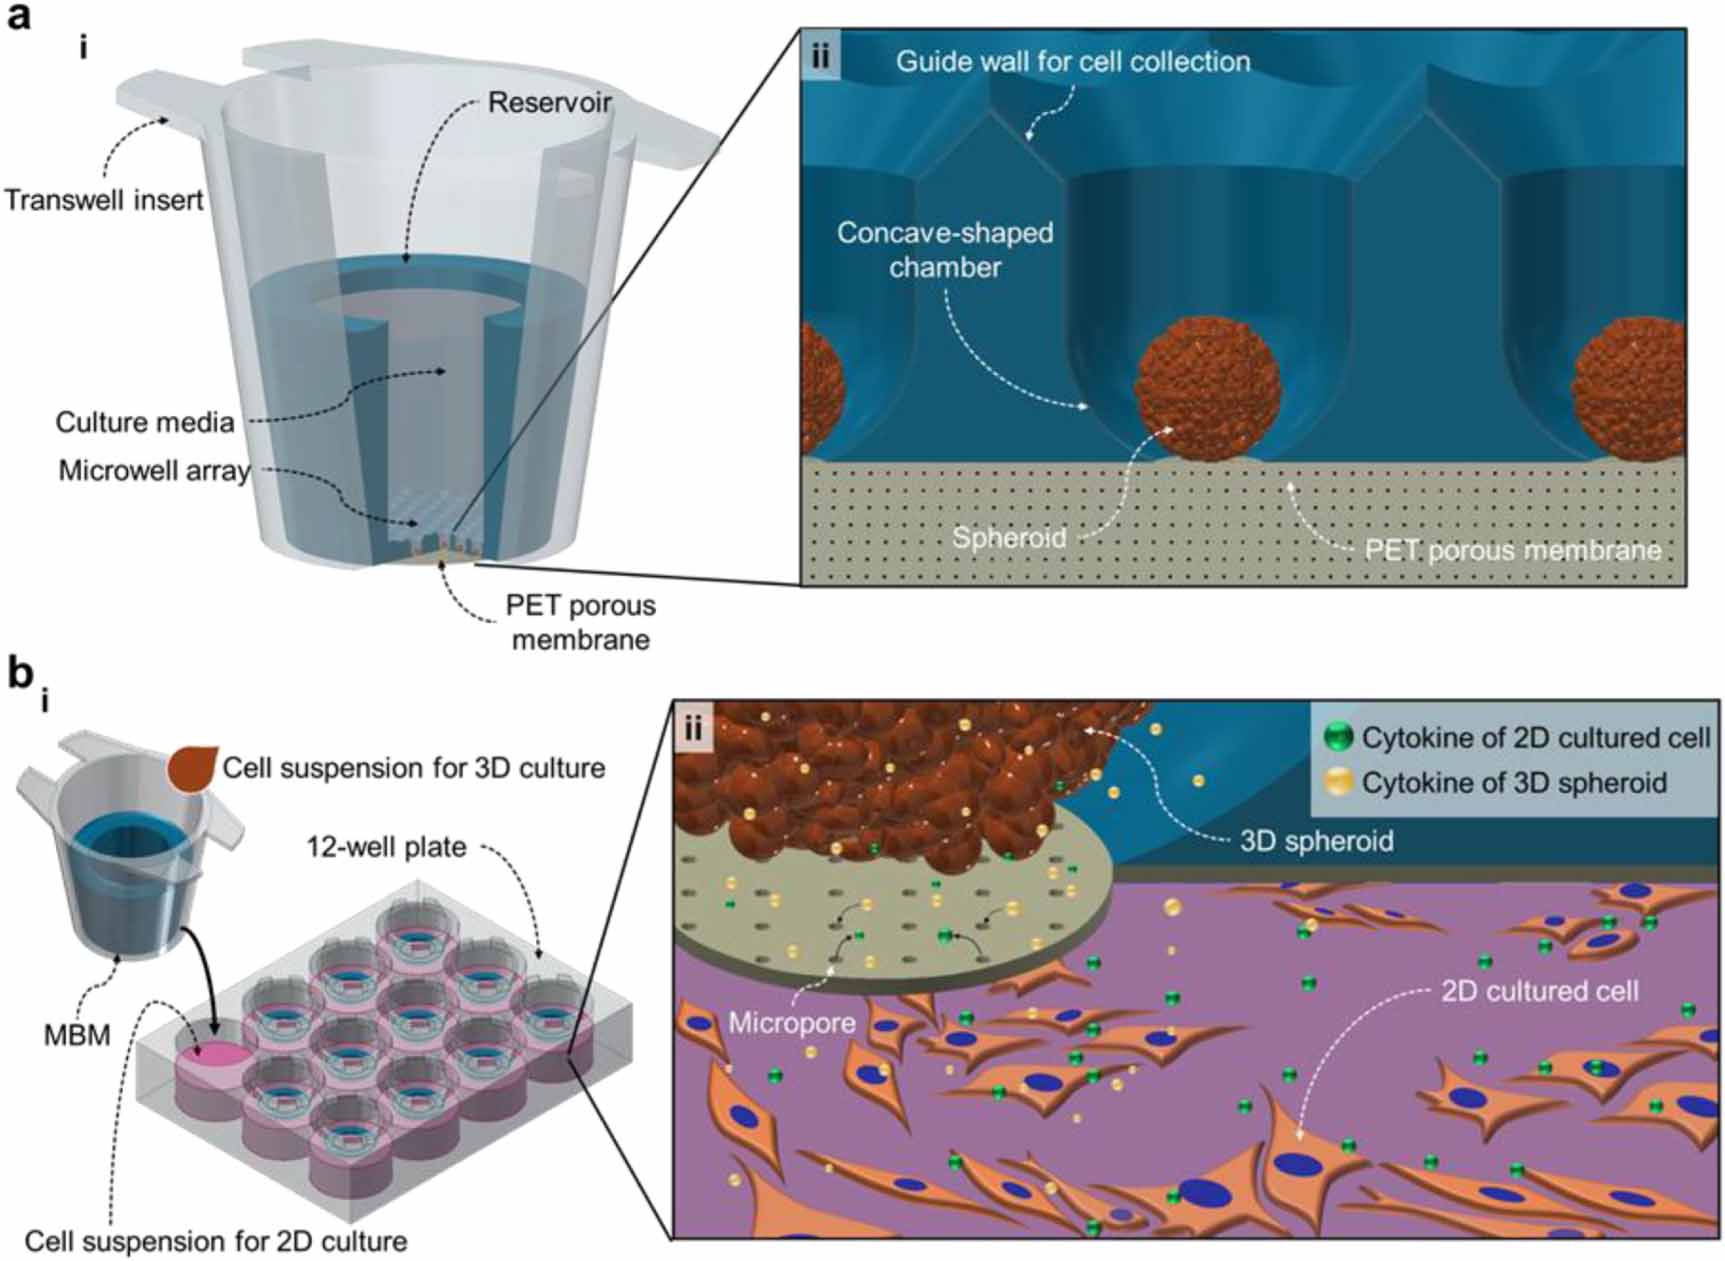
In this paper, we propose a membrane-bottomed microwell (MBM) array system that is combined with/inserted into a Transwell insert. This MBM array in the Transwell insert (figure 1(a))—referred to as the MBM in this paper—provides a simple and robust method for performing 3D indirect co-culture experiments by reducing the number of procedure steps and increasing the versatility of the microwell array to cover various cell-signaling mechanisms (autocrine, paracrine, contact-dependent, etc). The Transwell insert is a popular and convenient device for designing co-culture arrays in ordinary cell biology laboratories; therefore, we used the Transwell insert as a backbone vessel containing the microwell array and a reservoir (figure 1(a), i). The individual microwells of the MBM consist of a guide wall, a concave chamber, and a polyethylene terephthalate (PET) porous membrane at the bottom of the concave chamber, on which spheroids are cultured (figure 1(a), ii). This novel microwell array is then combined with the conventional Transwell apparatus to allow advanced 3D co-culture experiments to be performed (figure 1(b), i). The 3D spheroids are cultured in MBMs, and these are placed/inserted on top of a culture plate (6-well and 24-well plates) where a different cell type is cultured on a 2D monolayer. The porous bottom of the microwell allows for diffusion of the biochemical molecules that mediate communications between the 3D spheroids and the 2D cells despite their spatial separation (figure 1(b), ii). Moreover, because cells of various types are cultured in physically separate spaces, the retrieval of each cell type for further analysis is simple and does not require a cell-sorting procedure. To demonstrate the practical performance of our system in cell-biological applications, a co-culture of mouse spermatogonial stem cells (SSCs) in 3D spheroids and Sandos inbred mouse (SIM)-derived 6-thioguanine- and ouabain-resistant (STO; a mouse embryonic feeder cell line) feeder cells in the 2D monolayer was tested. It should be noted that a conventional culture protocol for SSCs is to co-culture them with and 'directly on' the STO cells, to guarantee their survival/proliferation and to observe their functional behaviors [18]; the majority of previous studies on SSCs have been confined to using this protocol [19]; however, this specific 2D culture condition of SSCs prevents a deeper understanding of SSC characteristics, which might only be obtainable by achieving experimental conditions that mimic in vivo cell signaling environments. Using the MBM system, this study proposes a new co-culture protocol is proposed for culturing SSC spheroids and STO feeder cells without direct cellular membrane contact. This is, to the best of our knowledge, the first attempt to cultivate SSCs in the form of 3D spheroids. Unlike the conventional 2D SSC culture method, in which the SSCs are co-cultured in direct cell membrane contact with the STO feeder, the culture of SSC spheroids in the MBM omits the sorting process after collection of the cells, so as to perform indirect co-culturing with the STO feeder. Our novel cultivation method for these cell types can therefore be implemented as a useful tool for generating testicular organoids, which can then be further utilized in developing infertility treatments. We also anticipate that this new 3D indirect co-culturing method that employs the MBM system can be applied to cancer research, stem-cell research, regenerative medicine, tissue engineering, and other cell-based clinical studies.

Figure 1. Membrane-bottomed microwell (MBM) configuration and illustration of interactions between 3D spheroids and 2D cultured cells. (a) Overall MBM structure. (i) MBM consists of a PDMS-based microwell array, PET porous membrane, and Transwell insert. Culture media are loaded inside the reservoir of the Transwell insert. (ii) The bottom of the microwell is sealed by a PET porous membrane. The microwells feature a guide wall and concave chamber for spheroid generation. (b) Indirect co-culture of 3D spheroids and 2D monolayered cells. (i) Schematics of the MBM utilization. Spheroids are cultured in the microwell array-equipped Transwell insert and 2D monolayer cells are cultured in 6- or 24-well culture plates. (ii) Through the micropores of the PET porous membrane, cytokines secreted from 3D spheroids and 2D cultured cells are exchanged and thus affect cell functions.
Download figure:
Standard image High-resolution image2. Materials and methods
2.1. Fabrication of MBM array
To enhance the cell-entrapment rate in the microwells, we designed the array by using a funnel-like, 45° downhill-slope surface at the microwell entrance (figure 1(a), ii); this guides the seeded cells (falling under gravity) into the microwell without loss. The bottom of the microwell chamber is concave in shape, and enables the cells to aggregate easily and form spheroids. The array of the guide-walled concave microwells was produced by micro-milling using a computer numerical control (CNC; DAVID 3040, David Motion Technology, Incheon, Republic of Korea) (figure 2(a)). A 90° tapered mill (4STE000900S04, JJTOOLS, Seoul, Republic of Korea) was used to engrave the guide walls into the acrylic plate (figure 2(a), i). A 0.6-mm-diameter ball endmill (2HRBG006160S04, JJTOOLS) was used to form the concave geometry of the microwell (figure 2(a), ii). The patterned acrylic microwell mold (figure 2(a), iii) was used to generate the polydimethylsiloxane (PDMS) master by using the following procedure (figure 2(a), iv). Uncured PDMS, which is a mixture of a prepolymer and a curing agent in a 10:1 ratio (Sylgard® 184, Dow Inc. Midland, MI, US), was poured into the acrylic mold and cured for 2 h at 80 °C on a hot plate (MSH-30D, DAIHAN Scientific, Wonju, Republic of Korea) to create the PDMS master. Subsequently, the PDMS master was treated to allow for PDMS double-casting (figure 2(b)). Note that in general, PDMS substrates cannot be used as molds for another PDMS casting solution because they adhere and combine to form one body after curing. To eliminate such problems in our study, a simple and robust two-step double-casting treatment [20] previously reported upon by our group was applied. In brief, the PDMS master was first exposed to air plasma for 30 s, then immersed in ethanol for 10 min and followed by a drying stage (figure 2(b), i–iv). This method efficiently passivates the adhesion-promoting species on the PDMS surface and allows us to cast PDMS from a PDMS master.
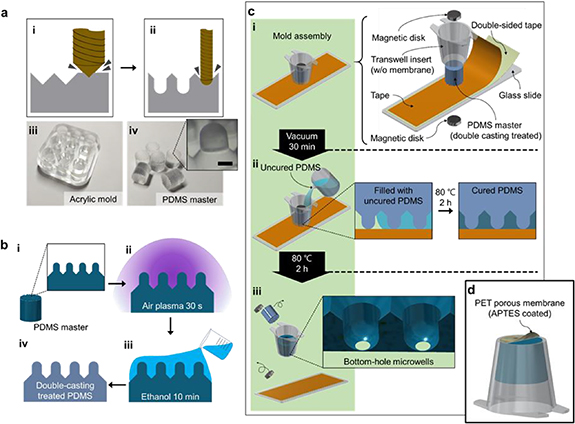
Figure 2. Process of fabricating the MBM. (a) CNC micro-milling for machining acrylic molds to fabricate the microwell array. (i) A tapered mill is used for machining the funnel-like guide wall of each microwell, and (ii) a ball endmill is used to shape the concave-shaped chamber of the microwell. (iii) Acrylic mold is produced to cast PDMS masters. (iv) On the PDMS masters, micro-pillar structures are formed. The scale bar is 300 µm. (b) A double-casting process involving ethanol and air plasma treatment is performed. (i) The PDMS master, with inverse features of the microwells, is fabricated from the prepared acrylic mold. Through treatment with (ii) air plasma and (iii) ethanol (or methanol), (iv) a double-casting treated PDMS master is prepared. (c) Fabrication method of the mold assembly for the bottom-hole microwell array. (i) A Transwell insert with the membrane removed a double-casting treated PDMS master, an adhesive tape, a double-sided adhesive tape, two magnetic disks, and a glass slide are needed for the mold assembly. (ii) Prepared uncured PDMS (for PDMS casting) is poured into the Transwell insert up to the brim of the PDMS master, followed by curing at 80 °C for 2 h. (iii) The PDMS master, magnetic disks, and the taped glass slide are separated from the mold assembly, and the bottom-hole microwell array built into the Transwell insert is subsequently fabricated. (d) To complete the MBM, the bottom-holes of the microwell array are plasma bonded with the APTES-coated PET porous membrane.
Download figure:
Standard image High-resolution imageA Transwell insert, the double-casting-treated PDMS master, an adhesive tape (normal and double-sided), magnetic disks, and a glass slide constitute the basic components of the mold assembly for fabricating the bottom-hole microwells (figure 2(c), i). The Transwell insert (Falcon® Permeable Support, Corning, NY, US) was prepared with the membrane removed. In the following process, the removed membrane was coated with Aminopropyltriethoxysilane (APTES) and attached to the bottom-hole microwell. The Transwell insert and PDMS master were aligned and affixed to the adhesive side of the tape on the glass slide. The tape facilitates the fixing and arrangement of the Transwell insert and PDMS master; it also prevents the leakage of uncured PDMS, which is added during the step shown in figure 2(c), ii. The magnetic disks located above the PDMS master and below the glass slide were used to apply a constant load to slightly squeeze the micropillars of the PDMS master onto the glass slide. The mold assembly was vacuumed for 30 min before pouring the uncured PDMS; this prevents the formation of air bubbles (when pouring the uncured PDMS) caused by the negative pressure on the PDMS master generated in vacuum. The uncured PDMS solution was carefully poured into the Transwell insert using a syringe, to fill the space between the Transwell insert wall and PDMS master mold and the space between the micropillar structures of the PDMS master with PDMS (figure 2(c), ii). To prevent the trapping of air bubbles in the micropillar structures (the interwell protuberances shown in figure 2(a), iv) of the PDMS master, the uncured PDMS must slowly flow down the side wall of the Transwell insert. The uncured PDMS filled into the mold assembly was solidified at 80 °C for 2 h. An additional degassing step was omitted to prevent any unwanted detachment of the tape from the PDSM molds that might occur due to air-bubble generation and growth during degassing. After curing the PDMS, the PDMS master, magnetic disks, and taped glass slide were removed to leave the casted bottom-hole microwell array within the Transwell insert (figure 2(c), iii). The PET porous membranes were obtained from the Transwell insert. To complete the MBM, the PET porous membrane (pore size of 0.4 μm) was first treated with air plasma for 2 min, then immersed in a 3-APTES (Sigma-Aldrich, St. Louis, MO, US) solution (diluted to 5% volume in water) at 80 °C for 20 min on a hot plate (DAIHAN Scientific) to coat the PET porous membrane. APTES is commonly used in silanization to fictionalize the surfaces with alkoxysilane molecules; this enables a strong covalent bonding with the plasma-treated PDMS [21]. The microwell array inserted in the Transwell insert was treated with air plasma for 60 s and physically contacted with the APTES-coated PET membrane under gentle pressure from a weight (1 kg) for 10 h at 80 °C (figure 2(d)).
To verify the shape (circularity = 4π × area/perimeter2; perimeter: length of the outside boundary of the hole) and area of the bottom hole formed according to the magnitude of the magnetic force, the number of magnetic disks is controlled. Three test conditions were adopted: without using a magnetic disk, with one pair of magnetic disks, and with two pairs of magnetic disks.
2.2. 3D spheroid culture and diffusion test in MBM
To verify the performance of our MBM system, MRC-5 cells (human fibroblasts, CCL-171, ATCC®, Manassas, VA, US) were cultured on an MBM (created on a 6-well plate-sized Transwell insert) that contained 19 microwells. The MBM was sterilized with air plasma for 2 min and precoated with 4% Pluronic F-127 solution (P2443, Sigma-Aldrich) to prevent cell attachment. During this process, air bubbles trapped in the microwells were removed through manual pipetting. The following day, the Pluronic F-127 solution was washed out twice with D-PBS (Gibco®, Thermo Fisher Scientific, Waltham, MA, US), and the MBM was left to dry completely. For cell loading, the microwells were filled with the cell culture media, i.e. Dulbecco's modified Eagle's medium (DMEM, Gibco®, Thermo Fisher Scientific) was added to a 1% antibiotic–antimycotic solution (Thermo Fisher Scientific) and a 10% fetal bovine serum (FBS, Gibco®, Thermo Fisher Scientific), and the air bubbles were removed through manual pipetting. The cell suspension (including the 5.0 × 10⁵ MRC-5 cells) was loaded into the MBM, with approximately 3,000 cells in each microwell. Then, the MBM containing the cells was placed in an incubator (SA-MCO-5AC, SANYO Electric, Osaka, Japan) at 37 °C, 95% humidity, and 5% CO2 content for 1 d to allow for cell aggregation. The MBM was placed on a 6-well plate containing 1-mL culture media, including two drops of NucBlue® Live ReadyProbes™ Reagent (Thermo Fisher Scientific). The experiments on the MBM without Pluronic F-127 coating and conventional microwell arrays were also conducted in a similar way.
2.3. 3D diffusion simulation
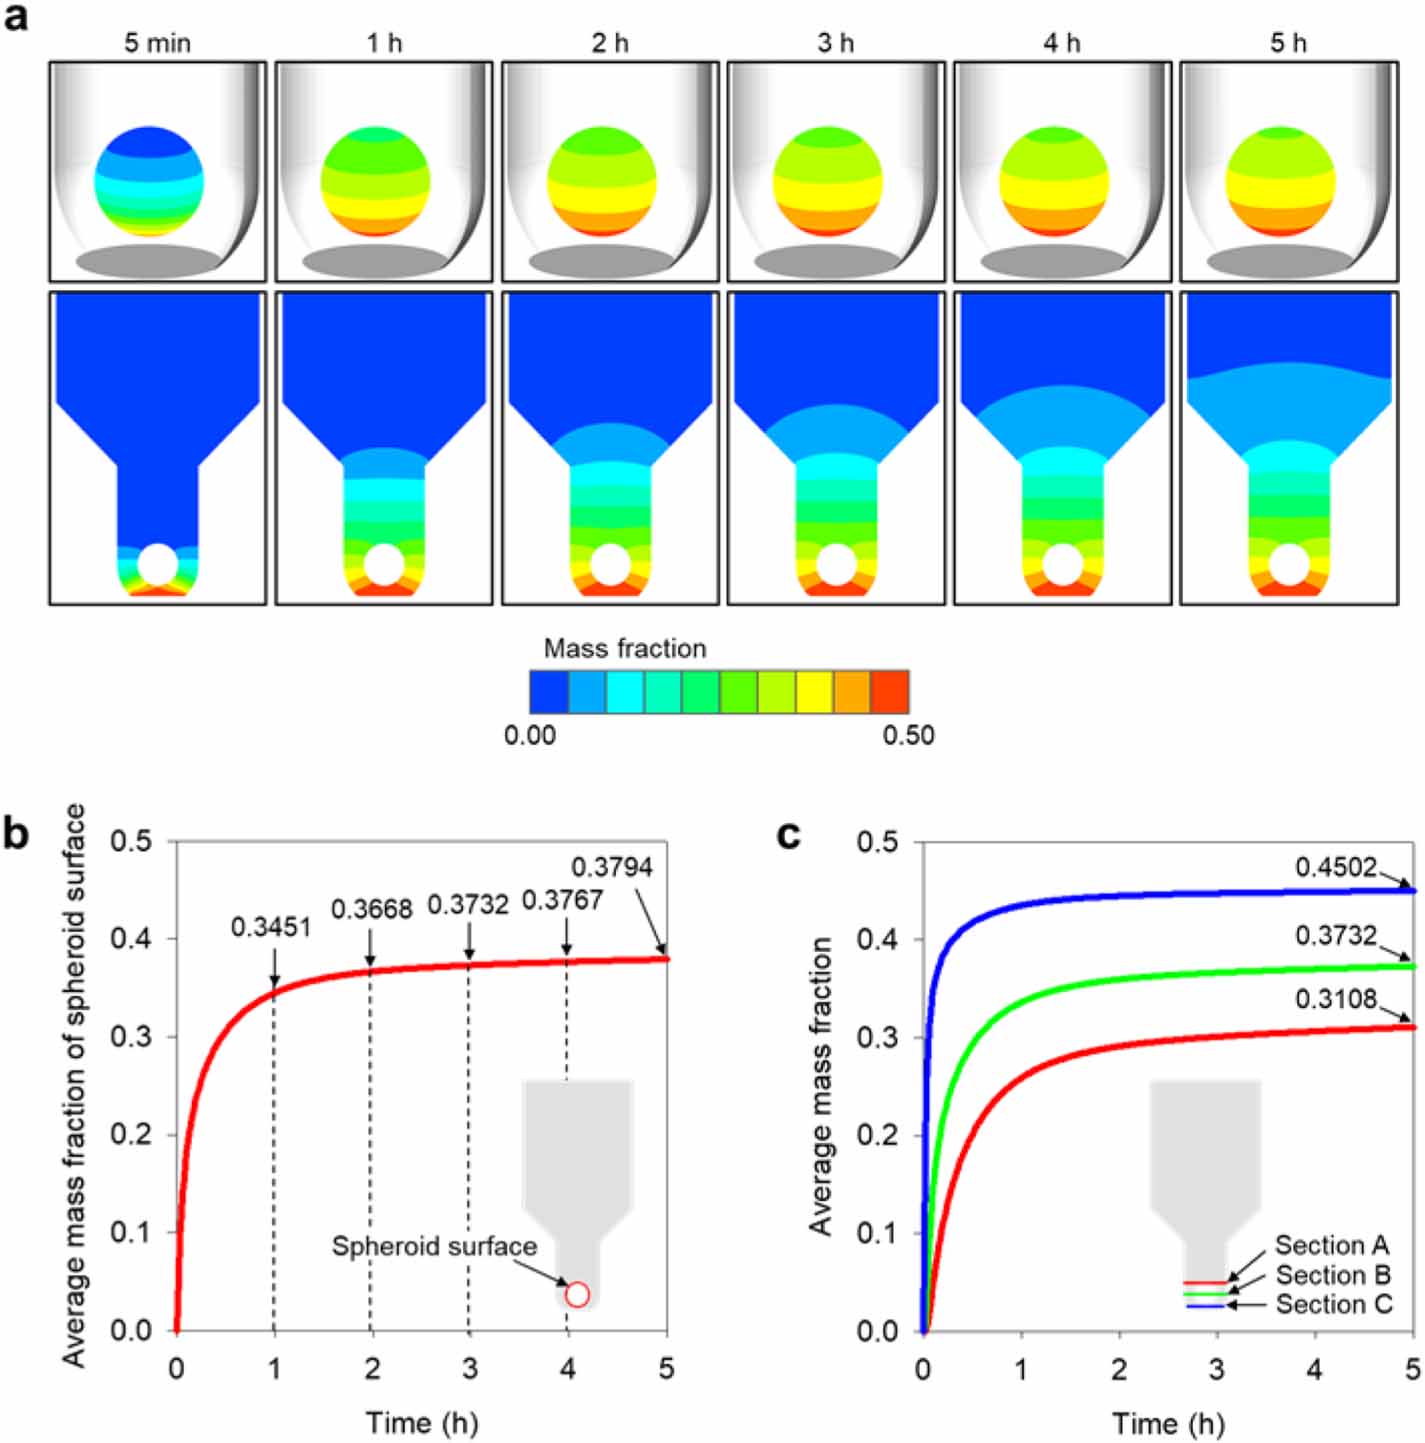
To quantitatively verify the diffusive spread of molecular substances across the bottom membrane of the microwell, a 3D species transport simulation was performed using ANSYS Fluent 19.2 (ANSYS, Canonsburg, PA, US). The computational domain covered the region of one microwell of the MBM, containing a spheroid with a diameter of 300 μm (figure 3(a)). A hexahedral mesh with 1,466,476 grids was applied to the entire computational domain (figure 3(b)). The boundary condition was set at the bottom membrane with 50% mass fraction of cytokine diffusing into the microwell. No other external forces were assumed on any boundaries, including the inlet and outlet. A periodic condition was applied to investigate the interactive effects of molecular diffusion from neighboring microwells. The working fluid filling the microwell was assumed to be water—a homogeneous and incompressible Newtonian fluid—at 37 °C, and its density was set to 993.3 kg m−3. The diffusion coefficient of the 50% mass fraction cytokine was set as 10−10 m2s−1 [22]. The transient simulation calculated a total of 5 h with a 10-s timestep, and converged through 500 iterations for each time step. To verify, this numerical model was applied to an additional simple diffusion experiment using a capillary tube (length = 100 mm, inner diameter = 0.5 mm) filled with water and dye; grid density and all other model schemes were maintained except the geometry. The numerical result matched the experimental diffusion data (supplementary figure S1, available online at stacks.iop.org/BF/12/045031/mmedia).

Figure 3. Computational model for analyzing biomolecular diffusion in a microwell of the MBM. (a) The computational domain includes a 300-μm-diameter spheroid in the 400-μm-diameter membrane (at the bottom). (b) The computational grid system shows that the hexahedral mesh was applied to all regions of the domain, including those near the spheroid.
Download figure:
Standard image High-resolution image2.4. Co-culture of SSCs and STO cells
We performed the co-culture experiment using SSCs and STO feeder cells with a 12-well plate-sized MBM system containing 85 microwells. The long-term 2D culture of SSCs is known to require co-culturing with STO feeder cells [23]. In our experiments, 3D SSC spheroids were used as the culture cells in the MBM and 2D-cultured STO feeders were used on the 12-well plate. First, passage-9 STO feeders were loaded on the 12-well plate and coated with a 0.1% gelatin solution (gelatin from porcine skin, Sigma-Aldrich); their cell density was 2 × 10⁵/mL STO-DMEM. After three days, the STO-DMEM in the 12-well plate was substituted by 1 mL of mouse serum-free media with growth factors (MSFM-gf), 10 ng of glial cell-derived neurotrophic factor (GDNF, R&D systems, Minneapolis, MN, US), 75 ng of GDNF family receptor alpha-1 (GFRa1, R&D systems), and 1 µg of basic fibroblast growth factor (bFGF, Corning). The MBM—into which 7.5 × 10⁴ SSCs suspended in 0.5 mL of MSFM-gf were loaded—was placed on the 12-well plate where the STO feeders were cultured. Passage-15 SSCs were then used, and the number of cells in each microwell was approximately 9 × 10². At two- and three-day intervals, half-media changes were performed for the plate and MBM, respectively.
We further cultured the SSCs using the conventional microwell array of 153 microwells (with no bottom membrane). We poured 1 mL of the STO-DMEM cell suspension (containing 4 × 10⁵ STO feeders) into the conventional microwell array, and approximately 2.6 × 10³ cells were used in each microwell. After three days, during a media change, MSFM-gf (1.5 mL), containing 1.5 × 10⁵ SSCs, was loaded into the conventional microwells. After 1 d of SSC loading, 0.5 mL of MSFM-gf was added. The SSC number in each microwell was approximately 9.8 × 10². The culture media was partially changed by 1 mL every 2–3 d.
2.5. Image analysis
The SSC spheroids cultured in the MBM system and conventional microwell array were observed through a microscope (CKX41, Olympus, Tokyo, Japan). To quantify the size of the spheroids, ImageJ 1.46r software (National Institute of Health, Bethesda, MD, US) was used to process the images (figure 4). The spheroid size was distinguished by a color threshold (figure 4(b)). The black-and-white threshold mode and brightness-range function of ImageJ were then chosen to separate the outlines of the spheroids. Next, large bright areas not corresponding to spheroids were manually selected and removed (figure 4(c)). The remove-outliers function was employed to filter out noise, leaving minor small-sized particles (figure 4(d)); a radius of 5.0 pixels and a threshold value of 50 were applied. The area of the spheroids was measured through the spheroid images (figure 4(d)) prepared through this process.
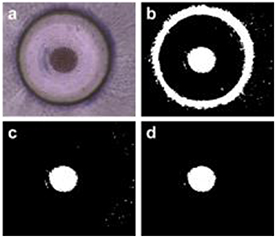
Figure 4. Image processing steps using ImageJ. (a) A brightfield image of the spheroid is taken for image analysis. (b) A color threshold function is applied to obtain the black-and-white image of the spheroid. (c) The extraneous large circular area showing the microwell wall is removed manually. (d) A final noise-filtered image for analyzing spheroid dimensions.
Download figure:
Standard image High-resolution image2.6. Cell-viability analysis
The viability tests of the SSC spheroids cultured in the MBM were analyzed using a LIVE/DEAD® Viability/Cytotoxicity Kit for mammalian cells (Thermo Fisher Scientific). To stain the SSC spheroids, any culture media remaining in the MBM was smoothly removed using a pipette, and 1 mL MSFM (containing 0.5 μL of calcein-acetoxymethyl ester solution and 2 μL of ethidium homodimer-1 solution) was added to the SSC spheroids in the MBM; these were then maintained at room temperature. After 30 min, the SSC spheroids were collected and observed through a confocal laser scanning microscope (LSM710, Carl Zeiss, Oberkochen, Germany).
2.7. Polymerase chain reaction (PCR) analysis
The RNAs of the STO feeder, 2D-cultured SSCs, and SSC spheroids cultured in the MBM were extracted with TRIzolTM Reagent (Invitrogen, Thermo Fisher Scientific) according to the manufacturer's instructions. Purified RNA was treated with DNase I and subjected to reverse transcription to obtain cDNA using Superscript III Reverse Transcriptase (Thermo Fisher Scientific). Quantitative real-time polymerase chain reaction (qRT-PCR) analysis was performed using a 7500 Real-Time PCR system with SYBR green real-time PCR master Mix (Applied Biosystems, Foster city, CA, US). PCR was performed by denaturation at 94 °C for 3 min, followed by 40 cycles of annealing at 95 °C for 1 min, 60 °C for 1 min, and 72 °C for 1 min. Then, a final extension was performed at 72 °C for 5 min. Table 1 lists the primer sequences. Expression levels were normalized to those of endogenous Gapdh, and the data were analyzed using the ΔΔCt method [24].
Table 1. List of primer sequences.
| Gene symbol | Forward (5'-3') | Reverse (5'-3') | Product size (bp) |
|---|---|---|---|
| CD34 | AAGGCTGGGTGAAGACCCTTA | TGAATGGCCGTTTCTGGAAGT | 157 |
| PLZF | CACCTTCGCTCACATACAGG | ACTTCTTGCCACAGCCATTAC | 142 |
| VASA | GAGATTGCCTTCAGTACCTATGTG | GTGCTTGCCCTGGTAATTCT | 105 |
| Gapdh | TGAAGGTCGGTGTGAACGG | CGTGAGTGGAGTCATACTGGAA | 150 |
2.8. Data analysis
All statistical analyses were performed using one-way ANOVA, followed by the Tukey's range test, or Games-Howell (in the nonequal variances sample). The results with p < 0.05 were considered significant; they are expressed as the mean ± the standard error of the mean.
3. Results and discussion
3.1. MBM fabrication
The MBM system was fabricated successfully through appropriate application of the micro-milling and double-casting procedures (figure 5). The acrylic mold produced via micro-milling contained an array of microwell patterns to enable the simultaneous fabrication of several PDMS masters (figure 2(a), iii and iv). MBM fabrication was carried out for two different sizes, one for a 6-well plate (diameter = 34.8 mm) and the other for a 12-well plate (diameter = 22.1 mm) (figure 5(a)), to show that the proposed fabrication method is can be scaled for wider applications. A scanning electron microscope (S-4300 N model, Hitachi, Tokyo, Japan) was used to clearly observe the MBM structures (figures 5(b)-(d)). In the top view, microwells were observed at the center of the hexagonal shape of the guide wall arrayed in a beehive-like pattern (figure 5(b)). Microwells with a diameter of 600 µm were fabricated and arranged with a spacing of 900 μm; one side of the guide wall was 520 μm. In the cross-sectional view, the guide wall and concave-shaped chamber of the microwell could be observed (figure 5(c)). Studies have reported that this guide wall can reduce cell loss considerably (almost zero loss) [25, 26] and that the concave shape improves the uniformity of the spheroids [5, 25, 27]. The depth of the microwells was 530 μm. The slope of the guide wall was set to 45° due to the use of the 90° tapered endmill (JJTOOLS) during the acrylic mold fabrication process (figure 2(a), i). We believe this funnel-like inlet feature enhances the cell-seeding efficiency by losing only a minimal number of cells when seeding them onto the substrate, which is important when expensive or rare cells are used. In the oblique view, it is observed that the PET porous membrane blocks the bottom-hole of the MBM (figure 5(d)).

Figure 5. MBM system fabricated via the micro-milling and double-casting method. (a) Different sized MBMs were fabricated in a manner suitable for the 6-well and 12-well plates. Detailed features of the MBM; (b) Top view of the MBM array (scale bar: 1.00 mm), (c) magnified cross-section (scale bar: 500 μm), and (d) oblique view (scale bar: 500 μm).
Download figure:
Standard image High-resolution imageAs described in the fabrication process of the MBM (figure 2(c)), the PDMS master was fixed on the glass slide to form the mold assembly, and a pair of magnetic disks were used to press the PDMS master onto the glass slide. The formation of the bottom-hole depending on the magnetic force was observed using three fabrication conditions: without magnetic disk, one pair of magnetic disks, and two pairs of magnetic disks (figure 6(a)). The PDMS master without magnetic disk maintains contact with the glass slide only through the adhesion of the tape (figure 6(a), i). The magnetic force presses the PDMS master and the glass slide, causing larger deformation at the tips of the micro-pillar structures of the PDMS master, and the magnetic force is controlled by the number of pairs of magnetic disks (figure 6(a), ii and iii). The bottom-holes of the MBM without magnetic disks were irregular and small (or absent) (figure 6(b), i) compared with the bottom-holes of the MBM fabricated using magnetic disks (figure 6(b), ii and iii); this was caused by the uneven distribution of the tape adhesion force. In case of MBM fabrication using the magnetic disks, the bottom-holes were clearly formed (figure 6(b), ii and iii). This magnetic force-based technique enables stable contact between the PDMS master and the glass slide. The bottom-hole area and circularity (circularity = 4π × area/perimeter2; perimeter: length of the outside boundary of the hole) of the MBMs fabricated using only the tape and the magnetic disks were compared (figure 6(b), iv). Unlike the bottom-holes for the MBM fabricated using magnetic disks, the bottom-hole produced using adhesive tape were observed to be smaller and exhibited lower circularity. The average bottom-hole area of the MBM fabricated using tape and without magnetic disks was 0.0173 mm2, with a standard deviation (SD) of 0.0082 (n = 22). For the fabrication involving a magnetic field, the average bottom-hole area was 0.0517 (SD = 0.0049, n= 27) and 0.0522 mm2 (SD = 0.0009, n = 27) for the MBM fabricated using one pair of magnetic disks and that fabricated using two pairs of magnetic disks, respectively (figure 6(b), iv). Furthermore, the circularity of the bottom-holes fabricated using the tape method was 0.82 (SD = 0.1047, n = 22); however, it was 0.84 (SD = 0.0774, n = 27) when one pair of magnetic disks was used and 0.92 (SD = 0.0497, n = 27) when two pairs of magnetic disks were used (figure 6(b), iv). These results confirm that the area and shape of the bottom holes improve in proportion to the load applied on the assembly of the PDMS master and glass slide and that the magnetic force applied to the PDMS master is essential to form bottom-holes. In this study, to verify the basic functions of the MBM, one pair of magnetic disks was implemented to ensure convenient fabrication of the MBM. MRC-5 cells and SSCs loaded in the MBM were aggregated and form spheroids after 2 d of culture (figure 6(c)). For SSCs, however, multiple cell aggregations were formed due to the weak cell-to-cell adhesion characteristics.

Figure 6. Bottom-hole sizes determined by controlling the deformation of PDMS. (a) Magnetic forces were used to control the deformation of PDMS, and thus, the bottom-hole size. (i) Without the magnetic disk, only adhesive force was the contact between the PDMS master and glass slide. To enhance the extent of deformation of the PDMS master, (ii) a pair of magnetic disks and (iii) two pairs of magnetic disks were tested. (b) Microscopic images of the bottom-holes created for following cases: (i) without magnetic disk, (ii) one pair of magnetic disks, and (iii) two pairs of magnetic disks. (iv) Quantitative graph of the bottom-hole area and circularity. (n = 22, 27 and 27 in w/o, one pair and two pairs, respectively. *p < 0.05, n.s: not significant). (c) Spheroid generation images after 2 d of culture for (i) MRC-5 s and (ii) SSCs in the MBM. All scale bars are 500 μm.
Download figure:
Standard image High-resolution image3.2. Drug diffusion in experiments and simulation
We performed three diffusion experiments using the conventional microwell array, the MBM without any coating, and the MBM with a 4% Pluronic F-127 solution coating (to prevent cell adhesion). To quantitatively confirm molecular diffusion through the membrane of the MBM in experiments, the MRC-5 spheroids cultured in the conventional microwell array and MBM were stained using NucBlue; after 12 h, the color intensity of the spheroids was measured (figure 7). In the conventional microwell array, NucBlue was applied to the spheroids more directly (NucBlue solution was added to the media in which the spheroids were cultured), whereas in the MBM, NucBlue was applied to the media on the culture plate and allowed to diffuse through the PET porous membrane to reach the spheroids in the microwells (figure 7(a)). Therefore, although all spheroids were stained blue (supplementary figure S2) the color intensities of the spheroids in the MBMs were generally weaker than those of the spheroids cultured in the conventional microwell array (figure 7(b), i–iii); the color intensities of the spheroids cultured in the MBM without Pluronic coating (150.5, SD = 25.7) were 31% lower than that observed in the conventional microwell array (217.7, SD = 6.4) (figure 7(b), iv). In the MBM coated with Pluronic, although the color intensity (187.4, SD = 21.9) was 14% lower than that observed in the conventional microwell array, the Pluronic coating did not affect the diffusion of NucBlue through the PET porous membrane (figure 7(b)). Pluronic coatings have been used to form non-adhesive surfaces of PDMS to prevent cells from adhering to the bottom of the PDMS microwell, facilitating the formation of spheroids [3, 24, 27]. Therefore, in the MBM treated with the Pluronic coating, the cell aggregate was better formed and expressed better color intensity than in case of cells cultured in MBM without Pluronic coating (figure 7(b), iv). Therefore, the delay in the arrival of drug molecules at the spheroids should be considered and addressed prior to the application of the proposed MBM system to specific situations.
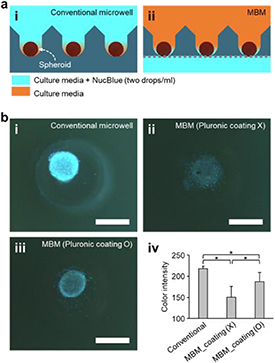
Figure 7. Diffusion test using NucBlue. (a) Experimental set up for (i) the conventional microwell array and (ii) the MBM array. (b) NucBlue staining images of the cultured spheroids in (i) the conventional microwell array, (ii) the MBM without Pluronic coating, and (iii) the MBM with Pluronic coating. (iv) Measurement of the NucBlue color intensity. All scale bars are 300 µm. (n = 19, *p < 0.05).
Download figure:
Standard image High-resolution imageA time-dependent 3D species transport simulation was performed to quantitatively determine the effects of the species that began to diffuse through the membrane to the spheroids inside the MBMs (figure 8). The entire surface of the spheroid was surrounded by cytokine 5 min after the start of the diffusion (figure 8(a)). Next, the concentration of the spheroid periphery increased rapidly; the average mass fraction of cytokine on the spheroid surface also increased rapidly from 0 to 0.3451 in 1 h (figure 8(b)). Thereafter, the mass fraction increased gradually until it converged and the mass fraction contour around the spheroid showed no significant change (figure 8(b)). The average cytokine mass fraction of the spheroid surface gradually increased to 0.3668 after 2 h, 0.3732 after 3 h, 0.3767 after 4 h, and 0.3794 after 5 h (figure 8(b)). From these results, it can be seen that 1–2 h after the start of the experiment, the spheroid is exposed to cytokine under nearly steady-state concentration conditions. Diffusion proceeds gradually upward in the membrane and the concentrations of cytokine exposed to the spheroids vary according to location; thus, these spatial concentration distributions must be analyzed quantitatively. For this purpose, three cross-sectional areas were selected within the MBM, and their average mass fractions were analyzed (figure 8(c)). The first area was that through which the lowest point of the spheroid passed (section C, 0.074 mm away from membrane, blue line in figure 8(c)); the second area was that through which the center of the spheroid passed (section B, 0.224 mm away from membrane, green line in figure 8(c)); and the third area was that through which the highest point of the spheroid passed (section A, 0.374 mm away from membrane, red line in figure 8(c)). After 5 h, the 'section C' area—which was located closest to the membrane—had a mass fraction of 0.4502, and 'section B' and 'section A' had mass fractions of 0.3732 and 0.3108, respectively. This quantitatively confirms that the lower part of the spheroid was exposed to higher concentrations of cytokine diffused from the bottom-membrane. Thus, if we use the quantitative data organized by time zone, we can identify the time at which the spheroid starts to change under the influence of cytokine in actual experiments and can subsequently identify the concentration of cytokine around the spheroid. Since this quantitative concentration information can provide important threshold values for the biochemical reactions and experimental changes of spheroids, it is expected that the simulated concentration results for MBMs can provide useful data for their practical applications.

Figure 8. Computational simulation results to predict the diffusion phenomenon in an MBM. (a) The contours of cytokine diffusion through the membrane over time. (b) Average mass fraction of spheroid surface. (c) Average mass fraction according to distance from membrane-bottom.
Download figure:
Standard image High-resolution image3.3. Co-culture of SSCs and STO feeder cells
The conventional in vitro 2D culture of SSCs requires STO feeders, and often, it is difficult to separate the two cell types for post-analysis. Therefore, the separation of such cell types for post-analysis is an appropriate goal for the demonstration of the utility of the MBM as an advanced co-culture system for the indirect co-culturing of SSCs and STO cells. As a baseline, SSC spheroid culture was attempted using the conventional microwell array before the MBM was used. For co-culture with the STO feeders, SSCs were loaded into conventional microwells, in which STO feeders had already been cultured for 3 d (figure 9(a), i). The STO feeders formed spheroids 1 d after they had been sprayed in the conventional microwell array; however, the size of spheroids was significantly reduced after 3 d (figure 9(b), i). On day 4 (day 1 after seeding the SSCs), the spheroids to which SSCs had been added retained their size but did not fully aggregate. In addition, during cultivation, on the spheroid, the cells scattered, and the size of the spheroid gradually decreased until day 9.

Figure 9. SSC spheroid culture using the conventional microwell array and the MBM. (a) Culture process of the SSC spheroids in (i) the conventional microwell array and (ii) the MBM. (b) Morphology brightfield images of SSC spheroids cultured in (i) the conventional microwell array and (ii) the MBM. The day of culture counted from the onset of SSC loading into the conventional microwell array is indicated in parentheses. Scale bars represent 200 μm. (c) SSC spheroid sizes measured by the area in the SSC spheroid images. (i) The size of spheroids is measured, including STO feeder spheroids cultured prior to SSCs seeding in conventional microwell arrays; the numbers in parentheses on the x-axis represent the day of culture counted from the onset of SSC seeding. (ii) The sizes of the SSC spheroids cultured in MBM. (b), (c) The day of culture counted from the onset of STO feeders loading into the conventional microwell array is indicated in parentheses, and the culture day from the loading of SSCs is indicated without parentheses. (n = 88, the spheroids cultured in the conventional microwell. n= 52, the spheroids cultured in the MBM. *p < 0.05).
Download figure:
Standard image High-resolution imageSSC spheroids cultured in the MBM underwent a different formation process (figure 9(b), i). SSCs were sprayed onto the MBMs placed on a 12-well plate in which STO feeders had been cultured for 3 d (figure 9(a), ii). No cells were observed to have aggregated by day 1 after SSC loading. By day 2, aggregation of the SSCs was observed, and over time, a clump of these cells formed a spheroid in each microwell and maintained its size (figure 9(b), ii). The sizes of the SSC spheroids cultured in the conventional microwell array and MBM were measured using ImageJ (figure 9(c)). In total, 88 spheroid images of the conventional microwell array and 52 spheroid images of the MBM were captured, and the SD values were less than 0.006 in both cases. In the conventional microwell array, on day 1, the average area of the STO feeder spheroids was 0.0229 mm2; after 2 d it was 0.0143 mm2, which shows a 37.5% reduction (figure 9(c), i). On day 4 (day 1 of SSCs culture), the average size of the spheroids increased to 0.0219 mm2 owing to the additional loading of SSCs. After the addition of SSC, the spheroid size increased slightly to 0.0228 mm2 by day 6 (day 3 of SSCs culture) due to the insufficient aggregation of the SSCs, which was observed on day 6 (day 3 of SSCs culture) (figure 9(b), i). Thereafter, the mixed spheroids—containing STO feeders and SSCs—were reduced to an average area of 0.0148 mm2 on day 9 (day 6 of SSCs culture). On day 1 of the MBM, the average area of the SSC spheroids was 0.0268 mm2; on day 2, the SSC spheroids were considerably aggregated and area had reduced to 0.0244 mm2 (figure 9(c), ii). This size was 0.0247 mm2 on day 4 and 0.0216 mm2 on day 7. The sizes of the SSC spheroids cultured in the conventional microwell array and MBM on the last observation day (day 6 of SSCs culture in conventional microwells; day 7 for the culture in the MBM), were reduced by 32.2% and 19.4%, respectively, compared with their initial sizes on the first day of SSCs loading. The SSC spheroid culture in the conventional microwell array was a simple replacement of the 2D culture dish used in existing SSC 2D co-culture methods employing a 3D microwell array; however, a significant size reduction of 37.5% exhibited by the STO feeder spheroids over 3 d strongly indicates that it is difficult to grow STO feeders in a spheroid form (figures 9(b), i and (c), i). Thus, it was easy to validate the prediction that the unstable survival rate of the STO feeder spheroids in the conventional microwell array would not allow them to function properly as a feeder for additionally loaded SSCs. In contrast, the SSC spheroids in the MBM maintained their forms and sizes for at least 4 d (figures 9(b), ii and (c), ii). These observations imply the possibility of SSCs being cultured in spheroid form through the exchange of molecules with the STO feeders that are stably cultured in the 2D culture plate below the MBM membrane. In the SSC spheroid images (figure 9(b), ii), the spheroid surfaces are rough, and single-cell particles are observed; this suggests that the junctions of SSC spheroids are weak. To perform the live/dead assay, the SSC spheroids cultured in the MBM for 7 d were collected by applying a mild jet flow via pipetting and allowing the SSCs to escape from the microwells, the SSC spheroids were broken during this harvesting process. In confocal images of the harvested SSCs, it was shown that live and dead cells were mixed (supplementray figure S3) often, some aggregated SSCs were found to be alive. The mass of SSCs indicates that the SSCs are alive in the form of 3D spheroids in MBM.
SSCs have the characteristic of self-renewal to maintain the stem cells and differentiation into spermatozoa [28]. It is possible to verify the activity of stem cells by transplantation into the testis of the busulfan injected recipient, which is extremely important in stem cell research. However, in the transplantation model, it showed a slow doubling rate (about 5.6 days) and a small amount of undifferentiated spermatogonia (about 0.3% of germ cells) [29, 30]. Thus, studies have focused on SSCs culture using the 3D culturing system for in vitro spermatogenesis, which is useful for understating of fertility mechanism study and clinical application [31, 32]. Therefore, the investigation of the SSCs organoid with the 3D structure using various methods has great advantages in medical utilization.
3.4. PCR data analysis
This study aimed to investigate the expression of undifferentiated SSCs and spermatogenesis-associated genes (figure 10). CD34 is a cell differentiation marker and is expressed in the surface of STO cells [33]; however, it is lowly expressed in SSCs [34]. The PLZF gene is known to be associated with the self-renewal and maintenance of undifferentiated SSCs [35, 36]. Moreover, VASA (also known as Ddx4) is involved in germ cell development and spermatogenesis [37, 38]. Therefore, we loaded these gene expressions between SSCs onto an STO feeder co-culture (2D culture) and an MBM spheroid 3D culture system using qRT-PCR. Our results show that CD34 is decreased in both the 2D- and 3D-cultured SSCs. It is suggested that SSCs are complexly separated from STO feeder cells. Furthermore, undifferentiated SSCs and germ cell development markers were higher in 2D- and 3D-cultured SSCs compared with STO cells. Interestingly, PLZF and VASA were highly expressed in the 3D-cultured SSCs in contrast with 2D-cultured SSCs. These data suggest that the 3D culture system induces SSC and germ cell proliferation and differentiation. As a preliminary study, we cultured the SSC spheroids using culture medium containing GDNF and GFRa1, which are important factors in the proliferation of undifferentiated stem cells; as expected, we observed that there still remains a much to be explored regarding SSCs. Therefore, in further study, starting with the structural observation of SSC spheroids, we will focus on the optimization of the culture medium conditions for spermatogenesis using SSC spheroids, and studies on spermatogenesis-related marker genes (NGN3, NANOS3, and c-kit) will be conducted [39].
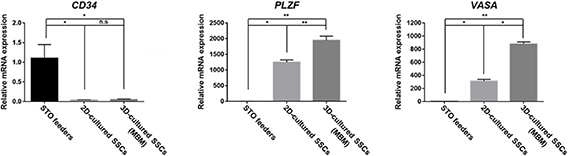
Figure 10. Expression of genes associated with stem cells in cultured SSCs. CD34 mRNA was decreased in 2D- and 3D-cultured SSCs compared with STO. However, undifferentiated SSC-maker PLZF and germ cell-maker VASA were highly expressive in 2D- and 3D-cultured SSCs. Data represent the mean ± standard error of the mean. *p < 0.05, **p < 0.01.
Download figure:
Standard image High-resolution image3.5. Potential applications and limitations of MBM
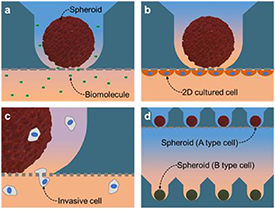
The MBM has other user-friendly advantages. It is used in the same way as the commercially available Transwells, which is frequently used in laboratories. Researchers can easily expand the range of studies (conducted using Transwells) to 3D cell cultures using this system (figure 11). As demonstrated via the SSC spheroid culture discussed previously, the response of spheroids to biomolecules will be studied via the co-culturing of spheroids in the MBM with 2D-cultured cells on the plate (figure 11(a)). By culturing the cells underneath the MBM membrane, the effect of physical cell contact on the spheroids can be identified (figure 11(b)). It is also possible to perform the cell migration assay on the spheroids (figure 11(c)). The MBM is applied to conventional microwell arrays to facilitate experiments in which the spheroid co-culturing procedure has to be expanded to different types of cell spheroids (figure 11(d)). By seeking to combine these MBM applications, we expect to address additional research topics that have been actively studied using 3D spheroids, such as stem cells [5, 6], neurons [7], hepatocytes [8–11], and tumor models [12], etc. However, the MBM has inherent limitations; it requires a minimum 1 h for the diffusion molecules to move across the bottom membrane, and the membrane allows all molecules to pass through, including the target molecule. Therefore, these limitations need to be addressed before applying the MBM in experiments.
Figure 11. Possible experiments using MBMs. (a) Influence of biomolecules secreted from the other cell types on the spheroids through the membrane. (b) Co-culturing with spheroids and 2D- cultured cells on the underside of the membrane. (c) Cell migration assay targeting the spheroids cultured in the microwell, via the membrane. (d) Spheroid-to-spheroid interactions through applying the MBM to the spheroid cultured in the conventional microwell array.
Download figure:
Standard image High-resolution image
4. Conclusion
Microwell arrays and Transwells are tools that have been widely used for higher-level cell experiments that cannot be performed in traditional 2D cell cultures. The MBM array proposed in this study combines the beneficial functions of microwell arrays (for spheroid culture) and Transwells (indirect co-culture). The membrane at the bottom of the MBM microwell supports the cells in forming spheroids; in addition, it allows mass exchange to occur through its micro pores. This design of the MBM has the advantage that both 3D spheroid culturing and indirect co-culturing with other types of cells can be performed in two steps: cell loading and MBM loading on the plate. CNC micro-milling and PDMS double-casting methods were used to fabricate the MBM array, and the PEP membrane was coated with APTES solution for chemical bonding with the PDMS surface. To visualize the diffusion phenomena in the MBM, a CFD simulation was conducted; this helped elucidate the environment experienced by the spheroids cultured in the MBM. As a demonstration, the spheroid formation of the SSCs was carried out. Our SSC spheroid culture system increased the number of SSCs and germ-cell-associated gene expressions compared to the 2D culture method. Therefore, the proposed method is advantageous in terms of the proliferation and differentiation of reproductive cells. This novel SSC spheroid culture method is expected to contribute to our understanding of the biological properties of SSCs.
Acknowledgments
This research was supported by the Bio & Medical Technology Development Program (2018M3A9H1023141) and the Basic Science Research Program (2019R1F1A1062123) of the NRF, funded by the Korean government, MSIT, Republic of Korea.