
Abstract
The prospects for exploiting proton transfer reaction-time of flight-mass spectrometry (PTR-ToF-MS) in medical diagnostics are illustrated through a series of case studies. Measurements of acetone levels in the breath of 68 healthy people are presented along with a longitudinal study of a single person over a period of 1 month. The median acetone concentration across the population was 484 ppbV with a geometric standard deviation (GSD) of 1.6, whilst the average GSD during the single subject longtitudinal study was 1.5. An additional case study is presented which highlights the potential of PTR-ToF-MS in pharmacokinetic studies, based upon the analysis of online breath samples of a person following the consumption of ethanol. PTR-ToF-MS comes into its own when information across a wide mass range is required, particularly when such information must be gathered in a short time during a breathing cycle. To illustrate this property, multicomponent breath analysis in a small study of cystic fibrosis patients is detailed, which provides tentative evidence that online PTR-ToF-MS analysis of tidal breath can distinguish between active infection and non-infected patients.
Export citation and abstract BibTeX RIS
1. Introduction
Human breath measurements have a long history of aiding physicians in their diagnosis of illness and ailments. For example, physiological measurements of lung function, as assessed by spirometry, are used to screen general respiratory health in a manner analogous to that of blood pressure in cardiovascular health. These tests are inherently non-invasive, a significant advantage to their use in the clinical environment. However, spirometry alone may not yield the clinical aetiology of a disorder (Miller et al 2005). There is, however, a potential wealth of information contained within the relative concentrations of the components of exhaled breath. Carbon dioxide measurements alone (as the third most abundant gas in exhaled air after nitrogen and oxygen) can provide information on alveolar ventilation and, indirectly, circulation and metabolic status. Increased CO2 production is observed in patients suffering, for example, from sepsis or tetanus. Another important example of a commonly measured endogenous compound is nitric oxide, which is increased in subjects with airway inflammation and its measurement is one of the few breath tests that have been developed for use in clinical practice (Dweik et al 2011). After CO2 and the aforementioned gases, it is only water and a small number of inert gases that are present in appreciable quantities in breath, bringing the sum of individual components close to 100%.
The small fraction that remains comprises a vast number of trace compounds, largely volatile organic compounds (VOCs) whose concentration can range from parts-per-million to the part-per-trillion by volume (ppmV to pptV). Just as capnography directly monitors exhaled CO2 and indirectly monitors CO2 present in arterial blood, VOCs detected in breath include those that have been produced in the body and are transported via the bloodstream to the lungs. It has been known for many years that breath odour can be an indication of disease, a common example being the characteristic fruity smell of the breath of diabetic patients due to high levels of acetone in the body (Tassopoulos et al 1969).
On the basis that VOCs in breath are representative of VOCs in the blood and therefore processes occurring in the body, analysis of exhaled breath may become a non-invasive prognostic or diagnostic for use in clinical practice (Kim et al 2012). With a wide range of VOCs present in breath, a variety of different analytical techniques have been used to measure them. Highly sensitive instruments are required to determine breath VOCs that might be present in concentrations as low as the pptV range. Gas chromatography–mass spectrometry (GC-MS) has in the past been the most commonly used technique (e.g. Jansson and Larsson 1969, Phillips et al 1999a, 1999b) and has identified a large number of endogenous VOCs (Miekisch et al 2004). The main disadvantage of GC-based systems is that sample pre-treatment (pre-concentration on sorbent traps or by solid phase microextraction) precludes on-line breath analysis (Boots et al 2012). Over time, other techniques have been applied to breath research including ion-mobility spectrometry (IMS) (Baumbach 2009, Ruzsany and Baumbach 2005), selected-ion-flow-tube mass spectrometry (SIFT-MS) (Smith and Španěl 2004) and proton-transfer-reaction mass spectrometry (PTR-MS) (Lindinger and Jordan 1998). SIFT-MS and PTR-MS are examples of direct MS techniques, exhibiting high sensitivities for VOC measurements and therefore near real-time measurements are made possible in both techniques (no sample pre-treatment is necessary) (Blake et al 2009).
In general, most breath biomarker research to date has been conducted using the mixed air sampling technique due to its simplicity, cost and ease of use for patients (Steeghs et al 2007). This approach generally utilizes sampling bags, adsorbent tubes or canisters to collect whole breath samples. However, this approach is liable to contamination and dilution by dead-space air (Beauchamp et al 2008). Time-controlled offline sampling aims to alleviate this but problems can occur due to physiological variation in dead-space volume and breathing patterns (Amann et al 2010). In general, alveolar (end-tidal) air has the lowest concentrations of exogenous species and thus the advantage of employing direct online sampling is clear. However, the analytical technique employed needs to be fast and sensitive in order to be selective in the portion of the breath that is sampled. At present, there is no standardized approach to online breath sampling with direct MS but the established methods employed in spirometry, capnography and NO testing may offer a means to standardize breath VOC sampling and analysis (O'Hara et al 2008) and recent progress in sampling techniques has resulted in the use of buffered end tidal sampling (Herbig et al 2008).
To date, direct MS techniques have been applied to online breath measurements for various different systems and studies (Amann et al 2004, Španěl and Smith 2011) in order to identify biomarkers. Recently, Herbig et al (2009) described a PTR-ToF-MS system capable of measuring multiple metabolite signals over a timeframe fast enough to characterize a full breath cycle. An advantage to a system such as this is that a full mass spectrum can be obtained for end-tidal breath so that multiple biomarkers can be identified and recorded. As breath samples represent a complex and unique mixture of gases, it is likely that multiple biomarkers best represent an individual's metabolic state. Furthermore, the benefit of using PTR-ToF-MS (compared to, for example, PTR-quad-MS) is not only its ability to rapidly capture entire mass spectra but also the resolving power that ToF analysers can exhibit, which may lead to more confident species assignment through accurate mass detection (Jordan et al 2009, Blake et al 2012).
The ability of PTR-ToF-MS to capture an entire mass spectrum (with potentially high resolution) under a fast rate of acquisition means that it may be possible to characterize pattern changes within mass spectra to characterize different populations. An analogous principle lies behind electronic noses, which are sensor arrays that are cheap, compact and easy to manufacture (Gardner et al 2000). As an example, electronic noses coupled with pattern recognition have been applied to lung cancer research (Di Natale et al 2003, Dragonieri et al 2007). Ultimately, a small, portable and simple instrument would be far more suited to everyday use in clinical practice than a costly and often large research instrument. At this early stage breath analysis research is likely to continue using specialized laboratory instruments, but in the longer term we anticipate that the findings from this research will lead to the construction of smaller instruments specifically designed for the detection of identified biomarkers. Technologies such as PTR-ToF-MS are well suited to breath biomarker research and discovery as they can be used to obtain complex spectra for pattern recognition and, following deconvolution, may yield information regarding the speciation of successfully identified biomarkers.
The present study demonstrates the versatility of PTR-ToF-MS as a tool for physiological and pharmacological studies and for medical diagnostics. These are illustrated using a series of case studies focused on both single biomarker measurements and multiple biomarker measurements. The single biomarker studies are aimed at quantifying acetone levels in human breath and measuring volatile metabolites following ethanol consumption. We then turn to the real strength of PTR-ToF-MS when compared with single channel mass spectrometric techniques, its ability to acquire the whole mass spectrum at once (in a rapid manner). Results are presented from a small-scale study of the VOCs in the breath of cystic fibrosis patients and we show that online breath sampling with PTR-ToF-MS has the potential to distinguish between infected and non-infected patients.
2. Materials and methods
2.1. Proton transfer reaction–time of flight–mass spectrometry
The instrument used to generate the data presented in this study is described in detail by Blake et al (2004) and Wyche et al (2007). In brief, PTR-MS utilizes chemical ionization in the form of proton transfer, normally from H3O+, to ionize analyte molecules. The instrument described here is capable of using alternative reagent ions and so is sometimes referred to by the more general title of chemical ionization reaction (CIR)-MS. Chemical ionization is a soft ionization technique, as the reactions produce little excess energy. As a result, many product ions remain intact, although significant ion fragmentation is still observed for certain classes of compounds (Blake et al 2009).
The production of relatively simple mass spectra makes PTR-MS an excellent technique for analysing complex VOC matrices such as breath. In addition, time-of-flight mass spectrometry brings with it the ability to rapidly monitor all mass channels simultaneously, providing a complete real-time VOC profile. During these experiments, in order to measure multichannel the ToF analyser was operated at a mass resolution (m/Δm) in excess of 1000 and was not utilized in high resolution mode. The key components of the instrument used include a radioactive 241Am ion source and a drift tube coupled to a reflectron time-of-flight mass spectrometer (Blake et al 2004). The drift tube of the PTR-ToF-MS instrument contains two regions. The main drift cell experiences a constant electric field to number density ratio (E/N), whereas the small region between the last electrode and the exit aperture, which is referred to as the collision cell, can operate under electric field conditions different from the main part of the drift tube. The collision cell is normally used to promote fragmentation of hydrated VOC cluster ions. During breath sampling, the breath air is continuously introduced into the upstream end of the drift tube at a flow rate of 220 sccm, which is operated at a pressure of 6 mbar. A continuous flow of water vapour enters the top of the ion source at a set flow rate of 30 sccm. An E/N of 80 Td was used for the main part of the drift tube and 174 Td for the collision cell.
2.2. Single breath sampling (FVC-full vital capacity) at Glenfield hospital and during the ethanol experiments
For human breath measurements, an end-tidal sampling scheme was employed. As will be detailed in later sections, this approach was used for both measurements of single molecules in breath during a study at Glenfield hospital (Leicester, UK) and for a study into the composition of exhaled breath following the consumption of ethanol. The breath sampling apparatus consisted of a plastic mouthpiece and an adult electrostatic bacterial/viral filter (Flexicare Medical Limited, Mountain Ash, Mid Glamorgan, UK) connected to a Digital Volume Transducer (DVT; VMM-400 Ventilation Measurement Module from Interface Associates, Laguna Niguel, CA, USA). The 15 mm outer diameter of the cartridge connected directly into the breath sampling apparatus. A T-piece connector with two non-return valves (Intersurgical, Wokingham, Berkshire, UK) was used to allow the patient to breathe room air on inhalation. The sample line between the apparatus and the instrument was heated to 40 °C and a heated blanket (Infroheat Limited, Wolverhampton, UK) surrounded the entire sampling apparatus, also heated to 40 °C. The dead volume of the apparatus was approximately 100 mL. The volunteers performed a full inhalation followed by a vital capacity exhalation. Breath was sampled from 68 different people: 34 males and 34 females, with an average age of 45 (range 16–87) and BMI of 26.9 (range 18.5–47.9). A number of subjects were current smokers (10 patients) or ex-smokers (5 patients) based on patient declaration. On initial inspection of acquired data, 1 s was the longest time over which ions could be integrated during a full vital capacity exhalation such that breath profiles could be traced. The signal at m/z = 59, corresponding to protonated acetone, is consistently observed in breath samples and was used in this case to visually select the end-exhaled region of each breath (an example is presented later in figure 4). This region was then used to average over all mass channels with a typical duration of 1–3 s during a full vital capacity (FVC) exhalation. Subjects provided three direct breath measurements and all breath and ambient air measurements were made using 1 s integration times over an m/z range of 12–154 Da. The study was approved by the Leicester Research Ethics Committee.
The same apparatus and analytical method was used during the ethanol consumption experiment. Two healthy volunteers (1 male, age 30, BMI 24.1 and 1 female, age 25, BMI 20.3) were asked to give single vital capacity breaths. Five breath measurements were recorded over a half-hour period prior to any alcohol consumption so that baseline levels could be obtained. The volunteers then consumed 2 units (approximately 20 mL ethanol) of alcohol over a 10 min period. End tidal breaths were then collected immediately after and then at regular intervals over the following 3 h. No food had been consumed in the 2 h prior to the experiment and no other food or drink was consumed during the course of the experiment.
Measured count-rates were calibrated into absolute concentrations using a gas standard generator (Model 491, KinTek) fitted with a humidifier unit (see also Wyche et al 2007). Variable concentrations were delivered at 100% relative humidity (T = 40 °C) for permeation tubes containing acetone, acetonitrile, dimethylsulfide, acetic acid, ethanol (VICI, UK) methanol and isoprene (Kin-Tek). Corresponding limits of detection for 1 s acquisition at 2σ precision (with normalized sensitivities in parentheses) for these compounds were 15 ppbV acetone (98 ncps/ppbV at m/z 59), 1 ppbV acetonitrile (95 ncps/ppbV at m/z 42), 2 ppbV dimethylsulfide (74 ncps/ppbV at m/z 63), 23 ppbV acetic acid (27 ncps/ppbV at m/z 61), 2059 ppbV ethanol (0.5 ncps/ppbV), 9 ppbV methanol (41 ncps/ppbV at m/z 33) and 26 ppbV isoprene (7 ncps/ppbV at m/z 69).
Figure 1 outlines a schematic of the breath sampling apparatus used in this study. Experiments were carried out to assess whether the bacterial filter or any other part of the sampling apparatus removes VOCs in the sampling process. Known concentrations of VOCs were passed through the breath sampling apparatus using a gas standards generator (Model 491, KinTek) and reference measurements were obtained by passing the same mixture through a standard line of PFA tubing under both dry and humid conditions. The sampling loss tests were conducted for the compounds acetone, acetonitrile, dimethylsulfide, acetic acid, methanol, isoprene and ammonia. No observable loss was observed for these gases under the conditions described within the precision of the PTR-ToF-MS technique (<2% relative standard deviation (RSD)).

Figure 1. Schematic of the breath sampling apparatus coupled to PTR-ToF-MS (note that DVT = digital volume transducer and MCP = microchannel plate).
Download figure:
Standard image2.3. Tidal breath sampling during the cystic fibrosis study
The breath sampling apparatus used for the cystic fibrosis study was essentially the same as that for the studies described in the previous section, with a minor modification to the interconnecting tubing diameter which resulted in a dead volume of 170 sccm. Breath samples were collected from a small group of patients who were attending a cystic fibrosis clinic at Leicester Royal Infirmary. A total of ten cystic fibrosis patients (five males, five females, mean age 14) took part and four healthy children (three males, one female, mean age 9) formed the control group. All cystic fibrosis subjects displayed chest symptoms at the time of the trial and were taking or had recently completed antibiotic treatment. Some subjects were additionally taking steroid-based anti-inflammatory medication and/or were receiving DNase treatment to reduce mucus viscosity. No subjects in the control group showed signs of illness at the time of the trial and were free of any chronic lung condition. In the cystic fibrosis group, sputum/cough swabs for culture were taken within 10 days prior to breath sampling: five cystic fibrosis patients were found to be infected (three with Staphylococcus aureus, two with Aspergillus fumigatus, one with mixed flora). The study was approved by the University Hospitals Leicester Research Ethics Committee.
Each patient was sat down for a few minutes to relax before sampling and 5 min of ambient air background measurements were made during this period. Breath collection involved tidal breathing, inhalation and exhalation via the mouth for 5 min. All patients were analysed during the afternoon, with no food having been consumed in the previous 2–3 h. Both ambient air and breath were recorded at 1 s integration times (typically 104 complete mass scans) and a mass range up to 200 Da was employed in the PTR-ToF-MS measurements. As during the sampling session breaths were continually captured, the signal to noise of a mass channel could be significantly increased if exhaled breath was integrated over multiple breaths thus improving the detection limit. The following detection limits were calculated over a timeframe of 1 min and 2σ precision: 3 ppbV acetone, 0.2 ppbV acetonitrile, 0.2 ppbV dimethylsulfide, 4 ppbV acetic acid, 311 ppbV ethanol, 1 ppbV methanol and 3 ppbV isoprene.
3. Results and discussion
As ionization conditions in PTR-MS can be soft, fragmentation is minimal for many compounds. Consequently, if a mass channel is free from nominally isobaric species the ion count rate at the specific m/z reflects the concentration of the corresponding unprotonated species in the gas phase. In invoking this assumption, analysing single mass channels provides two main areas that can be exploited for research with direct breath measurements: single biomarker measurement (see section 3.2) and pharmacokinetic studies (see section 3.3). In PTR-MS, single biomarker analysis is particularly useful where a compound is both present at high concentration and is more sensitive towards PTR ionization when compared to any potential 'interference' species. Where this is the case in breath, endogenous compounds can be measured in real time and in certain cases it may be possible to relate them to a disease or disorder. Furthermore, to a first approximation, once identified, a biomarker can in principle be quantified theoretically using PTR-MS as long as the kinetics of ionization are known and the reagent ion signal simultaneously recorded. In practice, this approach can lead to significant uncertainty (Blake et al 2012). Additionally, the sensitivity of a species is dependent on sample humidity and CO2 content (though under these conditions the latter affect is negligible) (Keck et al 2008). These issues can be explored and resolved by using external calibration to establish the concentration of a particular species (Wyche et al 2007, Schwarz et al 2009), which then makes it possible to reliably quantify individual compounds using PTR-MS.
3.1. Real-time multi-channel measurements of breath
To demonstrate the temporal and multichannel nature of breath VOC data from PTR-ToF-MS, figure 2 shows an example following a typical data acquisition of a 5 min tidal breathing exercise. This plot exemplifies the great strength of PTR-ToF-MS, i.e. the ability to monitor multiple compounds in real-time simultaneously. As shown most clearly in the upper trace, which focuses on acetone (protonated m/z 59), the breathing cycle can be identified and thus alveolar breath can be discriminated from dead-space air by focusing on the appropriate sections of the breath trace. Clearly, since this time-resolved information is available in every mass channel simultaneously, a rich source of information is obtained.
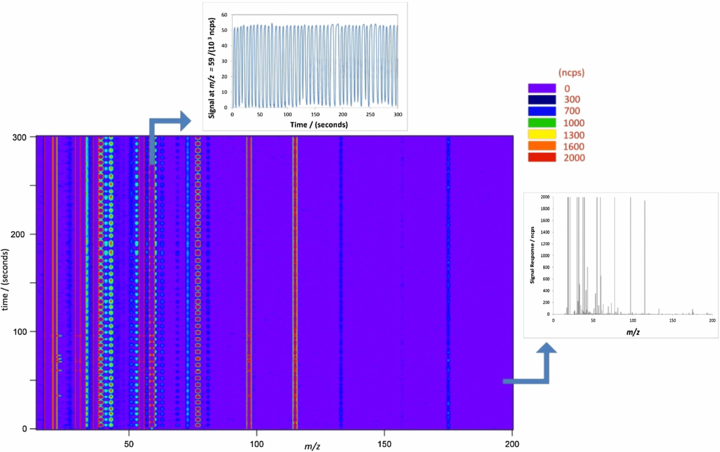
Figure 2. Example breath analysis data output: 5 min tidal breathing degraded into a time series for a single ion at m/z = 59 (top trace). Also shown on the right-hand side is a specific mass spectrum recorded at t = 50 s.
Download figure:
Standard image3.2. Direct PTR-ToF-MS in single breath studies
The quantitative performance of a technique is critical. Although multiple-compound detection is where PTR-ToF-MS offers unique benefits, the technique can of course be used for exploring single compounds. An example of a species suitable for single compound analysis by PTR-MS is acetone, a ubiquitous breath component present in the high ppbV range and whose alveolar concentration varies over time and across populations (Turner et al 2006, Smith et al 2007). Figure 3 shows the distribution of acetone levels in the breath of a population of 68 subjects in a study conducted at Glenfield Hospital, UK, recorded using PTR-ToF-MS. In this study, patients provided three direct breath measurements, as described in section 2.2. The results obtained are indicative of those found elsewhere; for example, Smith and Španěl (2007) reported a population median of 477 ppbV based on direct-breath results obtained from several studies using SIFT-MS, compared to 484 ppbV (325–684 ppbV interquartile range (IQR); 163–4264 ppbV total range) obtained here. Not only does this result support previous literature findings, the fact that these results are similar to those found using different analytical techniques adds credence to the concept of single compound analysis by direct PTR-ToF-MS. For example, Deng et al (2004) used SPME-GC/MS to obtain a median acetone concentration of 520 (420–625 IQR; 220–800 total range) all ppbV for 15 healthy controls whilst Schwarz et al (2009) reported an acetone distribution with a median of 559 ppbV and a total range of 280–1269 ppbV. It should also be noted that King et al (2010) used PTR-MS in conjunction with GC-MS for unambiguous direct breath sampling of acetone.
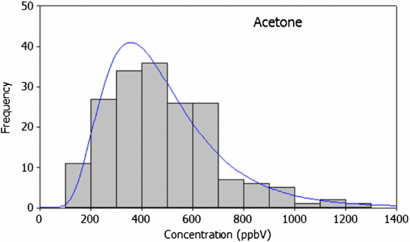
Figure 3. Population variability in acetone from direct PTR-ToF-MS measurements from the breath of 68 subjects using online (full vital capacity) sampling. Data were acquired at m/z = 59 (corresponding to protonated acetone ion) and employed 1 s signal integration.
Download figure:
Standard imageUeta et al (2009), used in-needle pre-concentration and a GC-MS technique to find a total range of 190 to 660 ppbV (270–550 ppbV IQR) for acetone in a controlled type-II diabetes patient's breath (within the range found here for healthy controls). Uncontrolled type II diabetes resulting in ketoacidosis can cause elevated acetone levels in breath. Deng et al reported higher values, between 1760 and 3730 ppbV (1955–2470 ppbV IQR), in 15 type II diabetics. For insulin-dependent diabetics, even whilst adequately controlled, breath acetone levels between 2000 and 5000 ppbV have been observed (Smith et al 1999). It is worth noting that whilst the comparability of these results with our own highlights the quantitative nature of PTR-ToF-MS, the dynamic range of PTR-ToF-MS is such that it easily covers the spread in both healthy and diabetic breath acetone levels. In general, acetone population variability is likely to be caused by a number a factors including age, gender, BMI, physiology and illness.
The results from the Glenfield study (see Methods section for details) are summarized in table 1, alongside other compounds measured in the same study. Though species identities in table 1 are tentative, peak assignment was supported by examining the ratio of the naturally occurring isotope peaks.
Table 1. Median breath VOC levels obtained from the Glenfield study (n = 68*) compared to the previous literature on healthy adult breath samples.
| Concentration in breath/ppbV | |||
|---|---|---|---|
| Peak assignment | m/z | This study | Previous work |
| Acetone | 59 | 484 | 462a, 520b, 559c |
| Methanol | 33 | 350 | 461a |
| Isoprene | 69 | 193 | 106a, 240d |
| Acetonitrile* | 42 | 2 | <20e |
| Dimethyl sulfide | 63 | 11 | 20–40f |
*The acetonitrile concentration represents the median from a sample set of 49 non-smokers. aSmith et al 2007, bDeng et al 2004, cSchwarz et al 2009, dTaucher et al 1997, eAbbott et al 2003, fTaucher et al 1996.
Acetonitrile, an exogenous compound commonly observed in the breath of smokers, is included in table 1 based on the median of 49 declared non-smokers. As would be expected, in this study a significant difference (p < 0.05) was found between non-smokers (median 2 ppbV, n = 49), ex-smokers (2 ppbV, n = 10) and smokers (18 ppbV, n = 5). Four non-smoking subjects were excluded from the acetontrile dataset as their breath contained anomalously high levels of acetonitrile (possible reasons for this include inaccurate assignment of smoking status, the potential effects of secondary smoking, or another exogenous source of acetonitrile such as automobile exhaust fumes). Acetonitrile has a long residence time in the body in comparison to other smoking-related compounds, such as benzene and acetonitrile, with concentrations in the breath of smokers prevented from further smoking taking almost 1 week to return to non-smoker levels (Jordan et al 1995). For compounds other than acetonitrile, the median concentrations are reported for the total sample size (n = 68) as differences between smoking populations were not observed. For example, in this study, no difference was found between breath isoprene concentrations in non-smokers, ex-smokers and current smokers (respective medians: 189 ppbV, 173 ppbV, 165 ppbV, p = 0.37), as was similarly found by Kushch et al (2008).
Having established, based on these findings and an ever growing body of supporting literature, the spread across a population for an identified biomarker, it is necessary to examine variability over time, both across the time frame of a single direct breath measurement and breath sampling session, and over longer time frames (of particular significance with respect to a biomarker's suitability as a diagnostic tool). By excluding the dead-volume and optimizing the breath sampling technique, the spread in variability during a direct breath measurement can be minimized: the end-exhaled averaged method described above typically yielded an RSD in breath compound concentration of less than 2%. Over three successive breath measurements, the RSD was typically less than 5%. An interesting example of a compound that exhibited a larger degree of variation was isoprene with an RSD of typically around 20%, consistent with previous findings as isoprene has been found to respond very sensitively to changes in pulmonary ventilation and perfusion (King et al 2009). Figure 4 shows the variation in acetone levels in the breath of a single person over the course of a day; over this timeframe the geometric standard deviation of the distribution in acetone concentration is 1.01. This result is clearly lower than the inter-population spread displayed in figure 3 over the timeframe of a single day, a finding supported by indirect PTR-MS measurements taken by Thekedar et al (2009), who also investigated variation over timeframes of 1 min and 1 h. Further, Thekedar et al (2009) also investigated the spread over 70 days and found the variation to be much larger, a finding supported here based upon daily measurements made by an individual female subject for 4 weeks over the course of this study, resulting in a GSD of 1.5. In all cases, the intra-population variability GSD was smaller than that of the inter-population variability (GSD = 1.6) again; this may be an important consideration when examining the potential use of acetone as a biomarker.
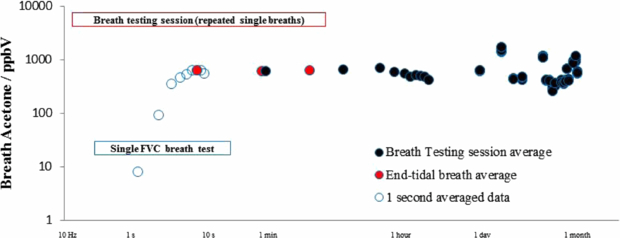
Figure 4. Longitudinal study of acetone in breath based upon repeated measurements of a 24-year-old female subject. (Open dots represent real-time acquired data, red filled dots represent end-exhaled averaged data and filled black dots represent data averaged over three successive breaths during a breath testing session.)
Download figure:
Standard image3.3. Pharmokinetics of ethanol metabolism measured on breath
Figures 3 and 4 display evidence for the potential of PTR-MS as a diagnostic tool using a biomarker that has been previously identified and well characterized in the literature: acetone. The minimal spread in biomarker concentration over the timeframe of a session and within a single day illustrates another use of single compound analysis, namely in pharmacokinetic studies. For example, such an approach could be used to track metabolites through time and monitoring patients following intervention. Several pharmacokinetic studies have already been conducted using real-time mass selective techniques; for example, Beauchamp et al (2010) measured breath following the consumption of Eucalyptol using direct MS and Beauchamp (2011) has outlined the potential of breath measurements in pharmacokinetic studies. To exemplify this ability in the current set-up, figure 5 shows the effect of two adults consuming two units of alcohol (50 mL at 40% Vol.). The assumption here is that the protonated parent ions represent metabolites formed as the body processes alcohol. As one would expect m/z 47, protonated ethanol, rises quickly. A rise in m/z 45, which correlates with the ethanol profile, corresponds to protonated acetaldehyde, a known intermediate of ethanol metabolism (Freund and O'Hollaren 1965). In figure 5 it should be noted that whilst the sensitivity of ethanol based on m/z = 47 is very low (see section 2.2), the high oral concentrations of ethanol encountered may exceed the linear response range of PTR-MS. Acetaldehyde is further metabolized by alcohol dehydrogenase to acetic acid. After 100 min, an increase in m/z 61 is seen, which may be protonated acetic acid levels beginning to rise as the levels of ethanol and acetaldehyde decrease. High initial ethanol concentrations were recorded owing to mouth contamination, which fall as the ethanol is cleared from the mouth. Readings then rose again as ethanol passed into the blood stream and therefore concentrations began to increase on breath (also reported by Smith et al 2002). High levels of methanol were also recorded as the high levels of alcohol in the body inhibited metabolic loss, a result similar to that found by Lindinger and Jordan (1998).
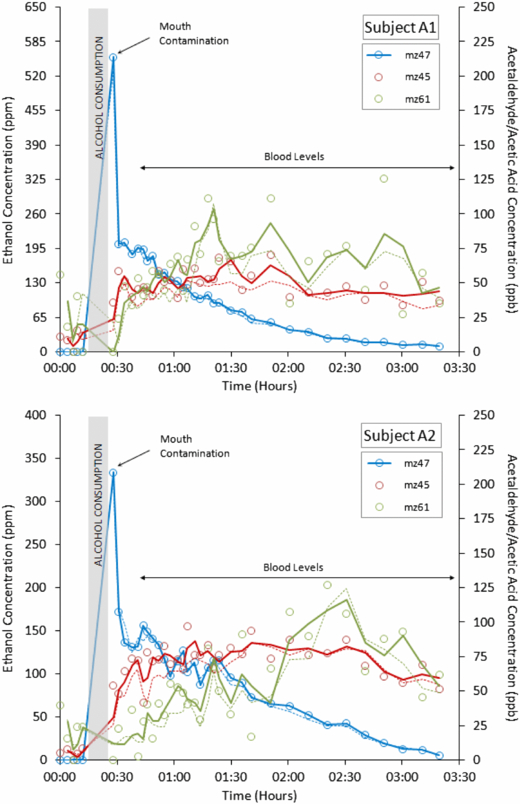
Figure 5. Ethanol metabolism in Subjects A1 and A2 (top plot = subject A1/male, bottom plot = subject A2/female). The solid line links adjoining points (for m/z 47) or represents a two-point moving average (for m/z 45 and m/z 61).
Download figure:
Standard imageAs m/z values obtained using PTR-MS are not strictly compound identifiers, experiments such as this breath alcohol trial, where the metabolic pathways and products are known, provide a means to support peak assignments verified by comparing results taken using different instruments.
3.4. Direct PTR-ToF-MS applied to fingerprinting breath
A small trial study was conducted to test the potential clinical application of direct-ToF-MS with tidal breath collection for a group of cystic fibrosis children in order to try and identify bacterial lung infection. A total of ten cystic fibrosis patients (five males, five females, mean age 14) took part and four healthy children (three males, one female, mean age 9) formed the control group. Microbiological results (as described in section 2.3) confirmed bacterial or fungal infection in six of the patients.
On qualitative assessment of the results, the common breath components at m/z 33, 59, 63 and 69 (protonated methanol, acetone, dimethyl sulfide and isoprene, respectively) generally showed no trend across the patient and control groups. Average values for acetone and dimethyl sulfide were comparable to that observed in healthy adults (displayed in table 1) whilst average methanol and isoprene values in the study subjects were generally lower than that observed in the group of healthy adults (consistent with a previous study on children's breath (Taucher et al 1997)). Previous reports have linked dimethyl sulfide and isoprene to cystic fibrosis and respiratory exacerbation (Barker et al 2006, Kamboures et al 2005, McGrath et al 2000). However, the present results indicate no significant difference between dimethyl sulfide and isoprene in the cystic fibrosis (CF) and healthy control (N) groups (mean dimethyl sulfide: CF = 965 ncps (normalized counts per second, relative to 1 × 10⁶ counts of hydronium) versus N = 831 ncps, p = 0.28 and mean isoprene: CF = 393 ncps (excluding outlier) versus N = 493 ncps, p = 0.13), although conclusive results are difficult to draw from such a small sample size. For P. aeruginosa infection, the propanol and hydrogen cyanide content of breath samples from cystic fibrosis subjects have been examined owing to their previously identified link with cystic fibrosis (Wang et al 2006, Enderby et al 2009). Throughout this trial the signals in the corresponding mass channels never exceeded ambient levels in line with no identified P. aeruginosa infection.
Direct ToF-MS data contain many variables (approximately 40 m/z values were significantly elevated above background recorded levels) for each sample so principal component analysis (PCA) was used to reduce the dimensionality of the data and to look for underlying trends. The resulting PCA biplot is shown in figure 6. The plot presents the scores and loadings for the first principal component, describing the greatest variation in the data, against the third principal component as this provided the best separation of the groups. The PCA plot shows good but not complete separation. Healthy subjects and non-infected cystic fibrosis were not distinguishable and grouped together, but were separated from the infected cystic fibrosis subjects with the exception of one non-infected cystic fibrosis patient (whose breath profile appeared closer to the infected patients than the other non-infected patients). Interestingly, loadings representing m/z 89 and 71 in figure 6 were also found to be elevated in bacterial culture headspace mass spectra of S. aureus (data not presented).
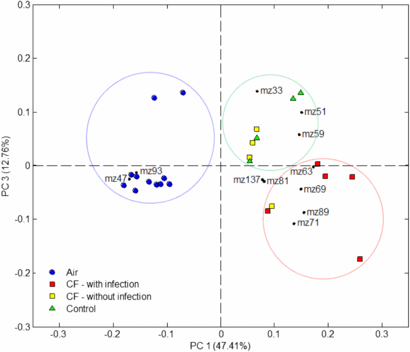
Figure 6. PCA biplot for the first and third principal components for a small group of cystic fibrosis patients with and without infection versus a control patient group.
Download figure:
Standard imageThe need for rigorous validation of findings based on multivariate analyses in breath biomarker research is discussed by Miekisch et al (2012) and, accordingly, it is difficult to draw strong conclusions from the correlations observed in this small-scale study. Clearly, a larger data set is needed to properly investigate the observed trends, but the results highlight important areas of focus for future work in multichannel measurements of breath. Furthermore, these tests compliment recent findings whereby breath volatiles measured by secondary electrospray ionization-MS confirmed the presence of bacterial lung infection in the breath of mice (Zhu et al 2013). Coupling direct ToF-MS data with a statistical technique such as PCA illustrates the use of multiple variables to 'fingerprint' clinical conditions.
4. Conclusion and future perspectives
The case studies presented in this paper add to a substantial body of literature on breath studies using direct MS techniques which have built upon pioneering work using SIFT-MS (e.g. Španěl and Smith 2011) and PTR-MS (e.g. Lindinger and Jordan 1998). The data in figures 3 to 5 support previously published results that cover some of the background knowledge required to fully evaluate the feasibility in using direct ToF-MS in diagnostic medicine. They also represent the first time these tests have been reported using a PTR-ToF-MS technique. The data in figure 3 outline the spread in population variability for biomarkers measured in breath whilst figure 4 provides an example of how a single person's breath varies over time for a single biomarker. Both of these observations are of course key to quantifying the differences between biomarkers that relate to different populations and disorders. However, compounds that show potential as diagnostic biomarkers are by their nature common in healthy breath samples and vary depending on many factors (as described above). Figure 4, for example, shows the extent to which acetone concentrations can vary in healthy control subjects and several outliers were recorded in figure 3 that approached levels previously recorded for uncontrolled diabetic patients (Smith et al 1999). Whilst variation in biomarker concentration between subjects and over long time frames can be large, the variance between mass channels within mass spectra may enable further diagnostic capability. In this case, diseases would be best described by a breath pattern or 'fingerprint'. This concept has been employed in analogous studies of, for example, direct headspace sampling of fungal and microbial air (for example, see O'Hara and Mayhew 2009). In examples such as these, headspace sampling does not share the same time restraint as online-breath sampling (enabling full mass scans to be performed by quadrupole-based systems). However, these direct techniques have not been employed to profile VOC patterns in online breath samples. Herbig et al (2009) first described the use of PTR-ToF-MS in sampling online breath and presented here, as a proof of principle, are the first measurements that use this technique to profile the breath fingerprints of children with cystic fibrosis, with and without infection.
Typically run with a cycle time equivalent to a mass range of 300 Da, a breath measurement taken by PTR-ToF-MS can provide many variables which can be processed by any number of the multivariate statistical techniques that are currently available. In using multivariate statistics, deconvolution of mass spectra is possible based upon knowledge of fragmentation patterns of breath compounds, as well as their sensitivity towards PTR-MS detection. However, deconvolution is not necessary for an electronic nose approach to successfully recognize different breath patterns. A multidimensional statistical approach was taken by Fedrigo et al (2010) in a breath study on ionizing radiation exposure using an offline PTR-MS approach. The results from studies such as these can be applied to PTR detection problems in general.
Potentially, PTR-ToF-MS offers other modes of operation that have perhaps not yet been fully exploited in breath research. By standardizing the breath sampling approach, the variability between successive breaths has been shown to be minimal (Thekedar et al 2009). In this case different reagents could be used to generate different CIR spectra for successive breaths within a breath sampling session (this is the principle behind SIFT-MS). The ability of different reagent ions to distinguish between isobaric species has already been established in PTR-ToF-MS (Wyche et al 2005) and the use of alternative reagent ions to H3O+ such as O2+ and NO+ would generate different spectral patterns, thereby widening the number of variables to be analysed using a multidimensional statistical approach (Blake et al 2006).
Finally, as near real-time analysis enables the capture of a full breath cycle, it is possible to apportion different breathing phases in an equivalent manner to the procedures used in spirometry and capnography. The statistics generated by this process may also provide metrics for multivariate analysis that could yield further diagnostic potential. The sensitivities reported by Wyche et al (2008) in one of the earliest reported PTR-ToF-MS experiments were of the order 0.1 counts ppbV−1 s−1 per compound. Based upon standard requirements for spirometry, measurements should be taken on a 0.2 s timeframe (Miller et al 2005), which would therefore yield an approximate limit of detection of 9 ppbV. For many compounds, this would be too insensitive to observe VOCs on breath. However, recent technological developments have drastically improved these detection limits; Herbig et al (2009) report a system that is both highly mass-resolved and sensitive whilst Barber et al (2012) have recently reported the development of a radio frequency (RF) ion funnel capable of increasing sensitivity by two orders of magnitude in PTR-ToF-MS systems. These technological advances make the inclusion of dynamic statistics in multivariate breath analysis possible in the near future.