

Abstract
Volatile organic compounds (VOCs) released into the headspace air over human tissues infected with different bacteria were investigated in this work. The above-mentioned VOCs result both from bacterial metabolic processes (pathogen-specific signals) and from the matrix (tissue samples themselves). The objective of this study was to investigate whether one could reliably identify various microorganism strains that exist inside infected tissue samples by direct monitoring of the headspace atmosphere above their cultures. Headspace samples were directly interrogated using a GC-MS system, which produced distinct profiles for samples contaminated with single bacterial strains or with multiple strains (mixed infections). Principal component analysis (PCA) and predictive analysis based on receiver operating characteristics curves (ROC) were the statistical procedures utilized for differentiating between infected and uninfected samples, while network analysis and heat-mapping were used to highlight the connections between emitted volatiles and infectious pathogens. By using ROC curves, obtained results demonstrated that the area under the ROC (95% probability interval) was 0.86 in case of infected samples and 0.48 for uninfected samples. On the other hand, PCA highlighted separation between components coming from infected and uninfected patients, where 67% of variance was described from the first 2 principal components. The biomarker chemicals documented from this work, as well as the developed methodology may ultimately be applied to identify bacterial infections by analyzing exhaled breath.
Export citation and abstract BibTeX RIS
1. Introduction
Different pathogenic bacteria have been shown to produce a wide range of volatile organic compounds (VOCs), some of them common for many bacterial strains and others specific for a single strain; the latter compounds can therefore be used as (bio)markers for identification of that particular strain [1–3]. Once identified in clinical samples, bacterial biomarkers may offer a valuable opportunity for developing new, rapid disease screening tools. Most of the studies on volatile biomarkers have been carried out on breath samples [4], plasma [5], urine [6], or feces [7]. Clinical approaches regarding gastrointestinal diseases, liver diseases or lung disorders [8, 9] and different types of cancer by using biomarkers' identification [9, 10] were often studied using GC-MS. However, limited progress has been made in the identification of microbial VOC detected from infected tissue compared with the topics mentioned above. Available approaches previously published only address decomposition of animal tissue [11, 12] or the understanding of human corpse decomposition from the point of view of forensic science [13].
The surgical-site infection is defined by the US Centre for Disease Control and Prevention as the infection occurring within 30 d after any operative procedure (or one year after implantation) and is one of the most common infections observed in health care centers, accounting for almost 20% of all infections in the period 2011–2012 [14]. Most wounds are colonized by several pathogens including both Gram-positive bacteria that produce enzymes and toxins (such as Staphylococcus aureus and Streptococcus pyogenes) and Gram-negative bacteria (like Pseudomonas aeruginosa) that are sometimes responsible for an extremely dynamic production of toxins and exopolysaccharides [14, 15]. A typical microbiological analysis includes time consuming pathogen isolation and identification. Therefore, the whole procedure is a great burden for the health care system, both from clinical and financial points of view.
Analytical techniques for detection and quantification of VOCs in clinical matrices have generated an increasing interest for their use in evaluating the diagnostic and screening potential for bacterial infection. The VOCs that can be detected quickly and identified directly from biological samples (like human tissue from infected wound) using analytical instrumentation may offer a valuable tool to detect bacterial infection. Finally, the efforts of scientists to prepare a bacterial biomarkers database, together with using adequate detection techniques may open an alternative way to a fast and non-invasive diagnostic tool, which ultimately will lead to a proper and early therapy.
Gas chromatography coupled with mass spectrometry (GC-MS) has been extensively used and improved for many decades. Now, GC-MS might be considered a gold standard for headspace analysis of highly volatile compounds. Solid-phase micro extraction (SPME) followed by GC-MS was proven to be a sensitive tool to identify and quantify VOCs in trace amounts [16]. For example, using SPME-GC-MS volatile emissions of Helicobacter pylori, a bacterium associated with gastric cancer were successfully detected [10], while Mycobacterium tuberculosis was identified in sputum samples [17].
Different mass spectrometry techniques, like selected ion flow tube-mass spectrometry (SIFT-MS) and proton transfer reaction mass spectrometry, have been used for direct on-line measurements of identified biological markers present in breath of patients, without using any pre-concentration method [18, 19]. SESI interfaced with high pressure ionization-mass spectrometers is another alternative used for real time analysis of biological samples [20–24].
Ion mobility spectrometry (IMS) and multi-capillary GC columns coupled to an ion mobility spectrometer (MCC-IMS) was also applied widely for detection of VOC compounds emitted from biological samples and for identification of human pathogenic bacteria. [25]. Sensors and e-noses are capable to detect and monitor individual, previously identified biomarkers and have a great potential for bacteria identification; however, as standalone instrumentation they are not very appropriate for chemical identification of VOCs profiles [26]. MALDI MS was successfully applied to many biological samples, including tissue sections. For example, MALDI MS was used for detection of Staphylococcus aureus from infected skin wounds. The experimental results highlighted the ability of MALDI to profile bacterial signals and to monitor host response to infection and wound healing over time [27, 28].
The aim of this research was to apply VOCs analysis directly to the clinical samples of infected tissues, with the purpose to identify the presence of the bacterial colonization and pathogens themselves. The major advantage of this approach comparing with analysis of cultured bacteria consists in the simplicity of sample preparation and, most importantly, in getting closer with real detected targets. Unfortunately, bacterial VOCs profiles from clinical samples have proven to be by far more complex as compared to the chemical profiles generated from bacteria growth in culture media, as an inherent consequence of the very complicated matrix and the poly-microbial nature of clinical samples. Our experience previously described, where in vitro cultivated bacteria were used [2, 3, 29, 30], strongly supports this statement. However, to detect pathogen-specific signals in the context of an infection remains a challenge, because cultivated bacteria do not faces the conditions encountered by microorganisms within the host and provide little insight into pathogenesis. The application of this work as a potential diagnostic tool for detection of bacterial infections directly from the real samples, of infected human tissues and integration of GC-MS technologies into clinical laboratories may have a positive impact on human health. The procedure described can be applied to other matrices like for example for analysis of breath, blood, urine, faces, or other types of biological samples.
2. Materials and methods
2.1. Instrumentation
All analyzes were performed on a mass spectrometer model Agilent 5975 Inert XL MSD coupled with a gas chromatograph model Agilent 6890 N (Agilent, Waldbronn, Germany) with split-splitless injector. The GC was equipped with a RTX-5 MS capillary column (Bellefonte, USA) 30 m × 0.25 mm × 0.25 μm. The oven temperature programme was as follows: the initial 40 °C were kept for 5 min, then ramped to 300 °C at 10 °C min−1 and kept for 5 min at 300 °C. The temperature of split/splitless injector was 240 °C. The splitless time was 2 min, while split ratio was 1:30. Helium was used as a carrier gas, at a flowrate of 1.1 ml min−1.
The MS analyzes were carried out in full scan mode, with scan range 30–300 amu. A scan rate of 3.4 scan s–1 was applied. Electron impact ionization (EI) at energy 70 eV was used for MS measurements. The ion source and transfer line temperatures were maintained at 280 °C and 250 °C, respectively. The acquisition of chromatographic data was performed by means of Chemstation software package (Agilent). The mass spectrum library NIST 2005 (Gaithersburg, USA) was applied to identification. PDMS/DVB coated fiber and PDMS/Carbowax (Supelco, Bellefonte, USA) were used for the SPME method. The fibers were cleaned in the thermo-desorber for 15 min, at 300 °C prior to each analysis. The screw top headspace glass vials with silicon/PTFE septa and caps were supplied by Supelco.
2.2. Sample preparation and analysis
All biological samples were individually taken from a surgical wound, during routine wound dressing changes, under aseptic conditions of dressing-rooms at the Department of General, Gastroenterological and Oncological Surgery of Collegium Medicum of NCU, according with the agreement number KB 730/2016, signed on 13 December 2016 by Ethical Committee Collegium Medicum from Bydgoszcz. A number of 17 volunteers, patients diagnosed with surgical-site infection based on typical clinical symptoms (general, local and in lab tests) were included into the study. Apart of those, 13 more volunteers, patients undergoing surgery were enrolled into the study to collect the uninfected samples. The patients' group was represented by 13 females and 17 males, with the age between 53 and 78 years old. There was no any death in the next 2 months of post-operative monitoring period of patients. Tissue samples were taken from sites located within the lower limbs. Each excised tissue has dimensions ca. 5 × 5 × 5 mm.
In case of infected tissues, the local anesthesia with 1%–2% lignocaine (Lignocaine hydrochloride) infiltration was used. Before and after removal of infected tissues a water solution of 'Octanisept' (composition: water, 2-phenoxy-ethanol and octenidine dihydrochloride) were used for wound cleaning. Healthy tissues (not infected) were taken from subcutaneous tissues of clean surgical wounds during small, elective surgical tissue resection procedures (i.e. open biopsies) performed under general or regional anesthesia (generally lignocaine together with propofol).
Finally a total number of 30 biological samples (17 samples of infected tissue and 13 samples of uninfected tissue) were collected from patients included into the study. When biological material was collected etiological factors of infection were unknown. A specimen of necrotic wound tissue has been taken using biopsy instruments during routine wound necrosectomy, transferred into a sterile microbiological container and labeled. At the same time a classic wound smear using a microbiological swab was collected and transferred as control material according to standards to the Department of Microbiology for routine identification (classical methods of bacteriological diagnostics). For the chromatographic analyzes, necrotic tissues were prepared in the same fashion and collected in sterile container, transported into the laboratory and analyzed in maximum 4 h after sample collection. Once arrived in the laboratory each sample was transferred to in a 20 ml glass vials crimped with silicon septa and incubated at 37 °C for 30 min. In the next step, the SPME was transferred into the glass vial over sample, through the septum, for a period of 45 min. After extraction the volatiles were desorbed in hot GC injector in splitless mode, held for 2 min. The whole work flow procedure is schematically presented in figure 1.

Figure 1. Onion chart diagram presenting the workflow procedure.
Download figure:
Standard image High-resolution image2.3. Statistical elaboration
Onion chart diagram, the bar graphs of components number, and the Heat-map were created using Microsoft Excel 2010. Network analysis was performed using R version 3.4.3. The IBM SPSS statistical software package version 21 was employed for running the Principal component analysis (PCA), Hierarchical cluster analysis, Correlation analysis and receiver operating characteristics (ROC) curves. Where applicable, Microsoft Power Point 2010 was used to label and combine the figures.
3. Results
3.1. Method optimization
Prior to analysis, optimization of the method was realized. Being a qualitative method, our interest into the number of detected peaks prevailed. Thus, two types of SPME fibers (PDMS/DVB and PDMS/Carbowax) suitable for both polar and non-polar components were tested. Firstly, clean fibers were exposed to the headspace of empty sterile vials and blank analyzes were run. The next step was the exposure of fibers to uninfected samples, followed by sample analyzes. Finally, we exposed the fibers to infected samples and we run the third set of analysis. Time exposure was 30 min for all three cases and the samples were taken in triplicate. The number of occurred peaks (calculated as a mean of three measurements) was considered as criteria for fiber selection. Hence, we found that PDMS/DVB fiber perform better that PDMS/Carbowax, statement confirmed by Purcaro et al which tested 5 types of fibers for sampling of VOCs produced by cell culture infected with the human respiratory syncytial virus. The authors proved that PDMS/DVB/Car fiber was the most suitable one for sampling of VOCs emitted by syncytial virus [31]. In the next step, necessary time exposure of fiber to the headspace was optimized. Headspace samples above infected tissue were collected in the range of 2–120 min (each time exposure was measured in triplicate) and thus we determined that the most convenient sampling time is 45 min. In figure 2, fiber selection (part A) and time exposure response (part B) are highlighted.
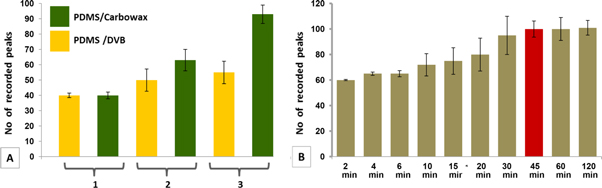
Figure 2. Bar graphs presenting SPME fiber type selection (A) and optimal sampling time determination (B), where: 1—SPME, 2—SPME + uninfected tissue, 3—SPME + infected tissue.
Download figure:
Standard image High-resolution image3.2. Obtained results
Some components resulted in a series of siloxanes, coming from plastic, septum rubber and SPME fiber degradation were further removed from obtained data after samples analysis. The healthy (uninfected) tissue samples collected were used as a control. The identity of each component in chromatograms was assigned using the NIST data base. The peaks with a Match Factor value more than 850 were the only considered. After peaks selection, logarithmic normalization was applied to the row data.
The VOCs emitted by tissue samples resulted in a total number of 75 compounds from different chemical classes coming from infecting pathogens and matrix. Table 1 presents the identified VOCs coming from the 13 patients without bacterial infection and 17 patients diagnosed with bacterial infection. Genders and age were available personal data to be disclosed and the infecting pathogen identity was established based on classical microbiological tests used in hospital.
Table 1. Compounds detected in infected samples.
| Patient ID | Compounds detected in tissue samples | Infecting pathogen |
|---|---|---|
| Patient 1, female, 67 years old | 1-pentanol (0.30 %), 2-butyl-octanol, (0.26 %), 2-ethyl-hexanol, (2.15 %), 2-nonanone (0.27 %), 3-methylheptyl acetate (1.24 %), 4-methyl undecane, (0.25 %).benzoic acid, ethyl ester (0.048 %), benzyl alcohol (0.05%), biphenyl (0.03 %), decane (0.15 %), dimethyl trisulfide (2.76 %), dimethyl disulfide (5.10 %), dodecane (1.89 %), eicosane (0.54 %), ethanol (4.58 %), indole (8.37 %), limonene (0.10 %), octadecane (0.10 %), octanal (0.02 %), phenylethyl alcohol (0.12 %), tetradecane (0.16 %), undecane (0.05 %). | E. coli |
| Patient 2, female, 67 years old | 1-pentanol (0.68 %), 2-ethyl-hexanol (6.10 %), 2-methyl-dodecane (0.23 %), 3-methylheptyl acetate (2.55 %), acetoin (1.01 %), benzaldehyde (0.36 %), benzyl alcohol (0.07 %), decanal (1.66 %), decane (0.55 %), dodecane (1.04 %), eicosane (1.28 %), hexadecane (0.11 %), indole (3.98 %), limonene (0.15 %), nonadecane (0.27 %), octanal (0.05 %), tetradecane (0.13 %), toluene (0.26 %), undecane (1.40 %). | E. coli + E. faecalis |
| Patient 3, male, 70 years old | 1-octanol (0.43 %), 2-butyl-octanol (0.11 %), 2-dodecanone (0.04 %), 2-ethyl-hexanol (3.56 %), acetoin (0.91 %), acetic acid (1.93 %), acetic acid, 2-ethylhexyl ester (1.12 %), benzeneacetaldehyde (0.03 %), benzoic acid ethyl ester (0.25 %), biphenyl (0.04 %), decane (0.17 %), dodecane (0.31 %), eicosane (0.22 %), ethanol (3.81 %) heptadecane (0.06 %), hexanal (0.22 %), limonene (0.05%), nonadecane (0.02%), octanal (0.03 %), tetradecane (0.05 %), toluene (0.28 %), undecane (0.32 %). | P. aeruginosa + E. coli |
| Patient 4, male, 74 years old | 1-butanol (0.21 %), 1-pentanol (0.07 %), 2-butyl-octanol (0.37 %), 2-ethyl-hexanol, (2.48 %), 2-heptanone (0.04 %), 2-nonanone (0.42 %), 4-methyl-octane (0.06 %), 4-methyl-undecane (0.36 %), acetic acid (2.18 %), acetic acid, 2-ethylhexyl ester (1.24 %), benzaldehyde (0.82 %), benzeneacetaldehyde (0.09 %), benzyl alcohol (0.06 %), biphenyl (0.07 %), decane (0.40 %), dimethyl disulfide (0.43 %), dodecane (2.57 %), eicosane (0.18 %), heptadecane (0.04 %), hexadecane (0.15 %), hexanal (0.36 %), indole (7.31%), limonene (0.10 %), nonadecane (0.04 %), nonanal (1.28 %), octadecane (0.09 %), octanal (0.21 %), pentadecane (0.19 %), phenol (7.02 %), tetradecane (0.38 %), tetrasulfide, dimethyl (0.02 %), undecane (0.81 %). | C. freundii + S. aureus |
| Patient 5, male, 71 years old | 1-octanol (0.08 %), 1-propanol (0.28 %), 2-dodecanone (0.64 %), 2-ethyl-hexanol (1.19 %), 2-nonanone (0.40%), 2-undecanone (1.1 %), 3-methyl-butanol (1.68 %), 4-methyl-undecane (0.06 %), acetic acid, 2-ethylhexyl ester (0.65 %), acetic acid (0.93 %), acetophenone (0.06 %), benzeneacetaldehyde (0.03 %), dimethyl disulfide (1.84 %), dimethyl trisulfide (2.25 %), benzyl alcohol (0.02 %), camphor (0.04 %), decanal (0.05 %), decane (0.25 %), dodecane (0.79 %), heptadecane (0.05 %), indole (5.65 %), limonene (0.06 %), nonanal (0.27 %), octanal (0.01 %), octanoic acid, ethyl ester (0.10 %), tetradecane (0.15 %). | P. mirabilis + P. aeruginosa |
| Patient 6 male, 59 years old | 2-dodecanone (0.04 %), 2-ethyl-hexanol (1.72 %), 2-undecanone (0.35 %), acetic acid (0.14 %), acetophenone (0.49 %), benzaldehyde (0.41 %), benzoic acid, ethyl ester (7.28 %), benzyl alcohol (5.06 %), camphor (0.11 %), dimethyl disulfide (0.60 %), dimethyl trisulfide (0.97 %), dodecane (0.51 %), isopropyl alcohol (3.52 %), tetradecane (0.06 %), toluene (0.29 %), | P. aeruginosa |
| Patient 7 male, 78 years old | 2-methyl-butanoic acid (0.32 %), 2-nonanone (0.03 %), 2-phenoxy-ethanol (3.27 %), 2-undecanone (0.12 %), 3-methyl-butanoic acid (1.41 %), 3-methyl-butanol (0.46 %), benzaldehyde (0.79 %), benzeneacetaldehyde (0.05 %), benzyl alcohol (0.05 %), chloroaniline (0.04 %), dimethyl disulfide (2.80 %), dodecane (0.14 %), dimethyl trisulfide (11.09 %), hexadecane (0.05 %), indole (16.31 %), nonanal (0.38 %), octanal (0.04 %), octanoic acid (0.18 %), pentanoic acid (0.11 %), phenylethyl alcohol (0.02 %), propofol (0.10 %), tetradecane (0.07 %), tetrasulfide dimethyl (0.71 %). | P. mirabilis |
| Patient 8 male, 69 years old | 1-hexanol (0.41 %), 2-ethyl-hexanol (3.95 %), 2-nonanone (0.23 %), 2-phenoxy-ethanol (2.08 %), 3-methyl-butanol (0.34 %), 4-methyl-phenol (1.85 %), 4-methyl-undecane, (0.31 %) acetic acid, 2-ethylhexyl ester (1.32 %), benzaldehyde (1.16 %), benzoic acid, ethyl ester (7.10 %), biphenyl (0.05 %), dimethyl disulfide (1.79 %), dodecane (2.66 %), eicosane (0.20 %), hexanal (0.19 %), indole (32.70 %), limonene (0.24 %), octanal (0.09 %), phenylethyl alcohol (0.02 %), phenol (15.65 %), tetradecane (0.58 %), tetrasulfide dimethyl (0.97 %), undecane (0.52 %) | M. morganii + S. maltophilia |
| Patient 9 male, 73 years old | 1-octanol (0.15 %), 2-ethyl-hexanol (0.07 %), 2-methyl-butanoic acid (0.13 %), 2-nonanone (0.04), 2-phenoxy-ethanol (1.96 %), 2 -undecanone (0.98 %), 3-methyl-butanoic acid (0.03 %), 3-methyl-butanol (2.16 %), acetic acid (0.31 %), acetophenone (0.28 %), benzeneacetaldehyde (0.07 %), butanoic acid (0.63 %), chloroaniline (0.23 %), dimethyl trisulfide (2.08 %), dimethyl disulfide (0.23 %), dodecane (0.46 %), hexanoic acid ethyl ester (0.44 %), indole (13.48 %), limonene (0.08 %), octanoic acid (0.11 %), octanoic acid, ethyl ester (0.06 %), pentadecane (0.14 %), phenylethyl alcohol (0.38 %), tetradecane (0.11 %) | P. mirabilis |
| Patient 10 female, 77 years old | 1-hexanol (0.45 %), 1-nonanol (0.08 %), 1-octanol (0.16 %), 1-pentanol (0.13 %), 2-butyl-octanol (0.08 %), 2-ethyl-hexanol (0.11 %), 2-methyl-butanoic acid (0.35 %), 2-nonanone (0.10 %), 2 undecanone (0.74 %), 3-methyl butanol (0.07 %), 3-methyl-butanoic acid (0.08 %), 4-methyl-phenol (0.14 %), acetic acid (0.37 %), benzoic acid ethyl ester (0.05 %), butanoic acid (0.18 %), dimethyl trisulfide (22.77 %), dimethyl disulfide (0.39 %), dodecane (0.17 %), hexanoic acid ethyl ester (0.22 %), indole (30.20 %), nonanal (0.08 %), pentanoic acid (0.07 %), phenylethyl alcohol (0.01 %), tetradecane (0.47 %), tetrasulfide dimethyl (8.77 %). | P. mirabilis + C. freundii |
| Patient 11 female, 64 years old | 2-dodecanone (0.63 %), 2-ethyl-hexanol (0.58 %), 2-phenoxy-ethanol (0.94%), 2-undecanone (0.11 %), acetic acid (0.13 %), acetophenone (9.39 %), benzyl alcohol (0.09 %), (%), dimethyl disulfide (0.86 %), dodecane (0.84 %), indole (4.10 %), isopropyl alcohol (1.02 %), limonene (1.78 %), tetradecane (0.17 %). | P. aeruginosa |
| Patient 12, female, 63 years old | 1-butanol (0.19 %), 1-pentanol (0.60 %), 2-ethyl-hexanol (4.97 %), 2-nonanone (0.87 %), 3-methylheptyl acetate (0.22 %), acetoin (0.93 %), benzaldehyde (0.32 %), biphenyl (0.03 %), decane (1.21 %), dimethyl disulfide (2.10 %), dodecane (0.02 %), indole (5.33 %), limonene (0.10 %), nonanal (0.11 %), pentadecane (0.32 %), tetradecane (0.06 %), tridecane (0.24 %), undecane (0.02 %). | E. coli |
| Patient 13, male, 63 years old | 1-hexanol (0.65 %), 2-ethyl-hexanol (0.75 %), 2-heptanone, (0.09 %), 2-nonanone (0.08 %), 2-undecanone (0.06 %), benzaldehyde (1.41 %), benzoic acid, ethyl ester (3.70 %), benzyl alcohol (0.97 %), dimethyl trisulfide (7.24 %), dimethyl disulfide (4.61 %), dodecane (0.12 %), eicosane (0.18 %), indole (4.15 %), limonene (0.42 %), phenol (16.51 %). | C. freundii |
| Patient 14 male, 53 years old | 2-ethyl hexanol (1.01 %), 2-nonanone (4.12 %), 2-undecanone (0.06 %), 3-methyl-butanol (12.54 %), benzaldehyde (0.69 %), benzoic acid, ethyl ester (1.44 %), benzyl alcohol (0.44 %), chloroaniline (0.65 %), decane (1.05 %), dimethyl trisulfide (1.96 %), dodecane (0.20 %), indole (0.31 %), limonene (0.67 %), phenol (12.68 %), phenylethyl alcohol (0.77 %), tetradecane (0.03 %). | C. freundii |
| Patint 15 female, 65 years old | 1-butanol (1.04 %), 2-ethyl hexanol (0.22 %), 2-methyl-butanal (2.05 %), 3-methyl-2-hexanol (1.21 %), 4-methyl pentanoic acid, (0.06 %), acetic acid (3.09 %), benzeneacetaldehyde (0.33 %), benzoic acid, ethyl ester (1.14 %), cyclohexanone (0.17 %), dimethyl disulfide (0.83 %), dodecane (0.10 %), hexadecanoic acid (0.17 %), hexanal (2.29 %), indole (13.50 %), limonene (0.48 %), tetradecane (0.10 %). | S. aureus |
| Patient 16, female, 55 years old | 1-nonanol (0.54 %), 1-octanol (0.13 %), 2-ethyl hexanol (0.32 %), 2-methyl-butanoic acid (0.15 %), 2-methyl dodecane (0.02 %), 2-nonanone (0.18 %), 2-undecanone (0.17 %), 3-methyl-2-hexanol (5.33 %), 3-methyl butanol (0.09 %), butanoic acid (0.78 %), chloroaniline (0.24 %), decane (0.91 %), dimethyl trisulfide (2.74 %), dimethyl disulfide (3.64 %), dodecane (0.35 %), ethanol (4.91 %), hexanol (0.79 %), indole (1.36 %), limonene (0.87 %), octane (1.22 %), pentanoic acid, 4-methyl (0.17 %), phenylethyl alcohol (0.14 %), tetradecane (0.07 %). | E. coli + P. mirabilis |
| Patient 17, female, 70 years old | 1-butanol (1.73 %), 1-hexanol (0.20 %), 2-methyl-butanal (1.35 %), 2-nonanone (0.13 %), 2-undecanone (0.08 %), 3-methyl-2-hexanol (1.21 %), acetic acid (1.99 %), benzeneacetaldehyde (0.13 %), chloroaniline (0.27 %), cyclohexanone (0.09 %), decane (1.51 %), dimethyl trisulfide (2.81 %), dimethyl disulfide (7.06 %), dodecane (0.51 %), ethanol (2.12 %), hexadecanoic acid (0.51 %), , indole (17.90 %), limonene (0.99 %), nonanal (0.23 %), pentanoic acid, 4-methyl (0.09 %), phenylethyl alcohol (0.02 %), tetradecane (0.40 %). | S. aureus |
| Patient 18 female, 59 years old | 1-decene (0.21 %), 1-dodecene (0.44 %), 4-methyl-octane (5.95 %), 4-methyl-undecane (2.25 %), dodecane (5.69 %), eicosane (0.99 %), limonene (0.69 %), octadecanal (0.21 %), octane (5.56 %), pentadecane (0.67 %), tetradecanal (0.30 %), undecane (13.91 %). | Uninfected tissue |
| Patient 19 male, 62 years old | 1-decene (0.34 %), 1-dodecene (0.45 %), 2-methyl-dodecane (0.11 %), 4-methyl-decane (0.73 %), 4-methyl-octane (9.32 %), decane (6.51 %), dodecane (13.12 %), eicosane (3.67 %), octane (1.90 %), propofol (0.56 %), tetradecane (0.13 %), undecane (8.42 %). | Uninfected tissue |
| Patient 20, female, 69 years old | 1-decene (0.41 %), 2-methyl-dodecane (0.29 %), 3-dodecene (0.53 %), 4-methyl-octane (6.31 %), dodecane (12.33), eicosane (1.45 %), limonene (0.50 %), octane (2.02 %), pentadecane (0.76 %), propofol (0.31 %), tetradecane (0.56 %), undecane (12.30 %). | Uninfected tissue |
| Patient 21, female, 67 years old | 1-decene (0.19 %), 1-dodecene (0.50 %), 3-dodecene (0.75 %), 4-methyl-decane (0.65 %), 4-methyl-octane (8.36 %), dodecane (8.21), eicosane (4.92 %), limonene (1.05 %), octadecanal (0.43 %), octane (2.43 %), pentadecane (0.10 %), propofol (0.86 %), tetradecanal (0.19 %), undecane (11.40 %). | Uninfected tissue |
| Patient 22, male, 61 years old | 1-decene (0.32 %), 1-dodecene (0.39 %), 2-methyl-dodecane (0.21 %), 4-methyl-decane (0.41 %), 4-methyl-octane (7.52 %), decane (3.27 %), dodecane (9.03 %), eicosane (2.43 %), limonene (0.78 %), octane (5.72 %), propofol (0.74 %), tetradecane (0.29 %), undecane (8.92 %). | Uninfected tissue |
| Patient 23 male, 68 years old | 1-decene (0.33 %), 3-dodecene (0.31 %), 4-methyl-octane (7.01 %), decane (5.62 %), dodecane (7.43 %), eicosane (1.81 %), hexadecane (0.18 %), limonene (0.90 %), octane (4.82 %), pentadecane (1.23 %), propofol (0.48 %), tridecane (0.21 %). | Uninfected tissue |
| Patient 24, male, 62 years old | 1-decene (0.30 %), 3-dodecene (0.29 %), 4-methyl-octane (6.41 %), decane (7.12 %), dodecane (10.59 %), eicosane (2.02 %), limonene (0.73 %), octane (0.91 %), propofol (1.42 %), tetradecane (0.70 %), undecane (10.03 %). | Uninfected tissue |
| Patient 25, male, 73 years old | 1-decene (0.20 %), 3-dodecene (0.26 %), dodecane (6.79 %), limonene (0.65 %), octane (3.31 %), pentadecane (0.24 %), propofol (1.12 %), tetradecane (0.36 %), tridecane (0.87 %), undecane (7.42 %). | Uninfected tissue |
| Patient 26, female, 58 years old | 4-methyl- octane (8, 67 %), decane (5.45 %), dodecane (8.09 %), eicosane (4.13 %), hexadecane (0.08), limonene (0.87 %), pentadecane (0.91 %), propofol (1.01 %), tridecane (0.19 %), undecane (8.95 %) | Uninfected tissue |
| Patient 27, male, 73 years old | 1-decene (0.40 %), 1-dodecene (0.44 %), 4-methyl-octane (6.89 %), decane (5.84 %), dodecane (11.50 %), eicosane (3.05 %), hexadecane (0.22 %), limonene (1.09 %), octane (4.01 %), pentadecane (0.82 %), tetradecanal (0.19 %), undecane (14.01 %) | Uninfected tissue |
| Patient 28, male, 59, years old | 1-decene (0.23 %), 1-dodecene (0.49 %), 2-methyl-dodecane (0.45 %), 4-methyl-decane (0.83 %), decane (4.92 %), dodecane (11.68 %), eicosane (1.90 %), limonene (1.18 %), octane (2.90 %), propofol (0.91 %), tetradecane (0.19 %), undecane (10.96 %). | Uninfected tissue |
| Patient 29, male, 72 years old | 1-decene (0.22 %), 1-dodecene (0.51 %), 4-methyl-decane (0.91 %), 4-methyl-octane (8.40 %), 4-methyl-undecane (2.18 %), decane (3.91 %), dodecane (13.09 %), eicosane (3.78 %), octane (7.04 %), propofol (0.85%), tetradecane (0.45 %), undecane (12.98 %). | Uninfected tissue |
| Patient 30, female, 68 years old | 1-decene (0.36 %), 1-dodecene (0.53 %), 4-methyl-decane (0.21%), 4-methyl-octane (5.98 %), decane (6.08 %), dodecane (12.75 %), eicosane (2.41 %), limonene (0.98 %), octane (4.95 %), propofol (0.54%), tetradecane (0.32 %), undecane (9.89 %). | Uninfected tissue |
The peaks relative areas expressed as percentages from the total chromatogram were calculated for each component and are presented into the brackets.
4. Discussions
4.1. General view of chemical profiles
A network analysis which presents the connection between patients and emitted volatiles allowed us to create an overview of the emitted VOCs profiles. Infected and uninfected patients lead into the formation of two clusters groups (group of infected patients, including patients from 1 to 17, clustered into the left-down part and group of uninfected patients, represented by patients with numbers 18–30, in the right-up part), as can be observed in figure 3. In addition, VOCs detected just in infected profiles have been dispersed around infected group, common components were located between the two groups, while chemicals detected just in uninfected samples were scattered into the right-up part (light diamonds).

Figure 3. Network analysis presenting the connection between patients (circles) and emitted volatiles (diamonds). Emitted volatile identities: (1) = 1-butanol, (2) = 1-decene, (3) = 1-dodecene, (4) = 1-hexanol, (5) = 1-nonanol, (6) = 1-octanol, (7) = 1-pentanol, (8) = 1-propanol, (9) = 2-butyl-octanol, (10) = 2-dodecanone, (11) = 2-ethyl-hexanol, (12) = 2-heptanone, (13) = 2-methyl-butanal, (14) = 2-methyl-butanoic acid, (15) = 2-methyl-dodecane, (16) = 2-nonanone, (17) = 2-phenoxy-ethanol, (18) = 2-undecanone, (19) = 3-dodecene, (20) = 3-methyl-2-hexanol, (21) = 3-methyl-butanoic acid, (22) = 3-methyl-butanol, (23) = 3-methylheptyl acetate, (24) = 4-methyl-decane, (25) = 4-methyl-octane, (26) = 4-methyl-phenol, (27) = 4-methyl-undecane, (28) = acetic acid, (29) = acetic acid, 2-ethylhexyl ester, (30) = acetoin, (31) = acetophenone, (32) = benzaldehyde, (33) = benzeneacetaldehyde, (34) = benzoic acid ethyl ester, (35) = benzyl alcohol, (36) = biphenyl, (37) = butanoic acid, (38) = camphor, (39) = chloroaniline, (40) = cyclohexanone, (41) = decanal, (42) = decane, (43) = dimethyl disulfide, (44) = dimethyl trisulfide, (45) = dodecane, (46) = eicosane, (47) = ethanol, (48) = heptadecane, (49) = hexadecane, (50) =hexadecanoic acid, (51) = hexanal, (52) = hexanoic acid ethyl ester, (53) = indole, (54) = isopropyl alcohol, (55) = limonene, (56) = nonadecane, (57) = nonanal, (58) = octadecanal, (59) = octadecane, (60) = octanal, (61) = octane, (62) = octanoic acid, (63) = octanoic acid, ethyl ester, (64) = pentadecane, (65) = pentanoic acid, (66) = 4-methyl pentanoic acid, (67) = phenol, (68) = phenylethyl alcohol, (69) = propofol, (70) = tetradecanal, (71) = tetradecane, (72) = tetrasulfide dimethyl, (73) = toluene, (74) = tridecane, (75) = undecane.
Download figure:
Standard image High-resolution imageWe assume that most of compounds presented in figure 3 are the metabolism products of bacteria; others are degradation products of mammalian and bacterial cells, or artifacts coming from the matrix (disinfection solutions, surfactants, anesthetics, etc). High individual variability in peaks area of compounds was found. Such phenomenon is related to several factors, among which: type of bacterial strain, variation in number of bacterial cells and their viability, type of tissue, etc.
Infected samples were collected after previous disinfection of the skin surrounding the wound with disinfectant (Octanisept) and rinsing of the wound with sterile water (aqua pro injection). 'Octanisept' which is a cationic surfactant containing: water, 2-phenoxy-ethanol and octenidine dihydrochloride. In contrast, uninfected samples have not been subjected to this process. This was the reason why, 2-phenoxy-ethanol was found sometimes into the headspace profiles of infected samples. Moreover, local anesthesia with 1%–2% lignocaine (Lignocaine hydrochloride) infiltration was used, but this could not be detected into the VOCs profile due to its low volatility (6.67 × 10⁻⁶ mm Hg at 25 °C). In some cases (for patients with general anesthesia), propofol (injection into a vein) was used. Consequently, propofol presence was notices sometimes into the VOCs profiles.
As a normal process, after a traumatic injury (like a surgery), and/or an infectious process an immuno-inflammatory response is initiated by the organism. Cytokines are regulatory peptides which play an important role in modulation of inflammatory process and repair procedure after a trauma. Perioperative cytokines can fluctuate by surgical trauma intensity, absence or presence of infectious process and category of anesthetic agents. It was found that anesthesia may reduce pro-inflammatory cytokine expression which is related to intracellular calcium concentrations alteration [32]; experimental results highlighted that propofol, which was used in case of some patients included in our study, for anesthesia and patient sedation has anti-inflammatory effects on inhibition of stimuli-induced such as interleukin and tumor necrosis factor-α production. Propofol also suppresses inducible NO synthase/ NO biosynthesis in endotoxin lipopolysaccharide, playing an important role in protection of multiple organ injuries in sepsis by reducing inflammatory cytokines production [33, 34]. Nevertheless, the authors of studies concluded that the effects of anesthetics on postoperative immune-inflammatory responses needs to be further investigated [31–33]. How and if all these processes may alter the pattern of volatiles compounds remains unknown and needs more future investigation.
4.2. Assessment and characterization of VOCs emitted by infected and uninfected samples
Volatiles emitted from infected clinical samples may have different genesis. They can be bacterial volatile metabolites, but also, they can be either pathogen-induced host responses related compounds [35], chemicals produced by endogenous enzymes [36] and putrefaction products [37].
Considering that the metabolites emitted by each bacterial strain are coming together in a particular combination of components and in different ratios, heat mapping statistical approach was used in order to check the differences between profiles of samples coming from patients infected with different strains and uninfected. A heat-map (created in Microsoft Excel 2010) combined with a dendrogram (created using IBM SPSS Statistics 21) is presented in figure 4. The dendrogram highlighted the formation of two separated categories of clusters: coming from infected and uninfected patients (P), respectively. Infected group presented different cluster modeling, according with each infecting pathogen. Thus, separated clusters were obtained for P13 and P14 infected with C. freundii, P6 and P11 contaminated with P. aeruginosa, while P1, P2, P3, P12 and P16 which had as common pathogen E. coli were clustered together. P7, P9, P15 and P17 infected with P. mirabilis or S. aureus clustered all together as well. An exception to this rule was noticed in case of P4, P5, P8 and P10, infected with C. freundii + S. aureus, P. mirabilis + P. aeruginosa, M. morganii + S. maltophilia, respectively P. mirabilis + C. freundii.
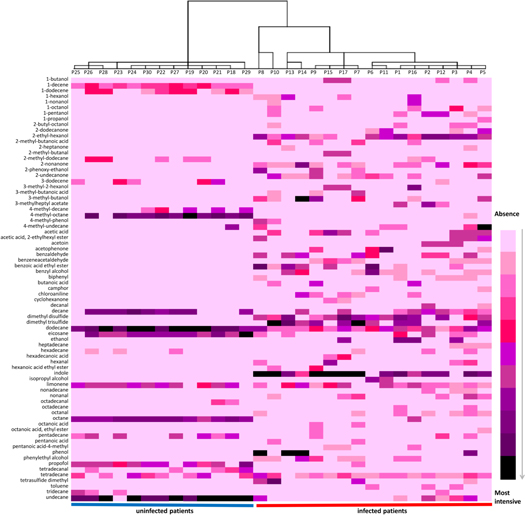
Figure 4. Heat-map of VOCs found in investigated samples.
Download figure:
Standard image High-resolution imageAll these findings suggest that discrimination between samples infected with different pathogens is possible and requests more future specific investigations. However, is worth mentioning that according to figure 4, the chemicals occurring in uninfected samples (mostly alkanes) have often appeared in infected samples as well.
Indole was one of the most intensive peaks characteristic for infected group. Although indole is a well-known marker of E. coli, in samples contaminated with S. aureus, P. mirabilis and M. morganii plus S. maltophilia the peaks area of indole was higher than in other samples, including those contaminated with E. coli. Dimethyl disulfide, 2-ethyl hexanol and acetoin peaks area was bigger in samples infected with E. coli. For dimethyl trisulfide, the largest areas were found in samples contaminated with P. mirabilis. While the highest peaks of 2-undecanone was predominant in those samples infected with P. mirabilis, samples infected with P. aeruginosa produced significantly more acetophenone than others. Phenol occurred more often in samples infected with C. freudii and M. morganii plus S. maltophilia than in others. Overall, smallest peak areas were observed for Patients 2, 3 and 6, while samples coming from patients 7, 8, 9, 10, 15 and 17 presented higher peaks area compared with others.
VOCs detected are coming from different sources as discussed before and from patients with specific features and medical history as well. Medical history remains confidential, as requested by patients, but genders and age were disclosed. Using IBM SPSS statistical package (version 21), a Pearson product-moment correlation analyzes was conducted to examine the relationships between genders, age, signal intensity (SI) (expressed as TIC—total ion current) and recorded peaks number (PN) of infected group in comparison with uninfected group. Correlation test highlighted that PN was more strongly positively related to infected group r(28) = 0.72, p = 0.01, compared with SI r(28) = 0.545, p = 0.01. In case of uninfected group, the values of PN and SI were negatively correlated and presented similar values. Nevertheless, PN was positively correlated with both SI r(28) = 0.365, p = 0.05 and age r(28) = 0.396, p = 0.05 for both infected and uninfected group. These findings indicated that PN explains more variability that does SI.
Further, discrimination among detected volatiles emitted by the two groups was investigated. The IBM SPSS statistical software package version 21 was employed for running the PCA loadings assigned to the variables (detected components). The loading plots presented in figure 5 demonstrate the discrimination between volatiles emitted by the two groups involved, where 67% of variance was described from the first 2 principal components. The identity of components presented in figure 5 (from C1 to C75) is similar with those exposed in figure 3 caption.
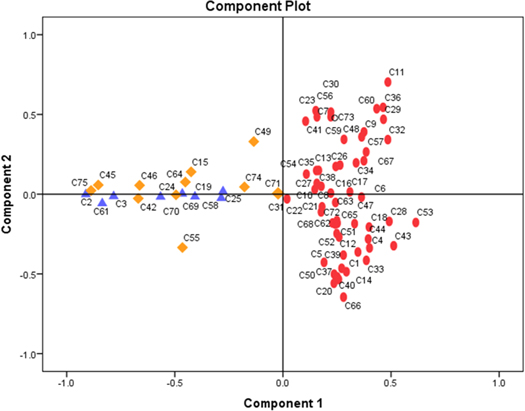
Figure 5. PCA plot presenting discrimination between volatiles emitted by infected and uninfected group enrolled into the study. Components emitted by uninfected group were highlighted with triangles, with diamonds common components between the two investigated groups, while the ellipsoidal dots are represented by the components emitted from infected samples.
Download figure:
Standard image High-resolution image4.3. Biological material decay and the occurrence of bacterial markers
Microorganisms, which play an important role in ecosystems, can degrade organic material according to their own metabolism, generating this way a large variety VOCs. Endogenous enzymes initiate the decay process immediately when the cells die. In case of resection, like immediately after the death moment of a living organism, in the amputated piece of tissue any connection with the donor organism ceases and this will initiate the lack of oxygenation, due to which notable physiological changes will take place. For example, glycogen will be degraded and lactic acid occurrence will take place in muscle, followed by pH decreasing [36]. Moreover, the oxidation of pyruvate to acetyl-CoA ceases, the citrate cycle stops, ATP levels decrease dramatically and this will eventually result in the inability of cells to repair their own membrane. The low pH suppresses the lipoprotein lipase activity and increases the activity of lysosomal acid lipase. The phospholipids from the cell membranes are decayed by phospholipases [36]; consequently, reactive oxygen species are formed, and they will react with lipids, amino acids and sugars resulting volatiles aldehydes, alcohols and alkenes [37].
Carbohydrates found in biological materials are important nutrition sources for microorganisms. Bacteria cells can transform glucose in pyruvate. Pyruvate is in turn fermented by bacteria to ethanol, acetic acid and other by-products, like butanoic acid, acetaldehyde, acetone, 1-propanol, 2-propanol or 1-butanol [38]. Formation of VOC, such as 3-methyl-1-butanol, 3-methylbutanal, and 3-methylbutanoic acid, can also be a consequence of amino acids decomposition [39]. For example, in the presence of bacteria, phenylalanine degradation yields to phenylethyl alcohol formation [40], tryptophan to indole [3], while cysteine and methionine lead to formation of volatile sulfur compounds (dimethyl disulfide, dimethyl trisulfide and dimethyl tetrasulfide) [41]. Fatty acids such as linoleic acid and arachidonic acid are typically present in intramuscular tissue and especially in lipid membranes [42]. The hydrolysis of triglycerides leads to formation of glycerol and fatty acids. Finally, glycerol degradation to pyruvate results in products such as 1-butanol, butanoic acid, acetone, ethanol, propionic acid, acetic acid, formic acid [38].
4.4. Possibility of using bacterial markers as diagnostic tool and shortcomings of our study
The applicability of VOCs emitted by bacteria and the possibility to use them for building screening tools that can confirm or deny the presence of a bacterial infection is a tempting and bright perspective. ROC curves, which can test and discriminate between two states of health, is a perfect approach for exploring test performance in analytical and clinical application. This model can be therefore employed for the general estimation of a diagnostic in absence of knowledge regarding true disease status. Thus, using ROC curves diagnostic ability based on detected VOCs was tested. The volatiles coming from infected samples were considered as positive markers, while those emitted by uninfected as negative. All common VOCs between infected and uninfected groups were excluded. A binary algorithm classifier, where larger test result indicated more positively test was used. The obtained results show that the area under the receiver operating characteristic (95% probability interval) was 0.86 in case of infected samples and 0.48 for uninfected samples, as seen in figure 6.

Figure 6. ROC curves used to predict bacterial infection in tissue samples.
Download figure:
Standard image High-resolution image
Since the predictive probabilities of infection were higher than 80% (AUC > 0.80) for infected samples, a good predictability of diagnosis accuracy can be stated. Nevertheless, the achievement of an excellent diagnostic supposes to obtain AUC > 0.90 [43, 44]. Some shortcomings that potentially could hinder this achievement, when emitted VOCs are involved in predictive analysis, will be discussed below.
Microbial density (number of cells), which is very difficult to be controlled in a biological sample, can significantly influence the metabolic pathways due to intra-specific interactions. Moreover, when a tissue is infected by more than one bacterial strain, ecological interactions between different strains, like mutualism or competition, may occur, which in turn can affect the pattern of volatiles released, and consequently the identity of some markers [45]. In case of co-infection some compounds resulted by bacterial metabolism of one strain can act and disturb the others. For example, dimethyl trisulfide, a common marker for some bacterial strains, is at the same time a growth inhibitor and thus it can affect bacterial metabolism of other strains. Another example is phenol, a compound with high antimicrobial activity [46]. Such compounds can inhibit bacterial division and their activity in general. Considering that in our study we included biologically infected samples that are coming from post-operative patients, previously treated with antibiotics, the presence of a complex mixture for example growth inhibitors, surfactants, anesthetics, bactericide or bacteriostatic compounds together can change the bacterial metabolism, resulting in some new, atypical compounds. Last, but not least, the environmental conditions—such as temperature, humidity, sample quantity, lack or abundance of oxygen—will affect the emitted volatiles. In this aspect we would assume that minimal errors were introduced.
5. Conclusions
The possibility of using volatile metabolites emitted by bacteria as a diagnostic tool is a promising perspective. The potential of discrimination between volatiles emitted by infected and uninfected tissue was proven through this study by applying PCA, where 67% of variance was achieved for first 2 components. Moreover, by constructing a dendrogram using Ward linkage, we observed the formation of two separated categories of clusters, coming from uninfected and from infected samples, respectively. Infected samples presented a different cluster modeling, according with the infecting pathogens. Each bacterial strain relieved a characteristic fingerprint of components, which was reflected in different quantities and combinations of VOCs, as highlighted by the heat-map. A good predictability of diagnosis accuracy, 86% for infected patients, was achieved when ROC curves were generated. Due to all factors mentioned above, at this level of investigations, bacterial markers coming from infected tissues can be used to confirm the presence or the absence of an infection. Therefore, the applicability as a screening tool, indicating if a sample is infected or not, is more than feasible. Nevertheless, additional fast and on-site spectrometry techniques can be used for the detection of biomarker compounds specific to bacteria, once they are known and confirmed by GC-MS. Hence, real time techniques for measurements of VOC can be used for on-site screening diagnostic, giving a positive or negative answer in a couple of minutes after sampling. The developed methodology and the emitted VOCs identified in this work may be applied and help into the identification of bacterial infections which can be detected by analyzing exhaled human breath as well. Starting from the key biomarkers detected, instrumentation used for fast screening of bacterial infection from various matrices can be developed.
Acknowledgments
This research did not receive any specific grant from funding agencies in the public, commercial, or not-for-profit sectors. The help provided by Dr Ryosuke Nakadai from University of the Ryukyus, Okinawa, Japan in preparation of the Network Analysis part, is greatly appreciated.
Conflict of interest
The authors declare that they have no conflict of interest.