
Abstract
The increasing demand for agricultural products and the uncertainty of international food markets has recently drawn the attention of governments and agribusiness firms toward investments in productive agricultural land, mostly in the developing world. The targeted countries are typically located in regions that have remained only marginally utilized because of lack of modern technology. It is expected that in the long run large scale land acquisitions (LSLAs) for commercial farming will bring the technology required to close the existing crops yield gaps. While the extent of the acquired land and the associated appropriation of freshwater resources have been investigated in detail, the amount of food this land can produce and the number of people it could feed still need to be quantified. Here we use a unique dataset of land deals to provide a global quantitative assessment of the rates of crop and food appropriation potentially associated with LSLAs. We show how up to 300–550 million people could be fed by crops grown in the acquired land, should these investments in agriculture improve crop production and close the yield gap. In contrast, about 190–370 million people could be supported by this land without closing of the yield gap. These numbers raise some concern because the food produced in the acquired land is typically exported to other regions, while the target countries exhibit high levels of malnourishment. Conversely, if used for domestic consumption, the crops harvested in the acquired land could ensure food security to the local populations.
Export citation and abstract BibTeX RIS

Content from this work may be used under the terms of the Creative Commons Attribution 3.0 licence. Any further distribution of this work must maintain attribution to the author(s) and the title of the work, journal citation and DOI.
Introduction
Feeding the growing human population in a world with finite land and water resources has become a major challenge for the humanity (Godfray et al 2010). Demographic growth (Godfray 2011), changes in diet (Tilman et al 2011) and the need to comply with new biofuel policies (EISA 2007, E U 2009) have increased the human pressure on agro-ecosystems and enhanced food insecurity (e.g., Johnston et al 2011, Cassidy et al 2013, Hermele 2014). The 2008 food crisis is symptomatic of a dependence on uncertain sources of food: in response to the escalating food prices (Godfray et al 2010, Fader et al 2013, FAO/OECD 2011) major exporting countries such as Russia, Indonesia, and Argentina restricted their exports, thereby causing food shortage in import dependent regions (Fader et al 2013). To react to this unreliability of international food markets, the governments of countries with adequate financial resources have started to invest in large tracts of agricultural land worldwide (Klare 2012, Hermele 2014). Their typical targets have been regions that, despite their relatively high crop yield potential, have remained only marginally exploited (Anseeuw et al 2012). Meanwhile, motivated by the increasing global demand for food, fiber and biofuels, and the consequent rise in food prices (Scheidel and Sorman 2012, Hermele 2014), some agribusiness companies have also started to recognize the attractive prospects of profitable investments in underperforming agricultural lands worldwide (e.g., Cotula et al 2011, Von Braun Meinzen-Dick 2009). With adequate investments these areas could dramatically increase their crop yields. Because of the lack of access to the financial resources required for such investments, local farmers are typically unable to improve crop yields (Godfray et al 2010, Godfray 2011). However, these potential bread baskets will not remain underexploited for too long. In fact, the increasing demand for food and other agricultural products is expected to be met by improving cropland productivity (i.e., closing the gap between actual and potential agricultural yields), rather than expanding the cultivated land at the expenses of rangelands, forests, or savannas (Foley et al 2011). Productive agricultural land is becoming an increasingly precious asset (Cotula 2012). It has been reported (Land Matrix 2013) that about 32.8 million ha have been acquired by international large scale investors for different purposes (i.e., agriculture, forestry, mining, industrial uses, and financial speculations), including 22 million ha for agriculture. The rate of large scale land acquisitions (hereafter LSLAs) hit a high point in 2009, but new investments in agricultural land are underway, as suggested by the number of intended deals or deals under active negotiation reported by the Land Matrix (The Land Matrix 2013, Anseeuw et al 2013).
These investments in agriculture often occur without the 'informed consent' of current land users, with no consideration of the societal and environmental impacts of the conversion from subsistence farming to large scale commercial agriculture, and without ensuring that the profits are shared with the local communities (ILC International Land Coalition 2011). For these reasons the process is often referred to as 'land grabbing' (ILC 2011). To our knowledge, an inventory of land deals that meet exactly the above definition does not exist. However, the Land Matrix (2013), keeps an updated record of LSLAs at different stages of the negotiation process (see methods section). We base our analyses on these LSLA data because they typically entail the conversion from smallholder farming or use by the local community (for agriculture or provision of other ecosystem services) to commercial use (Land Matrix 2013). We here focus on the case of land acquisition for commercial agriculture.
Many LSLAs are taking place in regions facing food security problems (Land matrix 2013, IFPRI International Food Policy Research Institute 2012, FAO, WFP and IFAD 2012) and in great need of food aid (FAO 2013, WFP World Food Programme 2013). For instance, between 2007 and 2012 LSLAs in the Pujehun district in Sierra Leone had a negative impact on local food and livelihood security (IFPRI 2012). The crops harvested in the acquired land were exported, while the local population was affected by loss of farmland, inadequate compensation for their land, and reduced access to food due to the increasing food prices. In Cambodia foreign direct investments in agricultural land are leading to the conversion of rice fields to sugar cane plantations and the relocation of peasants to less fertile land. Local Omlaing communities complained about food shortage and expressed concerns about their future (Shneider 2011).
Despite the recent interest in this phenomenon (Borras et al 2011, Cotula et al 2012 Rulli et al 2013), the amount of food that can be produced in the acquired lands remains poorly quantified (D'Odorico and Rulli 2013). In fact, most of the research on LSLAs has concentrated on the quantitative assessment of the land (Anseeuw et al 2012, 2013), the associated water resources and their geographic distribution (Rulli et al 2013, Rulli and D'Odorico 2013). Estimates of the number of people that could be fed by the crop production in the acquired lands are still lacking (D'Odorico and Rulli 2013). Here we quantify the amount of food commodities that can be produced in the acquired land. We evaluate their caloric content and calculate the number of people that could be fed under a variety of diet and crop yield gap closure scenarios.
Materials and methods
This analysis focuses on the effect of LSLAs on food availability without considering other aspects that are crucial to food security such as access to food and its quality (e.g., nutritional properties). We concentrate on the potential for food production in the farmland undergoing acquisition by large scale land investors. Presently, much of the acquired land has not been put under production (Land Matrix 2013). Moreover, for some crops maximum productivity is attained a few years after they are planted. The goal of this study, however, is to determine the maximum amount of food that can be potentially produced in the acquired land. Therefore, we assume that all the acquired land is readily cultivated with the crops reported by the Land Matrix (2013) (see table S1), without accounting for the fact that part of the land might be used for other crops or left temporarily uncultivated. Further, we focus on long term production conditions that in some cases will be reached only a few years after the crops are planted.
Data sources
Data on large scale investments in farmland were taken from the recently released (June 2013) Land Matrix database (Land Matrix 2013). The land deals included in this study are summarized in table S1 (see online supporting materials available at stacks.iop.org/ERL/9/064030/mmedia). This data set includes both international and domestic acquisitions of land parcels greater than 200 ha in the years subsequent to 2000, though most of the deals took place after 2008 (Anseeuw et al 2013). For every land deal the data set reported the area, the dominant crop, and whether a deal was concluded (i.e., with a signed or oral contract) or just intended (i.e., with an expression of interest or under negotiation). Here we considered only signed land deals for which the area included in the contract was reported, while land deals that are just intended but not signed were not included in our analysis. Based on the Land Matrix 2013 (accessed on June 2013) LSLAs with signed contracts account for about 60% of the total intended transboundary and domestic large scale land deals (Land Matrix 2013, Rulli and D'Odorico 2013). Moreover, 87% of the contract area (i.e., area of concluded deals only) is documented by government sources, corporate reports and contracts, policy and research sources (Land Matrix 2013). The rest of the contract area corresponds to land deals reported only by the press. South Sudan is the country with the greatest acquired agricultural area documented only by the media reports (4% of the total contract area considered in this study for the entire world) (Land Matrix 2013, accessed June 2013).
Estimates of agricultural yields were taken from Mueller et al (2012), who determined for each crop the country-specific yields for the year 2000, and calculated the increase in crop production under a variety of yield gap closure scenarios (50%, 75%, 90%, and 100%). These scenarios account for the increase in land productivity that could be attained through investments in irrigation and fertilizers. While various methods exist for the estimate of potential yields and yields gaps (van Ittersum et al 2013), here we refer to the work by Mueller et al (2012) because it is at the global scale, evaluates four different yield gap scenarios, and considers a relatively large number of major crops, including the food crops planted in the acquired lands (Land Matrix 2013, accessed June 2013).
For each land acquisition for agricultural use we considered the food crop(s) reported in the Land Matrix (Land Matrix 2013) data set.
Because rubber is often planted in land previously used for food crops and oftentimes oil palm is also cultivated in part of the farmlands acquired for rubber plantations, areas cultivated with rubber were assumed to be suitable for food crop cultivation and were also included in this study. The contribution to food production of all of these areas for which the crop type was either rubber or unspecified was evaluated assuming that these lands will be cultivated with the same food crops (and in the same proportions) that will be planted in the other lands acquired within the same country (based on Land Matrix 2013 data). Land acquisitions for which other crops not suitable for food production (e.g., jatropha, castor oil, pongamia pinnata, and fibers) are planned (Land Matrix 2013) were not included in this analysis. Likewise, land investments not clearly related to agriculture (e.g., for conservation, forestry, or tourism) and rangelands were not considered in this study.
Data analysis
The rate of food appropriation associated with large scale investments in agriculture was calculated in terms of calories by multiplying the land area by country-specific values of crop yields (mass of crop per unit area per year) (Mueller et al 2012) for the five scenarios (table S2); their byproduct was then multiplied by the corresponding crop caloric content (calories per unit mass), which was determined using data reported in the Food Balance Sheets (FAO Food and Agriculture Organization 2010) available up the year 2009.
We notice that the actual crop yields in the regions in which the land is acquired may greatly differ from the country average values used here. A more detailed analysis, however, is often prevented by the lack of information on the exact location of each land deal and in some cases even regional crop yields are not available. The Land Matrix (2013), however, has recently included in its data base some details on land deal location (e.g., the country province or region in which the land is located). Unfortunately, only in some cases it is possible to associate each land deal to its geographic area or region within the country and the corresponding crop yields. Comprehensive information on land deal location (Land Matrix 2013) and regional crop yields (FAO 2014) are available in the case of the Philippines and for some land deals for Mozambique. Therefore these two countries provide us with a unique opportunity to carry out a more detailed investigation and evaluate how the results of our study are affected by the use of country average yields instead of region-specific values. Moreover, LSLAs could also produce land use change both in term of crops change and of forest to agriculture conversion. To determine the land use change induced by LSLAs a detailed analysis is performed in another case study (Indonesia) by using data on land deals location and high resolution remote sensing observations (Hansen et al 2013a, Hansen et al 2013b) (figure S1).
The analysis of diet composition, food caloric content and vegetal to animal calories ratio were carried out using the Food Balance Sheets available for the years 2000 and 2009 (the most recent year currently available). In the case of oil palm the country specific production and yield of both processed palm and kernel oil were accounted for (FAO Food and Agriculture Organization 2010). In this study food calories are used as a metrics to quantify the nutritional potential of food commodities derived from crops planted in the grabbed land. We do not evaluate whether the relative abundance of those commodities constitutes a suitable diet with an adequate intake of the essential micronutrients.
To calculate the number of people that would be fed by the grabbed crops, two possible diets were considered, namely a 'balanced diet' (Falkenmark and Rockstrom 2006) and the current country-specific diet. In the case of the balanced diet each individual consumes on average 3000 kcal day−1 (FAO/WHO/UNU 2001), which consist of 2400 kcal day−1 (80% of the diet) from plant food and 600 kcal day−1 (i.e., 20%) from animal products (Rockstrom et al 2007). On average, 5–15% of the energy from plant food used by animals is transformed into animal calories (Smil 2001). Thus, r calories from vegetables are used on average to produce one calorie of animal food with r being here estimated for each country using the Food Balance Sheets (FAO Food and Agriculture Organization 2010) as the country-specific ratio between animal and feed calories. Therefore, because 600 × r kcal day−1 of vegetal food are required to produce 600 kcal day−1 of animal products, if r is equal to, say, 10 the per capita calorie consumption accounts for 600 × r + 2400 = 8400 kcal day−1 of total plant food. In the case of the current country-specific diet, the actual consumption rates of plant and animal food as reported by the FAO food balance sheets (FAO Food and Agriculture Organization 2010) were considered. The total amount of calories of plant food required to sustain these diets (named calorie equivalent in table S3) was then calculated using the same r ratio for the energy required to produce animal food from vegetal products (table S3). The ratio (r) expresses the amount of vegetal calories required to produce one animal calorie, based on the Food Balance Sheets. Thus, r depends on the type of livestock production (i.e., the ratio between feed fed and rangeland production) existing in each country, which is assumed to remain unchanged in all the gap closure scenarios.
Results
Based on the yields for the year 2000 (Mueller et al 2012), LSLAs for agriculture may entail an appropriation of 3.1 Mt y−1 of maize, 2.5 Mt y−1 of rice, 191.0 Mt y−1 of oil palm, and 170.0 Mt y−1 of sugar cane, worldwide (figure 1). With the complete yield gap closure the crops that could be harvested in the acquired land would increase up to 8.7 Mt y−1 (280% increase), 7.7 Mt y−1 (308% increase), 249.4 Mt y−1 (130% increase), and 252.0 Mt y−1 (148% increase), respectively (figure 1).
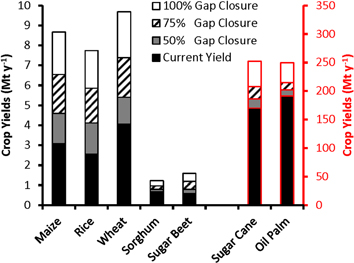
Figure 1. Expected rates of crop production for some of the major crops planted in acquired land worldwide. (Calculations are based on land deals data as reported by Land Matrix 2013 dataset, accessed on 20 June 2013). Crop yields values of bars with black or red outlines should be determined using the black (to the left) or red (to the right) axes, respectively.
Download figure:
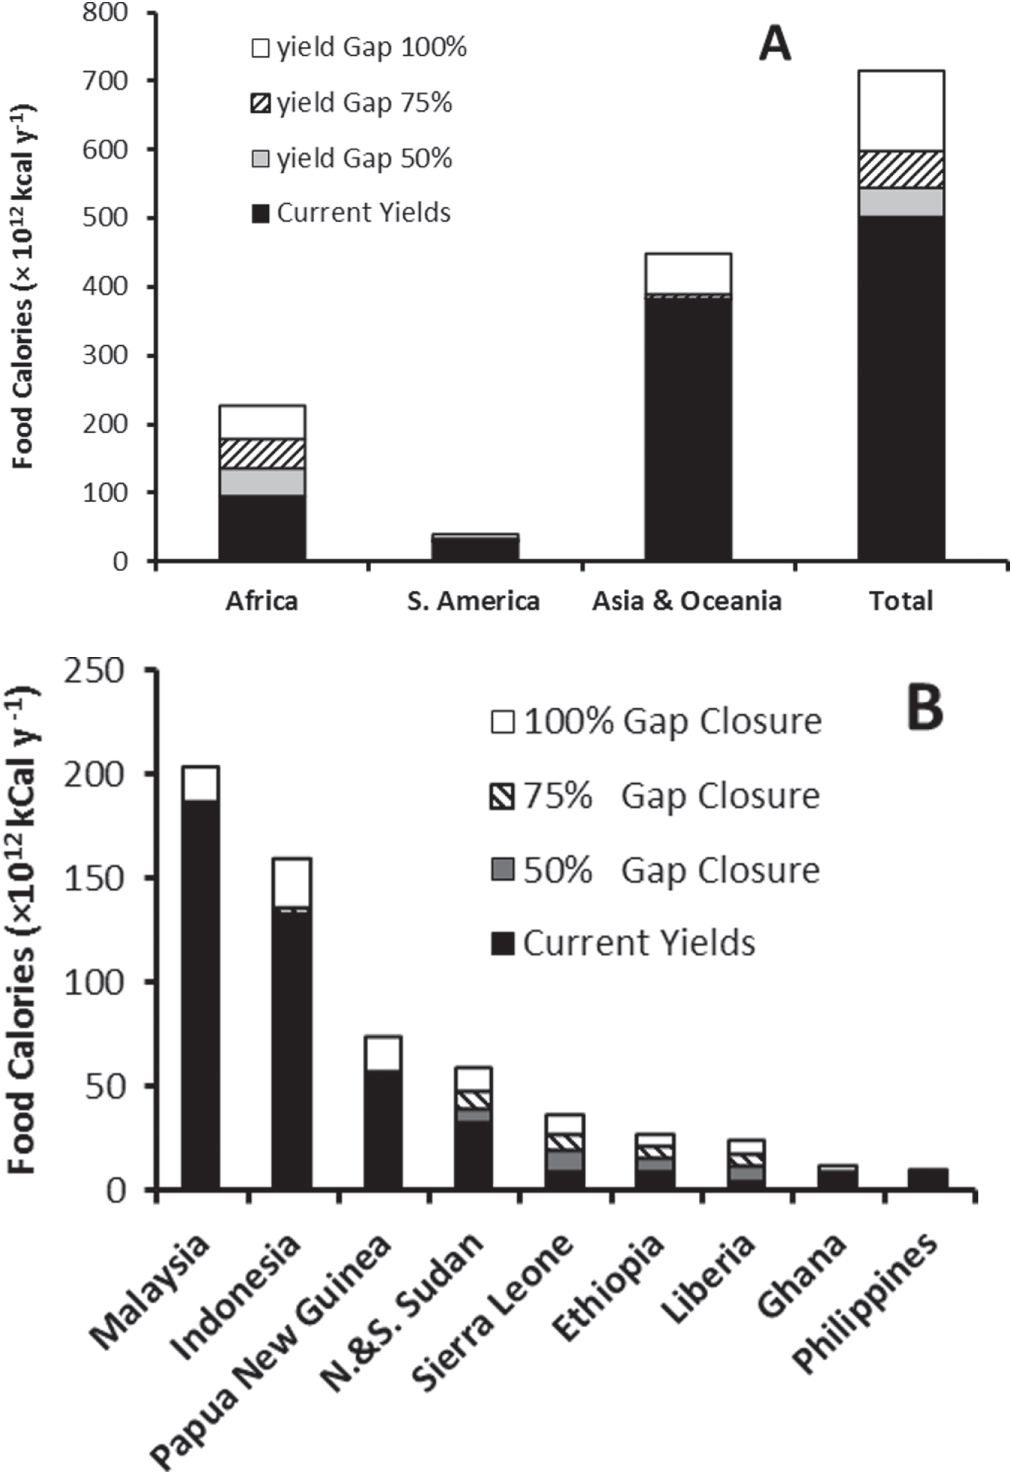
Standard image High-resolution imageWe use food calories as a metrics for the quantification of the nutritional yields of food crops without necessarily exploring the suitability of a diet contributed by the collection of crops planted in the acquired land. The amount of food that can be produced with all the crops cultivated in the acquired land accounts for 5.0 × 10¹⁴ kcal y−1, which increases to 5.4 × 10¹⁴ kcal y−1, 5.9 × 10¹⁴ kcal y−1, 6.5 × 10¹⁴ kcal y−1, and 7.1 × 10¹⁴ kcal y−1, under the 50%, 75%, 90%, and 100% gap closure scenarios, respectively (table S2). Interestingly, we find that in the 100% gap closure scenario about 53% of this food would be provided by Asian countries, although relatively high rates of food appropriation associated with LSLAs are expected to occur also in Africa (≈32%) and Oceania (≈10%, in Papua New Guinea) (figure 2(A)). Thus, despite their smaller yield gaps and the smaller area cultivated with food crops (table S1), farmlands acquired in Asia will likely produce more food than those in Africa. In fact, commercial farming in Asian countries appears to focus on crops that have higher food yields (cal ha−1).
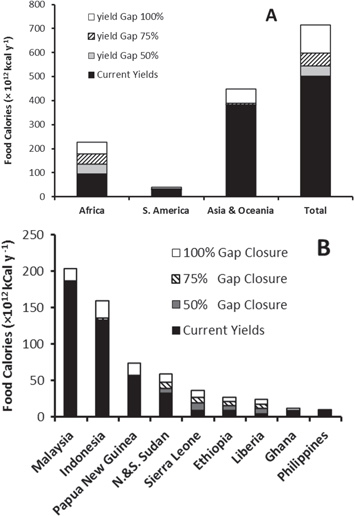
Figure 2. Amount of food calories that can be produced by the acquired lands. (A) By continent; (B) for the top nine countries. (Calculations are based on land deals data as reported by Land Matrix 2013 dataset, accessed on 20 June 2013).
Download figure:
Standard image High-resolution imageThe most targeted countries are Indonesia, Malaysia, Papua New Guinea, and the former Sudan, which, altogether, account for about 82% of the total food calories that can be produced by the acquired croplands worldwide (figure 2(B)). This result is due both to the high agricultural yield and high calorie content of the crops cultivated in the acquired land (Monfreda et al 2008, Mueller 2011, FAO 2009), as well as to the relatively large extent of the land acquired in these countries (Land Matrix 2013).
When all edible crops are assumed to be used as food, it is found that the acquired land could feed with a 'balanced diet' (see methods) a population of 371 million people (yields of year 2000) (table 1). Likewise, using the current rates of per capita food consumption reported for each of the target countries (table S3), we find that the acquired land could feed as many as 473 million people (yields of year 2000), which would increase to over 710 million at crops yield gap closure (table S4). The dramatic increase with respect to the 'balanced diet' scenario reflects the poor diets and high rates of malnourishment of most of the target countries (table S3).
Table 1. Number of people (in millions of individuals) that could be fed by the crops grown in the acquired land under different scenarios and assuming a 'balanced diet' of 3000 kCal d−1 per capita, with 20% of calories from animal products. (Calculations are based on land deals data as reported by Land Matrix 2013 dataset, accessed on 20 June 2013).
| All Calories | 50% Biofuels | Replacing Crops | ||||
|---|---|---|---|---|---|---|
| Target Country | Yields from year 2000 | 100% Gap Closure | Yields from year 2000 | 100% Gap Closure | Yields from year 2000 | 100% Gap Closure |
| Africa | ||||||
| Angola | 0.3 | 0.9 | 0.1 | 0.2 | 0.1 | 0.3 |
| Benin | 0.1 | 0.2 | 0.0 | 0.1 | 0.0 | 0.1 |
| Cameroon | 1.9 | 3.0 | 0.8 | 1.4 | 1.0 | 1.8 |
| Congo | 11.1 | 18.5 | 5.1 | 8.9 | 2.4 | 8.8 |
| Congo-D.R. | 2.4 | 10.3 | 1.1 | 4.7 | 0.4 | 1.1 |
| Ethiopia | 10.4 | 29.6 | 7.1 | 21.7 | 6.0 | 20.1 |
| Gabon | 1.4 | 3.3 | 0.7 | 1.7 | 1.0 | 1.5 |
| Ghana | 2.2 | 4.3 | 1.1 | 2.0 | 0.9 | 1.5 |
| Liberia | 2.4 | 13.4 | 1.2 | 6.5 | 1.9 | 6.7 |
| Madagascar | 1.4 | 3.9 | 0.6 | 1.7 | 0.6 | 1.8 |
| Morocco | 0.5 | 0.5 | 0.6 | 0.6 | 0.6 | 0.6 |
| Mozambique | 1.9 | 8.0 | 1.2 | 4.1 | 1.9 | 4.5 |
| Nigeria | 1.1 | 2.6 | 0.9 | 2.2 | 0.9 | 2.3 |
| Sierra Leone | 9.3 | 39.3 | 5.3 | 19.8 | 6.6 | 12.9 |
| Sudan & South Sudan | 36.6 | 65.4 | 26.2 | 52.6 | 23.8 | 52.6 |
| Tanzania | 3.1 | 5.1 | 1.5 | 2.9 | 2.8 | 5.2 |
| Uganda | 0.0 | 0.2 | 0.0 | 0.1 | 0.1 | 0.2 |
| Zimbabwe | 3.1 | 3.3 | 1.4 | 1.4 | 1.0 | 1.5 |
| Subtotal (Africa) | 89.2 | 211.7 | 54.8 | 132.6 | 52.0 | 123.4 |
| South America | ||||||
| Argentina | 3.2 | 4.3 | 3.5 | 4.7 | 3.5 | 4.7 |
| Brazil | 3.3 | 4.8 | 1.8 | 2.7 | 2.4 | 3.8 |
| Colombia | 5.1 | 6.3 | 2.5 | 3.2 | 2.4 | 3.7 |
| Guatemala | 1.2 | 1.2 | 0.5 | 0.5 | 0.2 | 0.2 |
| Paraguay | 2.5 | 4.9 | 2.1 | 4.0 | 2.8 | 5.3 |
| Perù | 1.1 | 1.2 | 0.5 | 0.5 | 0.4 | 0.4 |
| Uruguay | 1.8 | 3.3 | 1.6 | 3.0 | 1.6 | 3.0 |
| Subtotal (S. America) | 18.2 | 26.0 | 12.5 | 18.6 | 13.2 | 21.1 |
| Asia & Oceania | ||||||
| Indonesia | 87.5 | 105.1 | 47.5 | 57.0 | 42.4 | 51.7 |
| Malaysia | 119.6 | 132.2 | 64.6 | 71.4 | 58.9 | 70.4 |
| Philippines | 4.8 | 7.8 | 4.0 | 6.8 | 3.9 | 6.9 |
| Papua New Guinea | 51.6 | 67.3 | 25.5 | 33.3 | 17.8 | 28.1 |
| Subtotal (Asia & Oceania) | 263.5 | 312.5 | 141.6 | 168.5 | 123.1 | 157.1 |
| Eurasia | ||||||
| Russia | 0.2 | 0.4 | 0.1 | 0.4 | 0.1 | 0.4 |
| Subtotal (Eurasia) | 0.2 | 0.4 | 0.1 | 0.4 | 0.1 | 0.4 |
| Total | 371.0 | 550.6 | 209.0 | 320.1 | 188.5 | 302.7 |
It should be stressed, however, that some crops—especially sugar cane and oil palm—are often used for other uses (e.g., biofuel, cosmetics, etc) and only partly for food as reported in the FAO food balance sheet (FAO Food and Agriculture Organization 2010). Because these crops have high yield (tons ha−1) and produce food with high caloric content, including them in the food calorie count would produce an overestimate in the number of people fed. To account for this effect, we repeat the same calculations with two different assumptions: (1) only 50% of the sugarcane and oil palm crops are utilized for food production and included in the calculation of the number of people who could be fed. This could appear to be a high (and conservative) estimate; in fact, globally, only 20% of sugarcane is used for biofuel production (FAO/OECD 2011) while 24% of palm oil is used for industrial purposes (USDA 2010). We use here a higher estimate (50%) because biofuel demand is a major driver of LSLAs (Scheidel and Sorman 2012) and the fraction of cropland acquired for biofuels is expected to be much higher (58% of the LSLAs, based on older (2012) estimates reported by Hermele 2014), (2) in each country the amount of sugar cane and palm oil production that exceeds the country-specific fraction of calories that these commodities contribute to the average diet (FAO Food and Agriculture Organization 2010, WFP and IFAD 2012) is assumed to be used for biofuels. In this case, we assume that biofuels displace other food crops that were cultivated prior to the acquisition or would have likely been planted in the near future. To evaluate the loss of food that could result from this displacement, we replace these biofuel productions with other food crops in the same proportion in which they are planted in the acquired land (in the corresponding country). In the case of Malaysia, Zimbabwe and Gabon, however, biofuel crops were the only major cultivations. In these cases sugarcane and oil palm were replaced by rice, wheat and maize, and cassava and maize, respectively, based on information on the pre-existing crop types (e.g., Hermele 2014) and on the main crop cultivated and used in each of these countries (FAO Country profile 2013). The 50% biofuel and the crop replacement scenarios lead to comparable results. In fact, we found that in the 50% biofuel/crop scenario, 209 million people could be fed with a balanced diet, which increases to 320 million at gap closure (figure 3, table 1). With the current diet 261 million people could be fed by the acquired land (411 million at gap closure; see table S4). Likewise, if we assume that the oil palm and sugarcane crops used for biofuels are replaced by other food crops, we find that the acquired land could feed with a balanced diet about 188 million people (302 million at gap closure, table 1), while with the current diet it would feed 235 million people (387 at gap closure, see table S4).

Figure 3. Number of people who could be fed by the acquired land in the case of 'balanced diet', assuming a 50% biofuel use for oil palm and sugarcane, and considering different yield gap closure scenarios. (Calculations are based on land deals data as reported by Land Matrix 2013 dataset, accessed on 20 June 2013).
Download figure:
Standard image High-resolution image
Detailed analyses accounting for region-specific yields (FAO Food and Agriculture Organization 2014) within the Philippines (table S5) and Mozambique (table S6) favorably compare with the results based on average country values (tables S5 and S6). Using local/regional yields (table S7 and S8) the estimates of the total calories and number of people fed increase by 27% in the case of the Philippines and 23% in the case of Mozambique, indicating that the acquired land is typically located in fertile areas with above-average productivity. This analysis has been carried out considering only the land deals for which the location, crop type and regional yield are available.
Data on land deal location can also be used to determine the land use type prior to the acquisition. It has been reported that in many cases the land was either not cultivated at its full potential (Land Matrix 2013) or not even cultivated at all. In the case of Indonesia we have found that LSLAs target forests that are subsequently cleared and converted into agricultural land (figure S1). Through a detailed analysis of high resolution (30 m × 30 m pixels) remote sensing observations (Hansen et al 2013a, Hansen et al 2013b), LSLA data sets (Land Matrix 2013), and land registry records (World Resources Institute 2014), we were able to verify whether the acquired farmlands are located in recently deforested areas. We have found that in Indonesia about 70% of the recent (2008–2013) LSLAs have been recently (2008–2012) deforested (figure S1, table 9).
Discussion and conclusions
LSLAs for agriculture are the subject of an ongoing debate on whether these investments will benefit only agribusiness corporations or also the local populations (Klare 2012, Toft 2013). It has been argued that, while the previous land users lose access to the land and its products, these investments will generate new jobs and bring new knowledge and infrastructures that will benefit the local population (Toft 2013). On the one hand, foreign governments and commercial farming companies maintain that the acquired land is often underutilized and investments in modern agricultural techniques could burst its productivity; because the local populations often cannot afford these investments, there is the need for external corporations. On the other hand, it has been shown that investors seldom live up to the expectations, and that in many cases the host communities would have been better off without these large scale investments (Klare 2012). Crucial to this debate is the argument that LSLAs implicitly entail the appropriation of food crops that could be used locally to abate malnourishment in the target countries. Three important points, however, need to be quantified in order to better evaluate these opposing arguments: (i) the amount of food crops that—even without major investments in modern technology—could be produced by the acquired land; (ii) the increase in crop production that could result from the closure of the yield gap in the grabbed land; and (iii) the number of people who could be fed by these crops both under current conditions and at gap closure. This paper has provided the first quantitative assessment of the appropriation of food crops associated with LSLAs under different yield gap closure scenarios.
Focusing on the two conservative scenarios (1) only 50% of the sugarcane and oil palm crops are utilized for food production; (2) biofuel crops replaced with food crops) it is shown that the total closure of the yield gap possibly afforded by large scale agribusiness investments would enhance global food security with an increase in food production that, depending on the diet scenario, could support about 110 to 150 million people in addition to the baseline of 190 to 260 million people that can be fed with the crop yields for the year 2000 (table 1, S4). These figures are in overall agreement with indirect estimates by (D'Odorico and Rulli 2013) based on water grabbing and water footprint calculations. With the current rates of large scale investments in agriculture (Land Matrix 2013), these figures are likely to increase over the next few decades.
LSLAs may have major implications on global food security for the following reasons: (a) these investments in agriculture could contribute to a global increase in food production if they accelerate the closure of the yield gap in countries where crop yields were stagnating (e.g., Von Braun Meinzen-Dick (2009), Cotula 2009, Deininger and Byerlee 2011, Messerli et al 2013, D'Odorico and Rulli 2013), (b) LSLAs offer great opportunities for profitable investments in agriculture, a strategic and crucial sector in a world with constantly increasing food demand (Tilman et al 2011, Suweis et al 2013). As a result, they may promote the production and transfer of substantial amounts of food commodities from production regions to distant populations who can afford them; (c) these acquisitions reduce the redundancy of our life supporting system (D'Odorico et al 2010) by enhancing the exploitation of the world's agricultural land. As a result, less untapped resources are left available to the current and future generations as a safety margin to face adverse conditions due to climate change or land degradation; (d) at the same time, LSLAs would exclude the local population from the access to potentially highly productive agricultural land that, even without major investments, could produce enough food to sustain about 190–235 (minimum number depending on the diet) million people. These numbers raise some concerns because LSLAs often occur in countries with high rates of malnourishment and demographic growth (table S3). While there are some pros in the increase in agricultural production that could result from large scale investments, some measures should be in place to ensure that the benefits are shared with the local populations (D'Odorico and Rulli 2013, Toft 2013, Cotula 2013).
Acknowledgement
The authors thank the Land Matrix partnership for making publicly available their updated data set of large scale land acquisitions. P D gratefully acknowledges support from the John Simon Guggenheim Memorial Foundation Fellowship Program. M C R gratefully acknowledges support from the ENEL Foundation and Polisocial.