

Abstract
Mitigation of the urban heat island (UHI) effect at the city-scale is investigated using the Weather Research and Forecasting (WRF) model in conjunction with the Princeton Urban Canopy Model (PUCM). Specifically, the cooling impacts of green roof and cool (white/high-albedo) roof strategies over the Baltimore-Washington metropolitan area during a heat wave period (7 June–10 June 2008) are assessed using the optimal set-up of WRF-PUCM described in the companion paper by Li and Bou-Zeid (2014). Results indicate that the surface UHI effect (defined based on the urban–rural surface temperature difference) is reduced significantly more than the near-surface UHI effect (defined based on urban–rural 2 m air temperature difference) when these mitigation strategies are adopted. In addition, as the green and cool roof fractions increase, the surface and near-surface UHIs are reduced almost linearly. Green roofs with relatively abundant soil moisture have comparable effect in reducing the surface and near-surface UHIs to cool roofs with an albedo value of 0.7. Significant indirect effects are also observed for both green and cool roof strategies; mainly, the low-level advection of atmospheric moisture from rural areas into urban terrain is enhanced when the fraction of these roofs increases, thus increasing the humidity in urban areas. The additional benefits or penalties associated with modifications of the main physical determinants of green or cool roof performance are also investigated. For green roofs, when the soil moisture is increased by irrigation, additional cooling effect is obtained, especially when the 'unmanaged' soil moisture is low. The effects of changing the albedo of cool roofs are also substantial. These results also underline the capabilities of the WRF-PUCM framework to support detailed analysis and diagnosis of the UHI phenomenon, and of its different mitigation strategies.
Export citation and abstract BibTeX RIS

Content from this work may be used under the terms of the Creative Commons Attribution 3.0 licence. Any further distribution of this work must maintain attribution to the author(s) and the title of the work, journal citation and DOI.
1. Introduction
Cities are known to be hotter than the rural areas that surround them; this phenomenon is called an 'urban heat island' (UHI). UHIs have been studied for decades (see Oke 1982, Arnfield 2003 for reviews) and have been shown to be caused by many factors including the extensive use of man-made materials such as asphalt and concrete in urban areas, which results in the reduction of evapotranspiration and in greater heat storage capacity (Grimmond 2007, Oke 1982). Given the soaring urban populations all over the world and the important environmental, energy and health implications of UHIs (Grimm et al 2008), they are receiving increasing attention from scientists as well as planners and policy makers. Furthermore, global climate change is expected to exacerbate the heat conditions in urban environments. A recent study has shown that heat waves, which are projected to become more frequent and last longer under a warming climate, interact nonlinearly with UHIs to produce extremely high heat stresses for urban residents (Li and Bou-Zeid 2013).
Several mitigation strategies aiming to reduce UHIs have been proposed in the literature such as the use of green roofs and cool roofs. While both strategies reduce the sensible heat available for transmission to the air or to building envelopes, the mechanisms for green roofs and cool roofs to reduce UHIs are different. A green roof increases the evapotranspiration in urban areas through soil and plants on rooftops (redirecting available energy to latent heat), while a cool roof increases the reflection of incoming solar radiation in urban areas by increasing the albedo of roof surfaces. These mechanisms can be further illustrated by considering the one-dimensional energy balance for an infinitesimally-thin layer of roof material at the roof-air interface, which can be expressed as:

where Rn is the net radiation (i.e., the driving energy flux at the surface, see equation (2)); H is the sensible heat flux and is the major source of heat into the atmosphere (when H > 0); LE is the latent heat flux into the atmosphere (when LE > 0) resulting from soil evaporation and/or plant transpiration (i.e., evapotranspiration); and G is the heat flux into the buildings or the heat storage (when G > 0). Rn is calculated as:

where SWin and SWout are the incoming and outgoing shortwave radiation fluxes, respectively. The outgoing shortwave radiation is usually expressed as a fraction α of the incoming shortwave radiation, and this fraction α is called albedo. LWin and LWout are the incoming and outgoing longwave radiation fluxes, respectively. When Rn > 0, the radiation flux reaching the surface is larger than that leaving the surface and the surface has a net input of radiant energy that will be partitioned between the three terms on the right-hand side of equation (1). The essence of the green roof strategy is to increase the latent heat flux LE relative to the sensible heat flux H for a given net radiation Rn (see equation (1)), while the essence of the cool roof strategy is to increase the albedo and thus reduce the net radiation Rn (see equation (2)). Both ultimately aim to reduce the sensible heat flux H (to reduce the heating of urban atmosphere) and to reduce the heat storage G (to reduce building cooling loads as well as the nighttime urban heating that occurs when this stored heat is released).
Most previous studies assessing the impacts of these strategies are based on building-scale field or numerical experiments at various locations over the world (see e.g., Eumorfopoulou and Aravantinos 1998, Jaffal et al 2012, Jim and Peng 2012, Li et al 2013b, Sun et al 2013, 2014, Susca et al 2011, Takebayashi and Moriyama 2007, Wong et al 2003). The impacts of different mitigation strategies observed at the building-scale cannot be simply upscaled to a city or a metropolitan area due to the substantial influence of surface heterogeneity on land-atmosphere exchanges (Bou-Zeid et al 2004, Bou-Zeid et al 2007, Brutsaert 1998). More importantly, a simple upscaling from building-scale to city-scale cannot capture the reduction in outdoor urban air temperatures that can be attained and cannot account for the feedbacks between ambient air temperatures/humidities and the surface energy balance.
A few studies used regional climate models to investigate large-scale effects of surface modifications in urban areas (see e.g., Synnefa et al 2008, Taha et al 1999, Millstein and Menon 2011). However, the urban surface parameterization remains crude in the numerical models used in these studies. Some recent studies used more sophisticated urban parameterizations (see e.g., Taha 2008a, 2008b, 2008c, Krayenhoff and Voogt 2010) but have focused primarily on the cool roof strategy and have assumed the penetration rate is 100%. There are also studies that have explored the impact of cool roofs at global scales using coarse-resolution simulations with global climate models (e.g., Jacobson and Ten Hoeve 2012, Oleson et al 2010, Akbari et al 2012, Irvine et al 2011) or simple scaling arguments (Akbari et al 2009). These studies also do not adequately resolve the surface heterogeneity in urban environments or the complex physics occurring in urban canopies.
As such, the question of what impacts will these UHI mitigation strategies have at the city scale remains an open yet extremely critical question, particularly because mitigation actions are usually organized and implemented at the city scale. A related question is how do these impacts scale as the penetration rate of these mitigation strategies increases? This is important to assess given the ongoing gradual implementation of cool and green roofs in various cities. For example, the city of Chicago has implemented both green roof and cool roof strategies over the last two decades (Mackey et al 2012). The Baltimore-Washington metropolitan area is one of most ambitious regions in implementing the green roof strategy (Green Roofs for Healthy Cities (GRHC) 2012), while New York City initiated the NYC °CoolRoofs program to encourage and assist building owners to apply a reflective white coating to their rooftops (NYC °CoolRoofs 2012).
Accurately estimating the city-scale impacts of these mitigation strategies is difficult largely due to the impracticality of controlled city-scale experiments (the mitigation efforts listed above are largely uncontrolled and unmonitored at the city-scale) and the lack of appropriate numerical tools to resolve surface heterogeneities in urban environments. In this study, we use the Weather Research and Forecasting (WRF) model in conjunction with an improved urban canopy model (UCM, hereafter PUCM due to its development at Princeton University, see Wang et al 2013 for model details and offline, not coupled to WRF, validation), which adequately resolves the surface heterogeneity effects in urban canyons. The coupled WRF-PUCM framework has been validated in a companion study (Li and Bou-Zeid 2014) and in a previous study (Li and Bou-Zeid 2013), and has been shown to be capable of reproducing, qualitatively and quantitatively, the key features of the UHI effect in this region. More importantly, it allows investigations of different mitigation strategies, with different penetration rates, and is thus well-suited for our study.
Following Li and Bou-Zeid (2013, 2014), the study period is a heat wave that lasts from 7 June to 10 June 2008. The study area is the Baltimore-Washington metropolitan region in the United States. The large-scale atmospheric conditions are characterized by a stagnant high-pressure system that is centered over Georgia and South Carolina (see figure S1 in the supplementary material). The impact of the heat wave conditions extends further north to the Baltimore-Washington area (the black square in figure S1). In such circumstances, mitigation strategies are critically needed due to the nonlinear interactions between UHIs and heat waves, which create extremely high heat-related risks in urban environments (Li and Bou-Zeid 2013). The three questions that are to be answered in this paper are: (1) what impacts would green roof and cool roof strategies have over the Baltimore-Washington metropolitan area under such extreme heat conditions? (2) How do these impacts scale as the penetration rate of these mitigation strategies increases? 3) What factors control the impacts of these mitigation strategies? The paper is organized as follows: section 2 presents briefly the WRF-PUCM set up and the numerical experiments; section 3 presents the findings and results. Section 4 concludes the study and discusses the implications of the findings.
2. Methodology
2.1. WRF model description and setup
WRF is a non-hydrostatic, regional climate model that solves the conservation equations of mass, momentum and energy on terrain-following coordinates (Skamarock and Klemp 2008). It has been widely used to study urban meteorology and hydrology (e.g. Chen et al 2011, Li et al 2013a, Talbot et al 2012). In this study, WRF version 3.3 is used. WRF has multiple parameterization schemes for each of its five physical packages: cumulus clouds, microphysics, radiation, planetary boundary layer (PBL), and surface (Skamarock and Klemp 2008). A companion study (Li and Bou-Zeid 2014) has examined the sensitivity of UHI modeling to some of these physical parameterizations such as the PBL schemes, thermal roughness length parameterizations, and UCMs. In this study, an optimal set-up based on the study of Li and Bou-Zeid (2014) is used. The physical parameterization schemes that are used in this study include: (1) the rapid radiative transfer model scheme for longwave radiation; (2) the Dudhia scheme for shortwave radiation; (3) the 2D Smagorinsky scheme for horizontal diffusion; (4) the Noah land surface model for non-urban surfaces; (5) the Mellor−Yamada−Janjic PBL scheme and the modified Zilitinkevich relationship for thermal roughness length parameterization (Chen and Zhang 2009); (6) the PUCM (see Wang et al 2013 for model details), along with calibrated thermal surface properties as detailed in Wang et al (2013). Cumulus parameterization was not used for any of these domains. The initial and boundary conditions for the WRF simulations are taken from the North American regional reanalysis (NARR; details can be found on http://www.emc.ncep.noaa.gov/mmb/rreanl/ and on http://rda.ucar.edu/datasets/ds608.0/).
The PUCM and the calculations of urban surface and near-surface air temperatures are detailed in Li and Bou-Zeid (2014) and are briefly described here. In the WRF-PUCM framework, any grid cell whose dominant land use category is one of the three urban categories (i.e., low density residential urban, high density residential urban, and industrial/commercial urban) will be treated as an urban grid cell. As illustrated in figure 1, which is a schematic of the PUCM, an urban grid cell will first be partitioned into two parts: an impervious fraction (to the left of the dashed black line in figure 1) and a vegetated fraction (to the right of the dashed black line in figure 1), as with other UCMs. The urban morphological details used in this study for the three urban categories, which are kept equal to the default urban morphologies of WRF, are provided in table 1. In particular, for an urban grid cell that is classified as low-density residential urban, 50% of the grid cell will be treated as impervious surface. For urban grid cells that are classified as high-density residential urban and industrial/commercial urban, 90% and 95% of the grid cell will be treated as impervious surface, respectively (Chen et al 2011).

Figure 1. A schematic of an urban grid cell in the WRF-PUCM framework. It includes two parts: the impervious part (left of the vertical dashed line) and the vegetated part (right of the dashed line). za is the height of the first level in the atmospheric model, zr is the height of the roof, zcan is the height at which the canyon aerodynamic temperature is calculated. The subscripts 'r' and 'g' indicate roof and ground, respectively. The roofs can be composed of a combination of green/cool roofs and conventional roofs. The ground can be composed of a combination of asphalt, concrete and urban grass (which in our simulations cover 50%, 30% and 20% of ground surfaces, respectively). Tr1 and Tr2 represent the surface temperatures of two different roof subfacets while Tg1, Tg2, Tg3 represent the surface temperatures of three different ground subfacets. Twall is the wall surface temperature and Tbuilding is the temperature of the building interior, which is held constant at 20 °C during the simulation period. Tveg is the surface temperature of the vegetated surface that lies outside of the canopy (parks for example). Hr1 and Hr2 are the sensible heat fluxes from the two different roof subfacets into the atmosphere, respectively. Hcanyon is the sensible heat flux from the canyon into the atmosphere. Hveg is the sensible heat flux from the out-of-canyon vegetated fraction into the atmosphere. Groof and Gwall are the heat fluxes into the buildings through the roof and the wall, respectively. Roof and wall thicknesses and the hygrothermal properties of all materials are as determined and calibrated in Wang et al (2013) for urban areas in the Northeastern US.
Download figure:
Standard image High-resolution imageTable 1. Urban morphology for the three different urban categories (same as WRF defaults).
| Industrial/commercial urban | High density residential urban | Low density residential urban | |
|---|---|---|---|
| Impervious surface fraction (fimpervious, %) | 95 | 90 | 50 |
| Mean building height (h, m) | 10 | 7.5 | 5.0 |
| Roof width (R, m) | 10 | 9.4 | 8.3 |
| Road width (Rd, m) | 10 | 9.4 | 8.3 |
| Roof fraction of the impervious part (froof = R/(R + Rd), %) | 50 | 50 | 50 |
| Canyon fraction of the impervious part (fcanyon = 1 − froof, %) | 50 | 50 | 50 |
| Roof fraction in the whole urban grid(=froof × fimpervious, %) | 47.5 | 45 | 25 |
Also like other UCMs, PUCM has three main facets: roof, wall, and ground. However, PUCM has the added ability to simulate subfacets consisting of different materials, which is key to enable a realistic investigation of UHI mitigation strategies. With the default UCM that is publicly available to all WRF users, all facets in the city would have homogeneous properties. In PUCM, however, a roof surface can be a combination of a conventional roof and a green/cool roof; a ground surface can be a combination of asphalt, concrete, and urban grass (figure 1). The wall surfaces are kept homogeneous in PUCM in our simulations but the model also has the ability to simulate heterogeneous walls. Green roofs and in-canyon urban grass in PUCM allow a more realistic representation of hydrologic processes, which are crucial to the performance of urban models (Grimmond et al 2010, 2011). As such, when PUCM is used, the impervious fraction of the urban terrain is no longer strictly impervious due to the presence of green roofs and in-canyon urban grass. Nevertheless, it is still called the 'impervious surface' in the following analysis in order to be distinguished from the 'vegetated surface', which represents out-of-canyon grasslands such as urban parks (see figure 1). Note that this vegetated surface is still a part of an urban grid cell, rather than a rural surface in a separate grid cell.
The surface temperature of an urban grid cell is computed as an area-averaged temperature based on the impervious surface temperature and the vegetated surface temperature:

Similarly, the sensible heat flux of an urban grid cell is an area-averaged sensible heat flux based on those from the impervious part and the vegetated part:

The impervious surface temperature is itself an area-averaged temperature of the roof and aerodynamic canyon temperatures:

The roof temperature and the canyon temperature are combined since both are aerodynamic temperatures that are used to calculate sensible heat fluxes in a similar way (see Li and Bou-Zeid 2014). Note that the canyon temperature is not the air temperature in the canyon as could be deduced from figure 1; it is rather an equivalent aerodynamic temperature that is more representative of the surface temperature of the wall and ground canyon facets (see Li and Bou-Zeid 2014 for its definition and calculation). Then, the 2 m air temperature is computed based on the complete urban surface temperature and the total sensible heat flux that comes from both the impervious surface and the vegetated surface:

In the above, ρ is air density; U2 is the wind speed at 2 m; and Ch2 is a representative turbulent transfer coefficient for which we use values that correspond to grass surfaces as rationalized in Li and Bou-Zeid (2014). Note that equations (3), (5), and (6) above correspond to equations (6), (8), and (9) in Li and Bou-Zeid (2014), respectively. It can be seen from equations (3) to (5) that the urban surface temperature (including the impervious and the vegetated parts) is not exactly the temperature at the ground level, which is due to the complexity and heterogeneity of urban terrain and the modeling approach used in UCMs. However, the complete temperature as computed in equation (3) is a very good surrogate of actual grid-averaged surface temperatures; in Li and Bou-Zeid (2014) we showed that it is within 1.5 °C of satellite surface temperature observations. The 2 m air temperature also does not truly reflect the air temperature at an elevation of 2 m. It should be understood as a diagnostic variable that represents the near-surface air temperature. Given the complexity of the urban structure in the real world and in PUCM (see figure 1), it is difficult to define or obtain the true air temperature at 2 m. Nevertheless, the 2 m air temperature calculated from equation (6) is still very informative since it represents a near-surface air temperature that is close to the actual air temperature felt by human beings (see analysis in Li and Bou-Zeid 2013 for a comparison of this temperature to measured air temperatures at 2 m). In the following analysis, it is still called the 2 m air temperature just to follow the tradition, but with the recognition that it is a representative near-surface temperature rather that the air temperature at exactly 2 m.
Based on these temperatures, the UHI effect is here computed as the difference between urban and rural temperatures (the surface temperature or the 2 m air temperature). When the surface temperature is used to calculate the UHI effect, it is called the 'surface UHI'; when the 2 m air temperature is used, it is called the 'near-surface UHI'.
2.2. Design of the numerical experiments
In order to answer the questions raised in the introduction, we conduct multiple numerical experiments, as detailed in table 2. In the first two suites of simulations, the fractions of green roofs and cool roofs increase from 0% to 100%, respectively (see simulation suites 1 and 2 in table 2). The remainder consists of conventional roofs. Note that a UCM is a spatially-averaged model for an urban grid cell; that is, no distinction is made among individual buildings within each urban grid cell. As such, a certain fraction of green/cool roofs (for example, 50%) can be viewed as either 50% of buildings within the grid cell are covered by green/cool roofs while the rest of buildings are covered by conventional roofs, or each building is covered by 50% of green/cool roofing and 50% conventional roofing. The properties adopted here for green roofs, cool roofs and conventional roofs are listed in table 3. These properties are either calibrated by previous studies or use typical values from the literature (Wang et al 2011b, 2013, Sun et al 2013). The assumed vegetation on green roofs is linear sedum and the green roof has the same albedo value as the conventional roof; this green roof design is used since the authors are familiar with its properties and performance from a previous study they participated in Sun et al (2013). However, any other type of vegetation or green roof design that produces comparable evaporation will have a very comparable impact on UHI strengths. In the third suite of simulations, given a fixed fraction of green roofs (50%), the soil moisture of the roofs is controlled, mimicking irrigation conditions and drought conditions. In the fourth suite, given a fixed 50% fraction of cool roofs, the albedo is altered; this suite is intended to simulate the effect of dirt accumulation and membrane deterioration on cool roofs. All simulations start from 0000UTC 6 June 2008 and end at 1200UTC 10 June 2008. The analyses focus on the period between 0500UTC (12:00 am local time) 7 June 2008 to 0500UTC 10 June 2008; hence, the first 29 h period is regarded as model spin-up time. The soil moisture content of green roofs is initialized as being equal in terms of volumetric fraction (fraction of pore space filled with liquid water) to the soil moisture content of surrounding rural grass since NARR initialization does not provide green roofs initial moisture content; this initial value is 0.33 m3 m–3 on average for our simulations. This is a relatively high value that represents a 50% saturation level. While this is a best-guess initialization, its implications will be discussed in section 3.2.
Table 2. Design of WRF simulations.
| Simulations suite | Green roof fraction (%) | Cool roof fraction (%) | Other modifications |
|---|---|---|---|
| 1 | 0, 10, 20, 30, 50, 70, 100 | 0 | |
| 2 | 0 | 0, 10, 20, 30, 50, 70, 100 | |
| 3 | 50 | 0 | Soil moisture is altered |
| 4 | 0 | 50 | Albedo is altered |
Table 3. Thermal properties of different roofs (taken from Wang et al 2013, Sun et al 2013).
| Green roof | Cool roof | Conventional roof | |
|---|---|---|---|
| Albedo (-) | 0.30 | 0.70 | 0.30 |
| Emissivity (-) | 0.95 | 0.95 | 0.95 |
| Heat capacity (MJ m−3 K−1) | 1.9 | 2.0 | 2.0 |
| Thermal conductivity (W m−1 K−1) | 1.1 | 1.0 | 1.0 |
| Depth (cm) for green roofs; this includes top soil and substrate | 40 | 20 | 20 |
| Saturation soil moisture (m3 m–3) | 0.468 | ||
| Wilting-point soil moisture (m3 m–3) | 0.15 | ||
| LAI | 5 |
3. Results
3.1. Mitigation of UHI: green roof and cool roof effectiveness
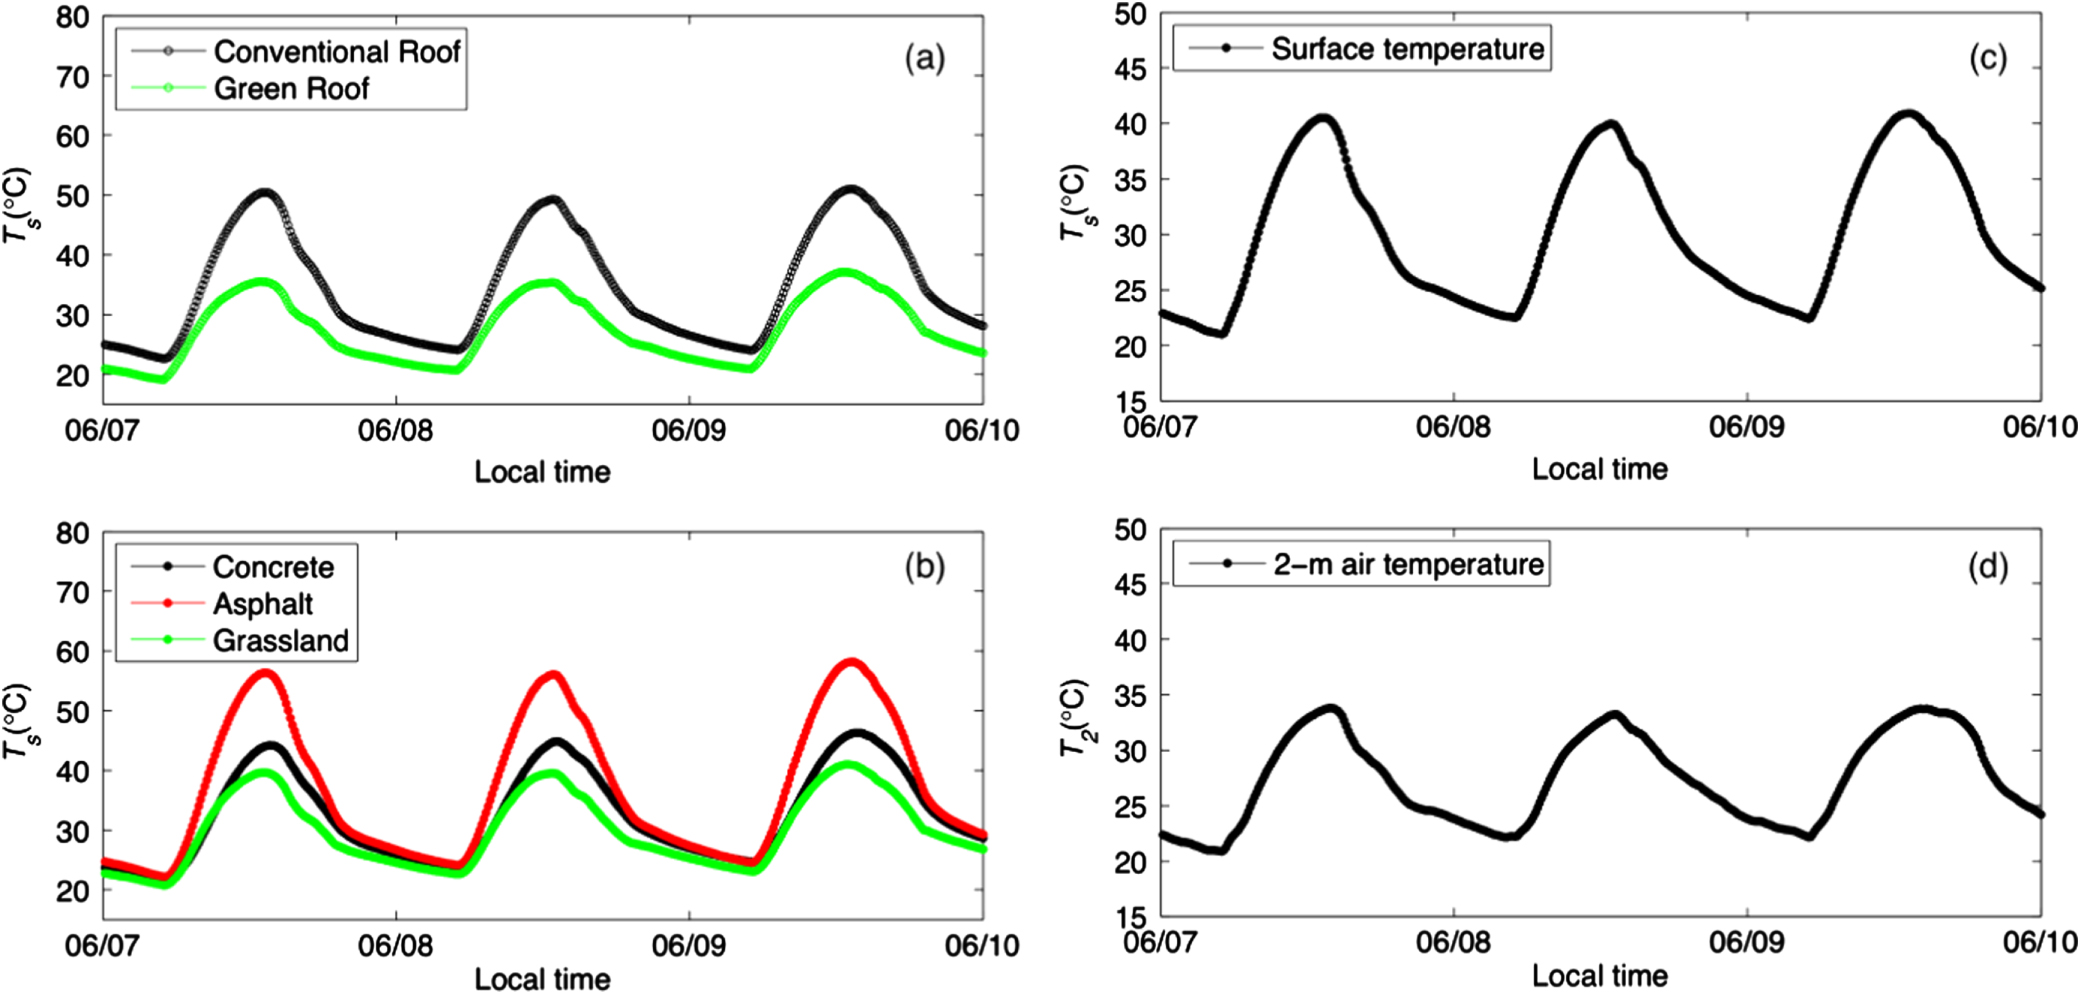
The diurnal cycles of surface temperatures of different roof and ground subfacets, and those of the complete urban surface temperature and the 2 m air temperature, are illustrated in figure 2 for a simulation with 0% green roofs and 0% cool roofs (note that the surface temperatures of green roofs and cool roofs are still calculated by the model even when their fractions are zero, but under such conditions, the atmosphere is not affected by green roofs or cool roofs). As can be seen from the left panel of figure 2, different subfacets (see figure 1) in the PUCM have widely different surface temperature diurnal cycles. For roofs, the daytime surface temperature of a green roof is substantially lower than that of a conventional roof due to evapotranspiration. The nighttime surface temperature on the green roof is also lower but the differences between roofs are less drastic. For ground subfacet, asphalt has the highest daytime surface temperature because of its low albedo and low thermal conductivity (about 15 °C higher than the grass subfacet). The grass subfacet has the lowest daytime surface, similar to the green roof, which is also attributed to evapotranspiration. The daytime surface temperature over concrete reaches its maximum slightly later than over asphalt and grassland, which results from the larger thermal effusivity of concrete (effusivity = (kρcp )1/2 where k is the thermal conductivity, ρ is the density and cp is the heat capacity). The right panel of figure 2 shows the diurnal cycles of the complete urban surface temperature calculated from equation (3) and the 2 m air temperature calculated from equation (6), which provide the basis for estimating the impacts of green and cool roof mitigation strategies in the analyses to follow.

Figure 2. (Left panel) Surface temperatures of different subfacets in the PUCM from a simulation with 0% green roofs and 0% cool roofs. (Right panel) The surface (top) and 2 m air (bottom) temperatures calculated from equations (3) and (5), respectively. All results are averaged over all urban grid cells in domain 3.
Download figure:
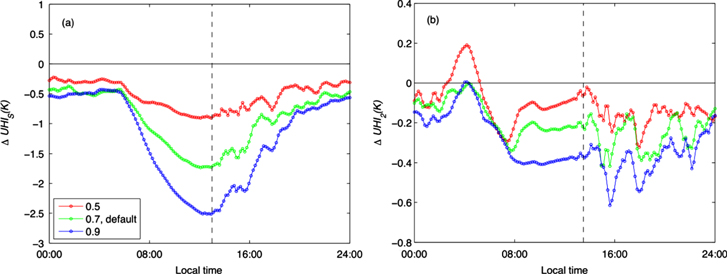
Standard image High-resolution imageFigure 3 depicts the city-scale impacts of green roof (left panels) and cool roof (right panels) mitigation strategies on the surface and near-surface urban heat island effects. The changes in the surface and near-surface urban heat islands due to increasing green/cool roof fractions shown in figures 3(a), (b), (e), and (f) are averages of the three diurnal cycles occurring between June 7 and June 10, 2008. Figure S2 of the supplementary material shows results for the whole 3-day analysis period. Nevertheless, there is no significant difference among the three days and hence we only focus on the results averaged over these diurnal cycles. As can be seen from figure 3(a), increasing green roof fractions can significantly reduce the daytime surface urban heat island (≈4 °C), but only moderately reduces the nighttime surface urban heat island (≈1 °C). This can be explained by the fact that increasing green roof fractions results in significant increases in evapotranspiration during daytime but has little impact during nighttime due to the energy limitation of nighttime evapotranspiration, as shall be seen in figure 4. For the near-surface urban heat island (figure 3(b)), the impact of green roofs during nighttime is also lower than that during daytime, and the diurnal differences are less significant than with surface temperatures. The fact that the green roof strategy, despite its little impact on evapotranspiration during nighttime, still has certain influence on the nighttime urban heat islands is particularly interesting. It suggests that the significant cooling effect of green roof during daytime can probably last throughout the night due to reduced heat storage in the urban canopy. Figure 3(c) shows the reductions in the surface urban heat island effect when the temperatures peak, as a function of the increasing fraction of green roofs. It can be seen from figure 3(a) that the maximum reductions in the surface urban heat island effect occur nearly at the same time for all cases (i.e., when the surface temperature reaches its maximum in the early afternoon as indicated by the dashed line). Figure 3(c) suggests that the maximum reductions scale about linearly with the green roof fraction. To reduce the maximum surface urban heat island by 1 °C, the Baltimore-Washington metropolitan area needs to have about 30% of its roofs converted to green roofs. On the other hand, the maximum reductions in the near-surface urban heat island effect do not occur at the same time for all cases. To be consistent, figure 3(d) shows the reductions in the near-surface urban heat island effect when the 2-m air temperature reaches its maximum (see the dashed line). It is clear that these reductions do not scale exactly linearly with the green roof fraction (but they are not too far from linear scaling). In order to reduce the daily maximum 2-m air temperature by 0.5 °C, the green roof fraction has to be close to 90% (figure 3(d)). Note that this is less than the maximum reduction in 2-m UHI strength depicted in figure 3(b). It needs to be emphasized that the performance of green roofs described here is closely linked to the soil moisture conditions. When the soil moisture conditions are altered, the performance of green roof will change accordingly, as shall be seen later.

Figure 3. The city-scale impacts of green roofs and cool roofs as a function of green/cool roof coverage fractions. The left panels show the impacts of green roof and the right panels show the impacts of cool roof. (a) and (e) are changes in the surface urban heat island; (b) and (f) are changes in the near-surface urban heat island. (c, d, g, h) are the corresponding reductions in the surface and near-surface urban heat islands when the surface and near-surface temperatures reach their maxima, as indicated by the dashed lines in (a, b, e, f) (which does not necessarily coincide with maximum UHI strength, especially for near-surface UHIs). The urban heat island effect is the difference between the urban and rural temperatures averaged over domain 3 (water surfaces excluded). The diurnal cycles shown in (a), (b), (e), and (f) are also averaged over 7 June–10 June.
Download figure:
Standard image High-resolution image
Figure 4. The city-scale impacts of green roof and cool roof mitigation strategies on the surface energy balance as a function of green/cool roof fractions. The left panels show the impacts of green roof and the right panels show the impacts of cool roof. (a) and (e) are changes in the net radiation; (b) and (f) are changes in the sensible heat flux; (c) and (g) are changes in the latent heat flux; (d) and (h) are changes in the heat storage. All results are averaged over urban grid cells in domain 3 and averaged over 7 June–10 June.
Download figure:
Standard image High-resolution imageIncreasing cool roof fractions can also reduce the surface and near-surface urban heat islands (see the right panels of figure 3); the impact is broadly similar to increasing green roof fractions. The cool roof strategy has a lower impact on the nighttime surface urban heat island than on the daytime surface urban heat island. This is related to the absence of incoming solar radiation during nighttime: albedo no longer plays an important role in the surface energy balance. Nevertheless, it is interesting to observe that the cool roof strategy still maintains some influence on the nighttime surface urban heat island due to reduced daytime storage of heat in the roof, suggesting that the daytime cooling effect of cool roofs can be extended into the nighttime (recall that the same nighttime effect was observed over green roofs too). Note in our study, a cool roof is modeled as having the same thermal properties as a conventional roof except for the albedo value, as can be seen from table 3. Comparing figures 3(a) to (e) suggests that for cool roofs with an albedo value of 0.7 (a high value representing newly installed or cleaned cool roofs, see e.g., Gaffin et al 2012), the impact on the surface urban heat islands is quite comparable to a green roof with a relatively high soil moisture value. This is consistent with Gaffin et al (2005, 2010) who show that the albedo required on a non-green roof to reproduce the surface temperature observed on a green roof is in the range of 0.7 to 0.85. As such, the cool roof fraction that is needed for reaching a maximum reduction in the surface urban heat island of 1 °C is also about 30%, as seen from figure 3(g). It is also interesting to observe that the effect of cool roofs on the near-surface urban heat island is slightly weaker than that of green roofs (c.f., figures 3(b) and (f)). Approximately 95% cool roof coverage is needed in order to reduce the near-surface urban heat island by 0.5 °C at the time when the near-surface air temperature reaches its maximum. We emphasize that the performance of cool roofs discussed here is specific for cool roofs with an albedo of 0.7. When the albedo of a cool roof is changed due to dirt accumulation for example, its performance will also be modified, as shall be seen later.
One needs to point out here that reductions in the surface and near-surface urban heat islands due to increasing green/cool roof fractions are mainly due to reductions in the urban surface and near-surface temperatures. However, weaker changes in rural surface and near-surface temperatures are also observed (not shown here). This is to be expected downwind of the city where urban cooling would lead to slight rural cooling (due to reduced heat advection).
Figure 4 depicts changes in the urban surface energy balance (including the impervious and the vegetated parts, see equation (1) and figure 1) due to increases in green roof (left panels) and cool roof (right panels) fractions. Due to the reduction in the urban surface temperature that reduces the outgoing longwave radiation, the net radiation increases as the green roof fraction increases (i.e., more net radiation is available at the surface, see equation (2) and figure 4(a)). On the other hand, the net radiation decreases as the cool roof fraction increases (figure 4(e)) because of the higher albedo of cool roof that increases the outgoing shortwave radiation (more than the reduction in outgoing longwave radiation associated with lower surface temperatures). Green roof and cool roof are equally effective in reducing the sensible heat flux (cf, figures 4(b) and (f)) that is transferred into the atmosphere, despite the fact that green roof increases the latent heat flux into the atmosphere more significantly via evapotranspiration (cf, figures 4(c) and (g)). It is interesting to observe from figure 4(g) that although there is no evapotranspiration on cool roof, the increase in cool roof fraction still reduces the latent heat flux over the urban surface. Close inspection reveals that this reduction in the latent heat flux occurs over the vegetated part of the urban surface (see figure 1). This is an interesting indirect effect related to changes in ambient air at the city-scale; and to the best of our knowledge this is the first time this effect has been documented. Similar indirect effects are also observed for the green roof simulations (i.e., the evapotranspiration from the vegetated surface is reduced). Nevertheless, because the increase in the evapotranspiration from green roof is more substantial than the decrease in the evapotranspiration from the vegetated surface, the total evapotranspiration and latent heat flux from the urban surface is increased, as can be seen from figure 4(c).
These indirect effects are rooted in the impact of urban surface heat fluxes on atmospheric flows. The lower sensible heat flux when cool/green roofs are used weakens the atmospheric instability and the vertical mixing over the urban areas. When the vertical mixing over the urban surface is weaker, the internal boundary layer that is developed when atmospheric air flows from rural to urban areas grows less rapidly and hence, at a given height over urban areas, the atmosphere is less affected by the surface conditions and more affected by the advection from the upwind surfaces. As such, the advective effect is stronger for cases with weaker mixing in urban areas. The stronger advection of moister air from rural areas leads to an increase in humidity in the urban atmosphere (i.e., at za in figure 1), which reduces the vapor pressure deficit and then reduces the evaporation capacity over urban areas (see figures S3 to S6 in the supplementary materials).
Note that this advective effect is different from the case with an UHI induced thermal circulation under weak winds where advection increases as the sensible heat flux from urban areas increases or as the UHI effect increases (see e.g., Baik et al 2001, Haeger-Eugensson and Holmer 1999, Bornstein and Lin 2000, Shepherd 2005, Hidalgo et al 2008a, 2008b, 2010, Lemonsu and Masson 2002). Instead, the synoptic or mesoscale wind (Takane et al 2013, Klein 2012), which is not weak, plays an important role in our case. A typical internal urban boundary layer is developed when the atmospheric flow moves from rural areas to urban areas. When the sensible heat flux from urban areas increases, the internal boundary layer grows faster and the urban atmosphere is more affected by the surface conditions; and hence the impact of advection by the synoptic or mesoscale wind is diminished.
The heat storage dynamics are also very similar for the green roof and cool roof strategies (cf, figures 4(d) and (h)). The heat storage decreases significantly during daytime as the cool roof and green roof fractions increase. These storage fluxes are usually either stored in the roof and later released, or conducted all the way into the building indoor space where they are typically pumped back to the outdoor space by air conditioners (this last effect is not captured by WRF and would represent an anthropogenic heat source, which is not taken into account in our simulations). Thus, by considerably lowering G, green roof and cool roof can provide lower cooling loads and lower anthropogenic heat releases, which include the heat pumped to the exterior by air conditioners. During nighttime, the ground heat flux is negative (from the building interior towards the roof–air interface), and the positive differences for green/cool roofs imply that less heat is flowing towards the roof–air interface when the green/cool roof fractions increase. This is consistent with the lower storage of heat during daytime in the cool/green roofs.
The city-scale reductions in the surface UHI presented in figure 3 are not distinguished for the three urban categories. In order to examine the variability of city-scale impacts of green and cool roof strategies, especially the differences in mitigation impacts between city centers and suburbs, figure 5 depicts the city-scale surface temperature reductions for different urban categories. As mentioned in section 2, the urban categories used in WRF-PUCM include low density residential urban, high density residential urban and industrial/commercial urban. The three urban categories have different impervious surface fractions and vegetated surface fractions, as well as different morphologies (table 1). As can be seen from figure 5, the surface temperature reductions are most prominent in industrial/commercial urban areas. In the low density residential urban areas, the surface temperature reductions are still important but are less than those in the high density residential urban areas or in industrial/commercial urban areas. This is attributed to the fact that the green/cool roof strategies can significantly reduce the impervious surface temperatures, while they slightly increase the vegetated surface temperatures. As mentioned earlier, this is due to the advection of moist air from the rural areas into the urban areas when the green/cool roof fractions are increased. For the green roof strategy, the evapotranspiration from the green roof further increases the near-surface moisture. As a result, the vapor pressure deficit and thus the evapotranspiration over the vegetated surface is reduced, which leads to an increase in the vegetated surface temperature. Given that the industrial/commercial urban areas have the largest impervious surface fraction, reductions in the complete surface temperature (combining the impervious and the vegetated surface temperatures) are hence more substantial in these areas as compared to the low-density urban areas whose impervious surface fraction is lower.

Figure 5. The city-scale impacts of green roof and cool roof mitigation strategies on the surface temperature in different urban categories as a function of green/cool roof fractions. The left panels show the impacts of green roofs and the right panels show the impacts of cool roofs. (a) and (d) are changes of surface temperatures in low density residential urban areas; (b) and (e) are changes of surface temperatures in high density residential urban areas; (c) and (f) are changes of surface temperatures in industrial/commercial urban areas. All results are averaged over urban grid cells in domain 3 and over the three diurnal cycles from 7 June to 10 June.
Download figure:
Standard image High-resolution imageSince the 2 m air temperature is linked to the surface temperature (see equation (5)), reductions in the 2 m air temperature are also more significant in industrial/commercial urban areas than in low-density urban areas (not shown here). Over industrial/commercial terrain, the reduction in the maximum 2 m air temperatures with 100% green roofs and 100% cool roofs are 1.41 °C and 1.35 °C, respectively. The diurnal behaviors of reductions in 2 m air temperature are similar to the ones shown in figures 3(b) and (f) for green roof and cool roof strategies, respectively, but with different magnitudes in the three urban categories.
3.2. The effects of changes in the physical determinants of green and cool roof performance
Section 3.1 examined the city-scale impacts of both green roof and cool roof strategies under 'default' conditions. Particularly, an albedo of 0.7 was assumed for cool roofs and green roofs were initialized with regional soil moisture data and left to dry. However, many studies indicate that the performances of green and cool roof vary with key factors such as soil moisture for green roof (see e.g., Sun et al 2013) and albedo for cool roof (see e.g., Bretz and Akbari 1997, Gaffin et al 2012). Sun et al (2013) showed that soil moisture was the main controllable determinant of green roof performance (net radiation was found to be the other main determinant, but one cannot control it for green roofs). This is to be expected since soil moisture controls the evaporation efficiency (Brutsaert 1982). When the value of soil moisture lies between the field capacity (the maximum soil water content that can be maintained by soils when drained by gravity, which is typically lower than saturation soil moisture for coarse green roof soils) and the wilting point (the minimum soil water content that continues to allow plants to uptake water and survive, 0.15 m3 m–3 in our study), the higher the value of soil moisture, the more efficient evaporation will be. Sun et al (2014) studied the costs and benefits of irrigating a green roof to maintain its soil moisture over 0.3 m3 m−3 and concluded that green roof irrigation can be a financially viable option under the conditions they used (green roof was in Beijing, China, and the prices of water and electricity of Beijing were used). Bretz and Akbari (1997) examined the albedo degradation of cool roof and reported that the albedo degradation primarily occurs within the first year (or even the first two months) of installation. They reported that the decrease in albedo over the first year can reach 0.15 to 0.25 or about 20 to 30%. They also investigated the effectiveness of washing cool roofs and found that it is not cost-effective despite its significant impact on albedo restoration, but this conclusion depends on the roof material and the washing approach. Gaffin et al (2012) analyzed the performance of three generic white membranes within New York City and reported that one of the membranes (i.e., the asphaltic multiply built-up membrane) lost about 50% of its initial albedo within the first two years of installation. The EPA (Environmental Protection Agency of the United States) Energy Star Reflective Roof program requires that a roof material must have an initial albedo greater than or equal to 0.65, and an albedo greater than or equal to 0.50 3 yr after installation in order to qualify for the Energy Star Label (http://www.epa.gov/heatisland/mitigation/coolroofs.htm). As such, it is important to consider the influence of variations in these environmental and design parameters on the performances of different roofs and their city-scale impacts.
Since the factor that mostly affects the performance of green roof is the soil moisture, we conducted four additional simulations. For two cases, the green roof is irrigated such that the soil moisture remains above 0.35 and 0.45 m3 m–3. This is similar to the method used in Sun et al (2013). For the other two cases, the green roof initial soil moisture is set to be 0.15 and 0.25 m3 m−3 in order to assess green roof performance under very dry conditions. When the soil moisture is controlled by irrigation, one expects better green roof performance. On the other hand, for the dry simulations (e.g. heat wave occurring after a dry period), one expects poorer performance. Recall that for the 'default' simulations, the unirrigated green roof soil moisture was initialized from NARR to be equal to the rural grass top level soil moisture. Its initial value was about 0.33 m3 m−3, a relatively high value, which then gradually dropped to 0.27 m3 m−3 at the end of the simulated period by evapotranspiration.
The impacts of altering soil moisture on green roofs are evaluated by analyzing the reductions in the surface and near-surface UHIs when the green roof fraction is 50%, as compared to the case with 100% conventional roofs (i.e., 0% green roofs). Figure 6 show that, when the soil moisture is not altered (called the 'default' case), the reductions in surface and near-surface UHIs when the surface and 2 m air temperatures reach their maxima are about 1.81 °C and 0.26 °C, respectively (see the dashed line). Compared to this default case, irrigation does provide additional cooling effect during both daytime and nighttime, as can be seen in figure 6. Table 4 lists the changes in surface and near-surface UHIs when the surface and near-surface temperatures reach their maxima, respectively, due to changes in the green roof soil moisture (recall that these are not necessarily the maximum changes shown in figure 6). It is noted that the values shown in table 4 are relative to the default case where the soil moisture is initialized from NARR; while the changes shown in figure 6 are relative to the case with 0% green roof. The additional reduction effect on the surface UHI is 0.27 °C when soil moisture control limit is 0.35 m3 m−3, and 0.55 °C when soil moisture control limit is 0.45 m3 m−3, while the additional reduction in the near-surface UHI is 0.03 °C and 0.10 °C for soil moisture control limits of 0.35 m3 m−3 and 0.45 m3 m–3, respectively. The improvement of green roof cooling effect is not substantial due to the fact that the default soil moisture condition is not very dry (in the range from 0.27 to 0.33 m3 m–3). As such, the green roof is already functioning well during this particular period and the irrigation impact is limited.

Figure 6. The city-scale impacts of green roof mitigation strategy as a function of green roof soil moisture (the fraction of green roof is 50%): (a) changes in the surface urban heat island and (b) changes in the near-surface urban heat island. The urban heat island effect is the difference in the urban and rural temperatures averaged over domain 3 (water surfaces excluded). All results are averaged over 7 June–10 June. The vertical dashed lines in (a) and (b) indicate when the surface and near-surface temperatures reach their maxima, respectively.
Download figure:
Standard image High-resolution imageTable 4. The additional benefits or penalties of changing the green roof soil moisture and the cool roof albedo relative to their default cases (values at times of peak temperatures).
| Changes in the surface urban heat island | Changes in the near-surface urban heat island | ||
|---|---|---|---|
| Green roof soil moisture(m3 m–3) | 0.15 | 1.56 | 0.26 |
| 0.25 | 0.53 | 0.08 | |
| 0.35 | –0.27 | –0.03 | |
| 0.45 | –0.55 | –0.10 | |
| Cool roof albedo | 0.5 | 0.82 | 0.18 |
| 0.9 | –0.79 | –0.14 |
On the other hand, when the soil moisture initial condition is somewhat dry (i.e., initial soil moisture is 0.15 or 0.25 m3 m–3), the performance of green roof deteriorates significantly. For the values at peak temperatures reported in table 4, the surface heat island intensity is increased by 1.56 °C (for initial soil moisture is 0.15 m3 m–3) and 0.53 °C (for initial soil moisture is 0.25 m3 m–3), respectively, while the near-surface heat island effect is increased by 0.26 °C for an initial soil moisture of 0.15 m3 m–3 and 0.08 °C for initial soil moisture is 0.25 m3 m–3. Note that when the initial soil moisture is at the wilting point (0.15 m3 m–3), the evapotranspiration efficiency is effectively zero. As expected, the surface and near-surface UHIs for these very dry roof simulations are not reduced compared to the conventional roofs for most of the simulated period (i.e., the green roofs have no cooling effects, see figure 6). The changes in the surface and near-surface UHIs shown in figure 6 are then partially related to the different thicknesses and thermal properties of green and conventional roofs. For the case with initial soil moisture of 0.25 m3 m–3, despite the fact that the green roof still produces an evaporation rate of about 30% of the potential rate, its performance is still significantly reduced. Consequently, it is clear that soil moisture does play a significant role in controlling the performance of green roofs. During drought conditions when soil moisture is very low (close to the wilting point), irrigation can be very important for maintaining the cooling effect of green roof at the building as well as the city scales. One can also infer from table 4 that if the default conditions are very dry due a preceding drought period (0.15 m3 m–3) and the roof is irrigated to a high moisture level of 0.45 m3 m–3, the reduction in the surface UHI would exceed 2 °C and the reduction in the near-surface UHI would be about 0.4 °C. These numbers would double if 100% of the city's roofs are green as previously illustrated.
Figure 7 also shows substantial deterioration in the performance of cool roofs as the albedo is reduced. In these cases, the fraction of cool roofs is 50%. Figure 7 depicts the changes in the surface and near-surface UHIs compared to the case with 100% conventional roofs (i.e., 0% cool roofs). A value of 0.7 corresponds to a new cool roof or to one that undergoes regular cleaning and maintenance, which is chosen as the 'default' case for cool roof scenarios. When 50% of conventional roofs with albedo of 0.3 (conventional concrete/gray roofs in this study) are converted to cool roofs with albedo of 0.7, the reduction in the surface UHI at the time of peak surface temperature is about 1.70 °C, while the reduction in the near-surface UHI at the time of peak 2 m air temperature is about 0.23 °C. When the albedo of cool roof is altered to be 0.5, these reductions in the surface and near-surface UHIs are 0.88 °C and 0.05 °C, respectively. The differences in reductions of peak temperatures are provided in table 4. These results again confirm that dirt accumulation on a cool roof, which decreases its albedo from 0.7 to 0.5, reduces the city-scale cooling effect by about 0.82 (= 1.70 − 0.88)°C and 0.18 (= 0.23 − 0.05)°C for surface and near-surface UHIs, respectively (see table 4). These results clearly prove the importance of actively maintaining the long-term albedo of cool roof. We also estimated the impact of an even higher albedo of 0.9 (comparable to that of snow, and probably only obtainable if special reflective surfaces are used), which nonetheless is unlikely for current cool roof technology. The city-scale impacts of having 50% of the roofs in the city with an albedo of 0.9 are substantial: about 2.5 °C reduction in the surface UHI and 0.37 °C reduction in the near-surface UHI (see figure 7). The high sensitivity of surface and near-surface UHIs to the roof albedo observed here is in agreement with previous sensitivity studies showing that the roof albedo is a critical input parameter for UCMs (see e.g., Ryu et al 2011; Wang et al 2011a).
Figure 7. The city-scale impacts of cool roof mitigation strategy as a function of albedo values (the fraction of cool roofs is 50% and the conventional roofs have an albedo value of 0.3): (a) changes in the surface urban heat island and (b) changes in the near-surface urban heat island. The urban heat island effect is the difference in the urban and rural temperatures averaged over domain 3 (water surfaces excluded). All results are averaged over 7 June–10 June. The vertical dashed lines in (a) and (b) indicate when the surface and near-surface temperatures reach their maxima, respectively.
Download figure:
Standard image High-resolution image
Krayenhoff and Voogt (2010) provide a synopsis of studies that examined urban air temperature cooling due to increases in the roof albedo (see their table 7). The sensitivity (ΔT/ΔαN , where ΔT is the change in the near-surface air temperature and ΔαN is the change in the regional albedo) ranges from 2 to 30 due to variations in model complexity, meteorological conditions like wind speed and insolation, geographic features, urban morphology, spatial and temporal averaging methods, etc. Nonetheless, Krayenhoff and Voogt (2010) pointed out that sensitivities are below 12 with few exceptions that do not include atmospheric advection effects; the median sensitivity after excluding these few exceptions is approximately 5. In our study, the regional area fraction occupied by roofs ranges from 25% to 47.5% (see table 1). Given that 50% of the roof area is covered by cool roofs in our sensitivity simulations, an increase of 0.2 in the roof albedo (e.g., from 0.7 to 0.9 which gives ΔT = 0.14 °C) is equivalent to an increase ranging from 0.025 (= 0.2 × 50% × 25%) to 0.0475 (= 0.2 × 50% × 47.5%) in the regional albedo. As such, a ΔT/ΔαN of about 3 to 6 is suggested by our results, which is thus in good agreement with previous studies.
4. Conclusions and discussions
In this study, mitigation of the UHI effect at city scales via green roof and cool roof strategies is investigated using the WRF model, in conjunction with a newly-implemented PUCM. This study builds on the companion paper by Li and Bou-Zeid (2014) where the high-resolution simulation of UHIs with WRF was validated. That paper showed that the WRF-PUCM framework performs better than existing options for urban surface parameterization in WRF. In addition, PUCM allows us to simulate fractional coverage of green or cool roofs due to its ability to simulate heterogeneous urban sub-facets, a capability that is missing in existing WRF UCMs.
Results indicate that as the green and cool roof fractions increase, the surface and near-surface UHIs at the time when the surface and near-surface temperatures reach their maxima are reduced almost linearly. To reduce the surface UHI by 1 °C, the Baltimore-Washington metropolitan area needs about 30% of the roof areas to be covered by green roofs (if the soil moisture is maintained through rain or irrigation at values comparable to the ones that prevail in this study, about 0.3 m3 m–3), or by cool roofs that have an albedo value of 0.7. To reduce the near-surface UHI by 0.5 °C, the green roof fraction has to be close to 90% and the cool roof (albedo = 0.7) fraction has to be close to 95%. This result suggests that the potentials of green and cool roofs to reduce the surface and near-surface UHIs are generally comparable when their performances are not hindered by dry soils (green roofs) or dirt accumulation that reduces albedo (cool roofs).
While the reductions in the surface and near-surface UHIs scale almost linearly with the green and cool roof fractions, significant indirect effects of the green and cool roof strategies are observed. For example, the surface temperatures of urban vegetated surfaces that are adjacent to impervious surfaces are slightly increased due to the reduction in evapotranspiration. This is induced by the reduction in vertical mixing (due to reduced surface heating) and by the increased advection of more moist air at the lower elevations from the rural areas to the urban areas when the green and cool roof fractions increase. In addition, slight changes in rural temperatures downwind of the city are also observed as green and cool roof fractions increase.
The performances of green roofs and cool roofs are primarily affected by soil moisture and albedo, respectively. The additional benefits or penalties associated with changes in these key parameters are quantified, using a 50% penetration rate for both the green and cool roof strategies. When evapotranspiration efficiency is maintained by irrigating the green roof so that the soil moisture is always above a certain level (0.35 and 0.45 m3 m–3 in our study), additional cooling effect is observed but is fairly limited. For example, the surface UHI at the time of peak temperatures is further reduced by 0.27 °C (for a soil moisture control limit of 0.35 m3 m–3) and 0.55 °C (for a soil moisture control limit of 0.45 m3 m–3), while the near-surface UHI is further reduced by 0.03 °C and 0.10 °C, respectively. The improvement of the green roof's performance by irrigation is not substantial simply due to the fact that the default green roof is not under water-limited conditions with a soil moisture ranging from 0.27 to 0.33 m3 m–3; the roof is thus performing well. However, the penalties resulting from a low soil moisture could be substantial if the green roof becomes very dry. For example, under drought conditions when the soil moisture is very close to its wilting point (in our case 0.15 m3 m–3), the cooling effect provided by green roofs is almost completely eliminated. This implies that soil moisture is a key variable that controls the performance of green roofs. Under dry conditions, irrigation can hence be important for maintaining the cooling effect of green roofs.
For cool roofs, the additional benefits or penalties from changing the albedo values are also substantial. When the cool roof fraction is 50%, changing the albedo value from 0.7 to 0.9 (an unusually high value with current cool roof technology) could allow a 0.79 °C additional reduction in the surface UHI and a 0.14 °C additional reduction in the near-surface UHI (at time of peak temperatures). However, if the albedo decreases from 0.7 to 0.5 due to dirt accumulation, the city-scale cooling effect of cool roofs would be reduced by 0.82 °C and 0.18 °C for surface and near-surface UHIs, respectively.
The results have some implications and limitations that are important to appreciate. First, the comparison of the city-scale impacts of green roof and cool roof strategies indicates that the two approaches are about equally effective in reducing surface and near-surface UHIs. Given that cool roofs are much cheaper to implement and easier to install as a retrofit than green roofs, the results suggest that the cool roof strategy is a more viable and cost-effective approach for mitigating the city-scale UHI effect. This is further supported by the observation study of Mackey et al (2012) who used remotely-sensed satellite observations (LANDSAT images) to disentangle the cooling effects in Chicago from albedo increases and vegetation increases, and concluded that the albedo increases produced even greater cooling than vegetation increases (our results indicate the two are equally effective in our simulations but this depends on soil moisture and albedo as we discussed). Nonetheless, there are other advantages of green roofs that are not included in our comparison such as the improvements in air quality (see e.g., Li et al 2010, Yang et al 2008) and the potential reduction in peak stormwater runoff (see Berndtsson 2010 for a review). As such, the 'better performance of cool roofs compared to green roofs' is strictly applicable when the decision criteria is 'what technology will produce maximum city-scale cooling per invested monetary unit?'. Second, the city-scale impacts of these mitigation strategies vary diurnally and are expected to vary with large-scale weather conditions. Therefore, it is expected that these impacts will also vary from city to city. This work is specifically designed to investigate, using a new-generation thoroughly-validated modeling framework, the cooling effects of different mitigation strategies under heat wave conditions due to the expected increasing frequency of heat waves under a warming climate and the potential synergistic interactions between heat waves and UHIs (Li and Bou-Zeid 2013). The results are thus quantitatively representative of very hot periods in the Northeastern US or in regions with similar weather. The generalization of the quantitative aspects of the results to other conditions and regions would require further investigations and studies, but one would expect the qualitative features to hold broadly.
Acknowledgement
This study was funded by the US National Science Foundation under Grant CBET-1058027 and the Princeton Environmental Institute-Science, Technology, and Environmental Policy fellowship. The authors would like to thank Ting Sun from Tsinghua University for his help in implementing the model for green roof in WRF. The simulations were performed on the supercomputing clusters of the National Center for Atmospheric Research through project P36861020.