

Abstract
Globally, the further expansion of cropland is limited by the availability of adequate land and by the necessity to spare land for nature conservation and carbon sequestration. Analyzing the causes of past land-use changes can help to better understand the potential drivers of land scarcities of the future. Using the FAOSTAT database, we quantify the contribution of four major factors, namely human population growth, rising per-capita caloric consumption (including food intake and household waste), processing losses (including conversion of vegetal into animal products and non-food use of crops), and yield gains, to cropland expansion rates of the past (1961–2007). We employ a Kaya-type decomposition method that we have adapted to be applicable to drivers of cropland expansion at global and national level. Our results indicate that, all else equal, without the yield gains observed globally since 1961, additional land of the size of Australia would have been put under the plough by 2007. Under this scenario the planetary boundary on global cropland use would have already been transgressed today. By contrast, without rising per-capita caloric consumption and population growth since 1961, an area as large as nearly half and all of Australia could have been spared, respectively. Yield gains, with strongest contributions from maize, wheat and rice, have approximately offset the increasing demand of a growing world population. Analyses at the national scale reveal different modes of land-use transitions dependent on development stage, dietary standards, and international trade intensity of the countries. Despite some well-acknowledged caveats regarding the non-independence of decomposition factors, these results contribute to the empirical ranking of different drivers needed to set research priorities and prepare well-informed projections of land-use change until 2050 and beyond.
Export citation and abstract BibTeX RIS

Content from this work may be used under the terms of the Creative Commons Attribution 3.0 licence. Any further distribution of this work must maintain attribution to the author(s) and the title of the work, journal citation and DOI.
1. Introduction
Around 12% of the global ice-free land cover is currently used as cropland [1]. Further expansion is limited by the availability of adequate land and by the necessity to spare land for nature conservation and carbon sequestration [2, 3]. In effect, most of the still unconverted land suitable for crop cultivation lies in richly forested areas of Latin America and Africa [4]. If past expansion rates were sustained into the future, the limit of global cropland area, which is considered sustainable from an environmental perspective (the so-called planetary land-use boundary [5]), would be transgressed within the coming decades.
In this study, by analyzing major drivers of past cropland expansion, we aimed at identifying levers to slow down and eventually halt further encroachment of cropland on natural ecosystems in the future. We used a Kaya-type decomposition method, which describes changes in cropland area as a linear combination of changes in human population, per-capita caloric consumption (including food intake and household waste), processing losses (including conversion of vegetal into animal products and non-food use of crops), and area intensity (the ratio of cropland area to crop production, i.e., the inverse of crop yields).
Conceptually, this approach originates from the early proposal of Ehrlich & Holdren [6] to understand environmental impacts (I) as a function of population size (P), affluence (A) and technology (T) (the so-called IPAT identity). Its application to energy systems, in order to study their greenhouse gas emission intensity, has been later termed Kaya identity [7] and has found wide-spread use in climate economics, e.g., [8]. By contrast, despite its generality, it has been much less applied to other environmental indicators and systems, in particular land-use change and agriculture (notable exceptions are described in a recent review [9]).
Two previous studies have applied a decomposition approach similar to ours. Waggoner & Ausubel [10] have explored the prospects for global forest restoration based on observed trends in drivers of cropland expansion. Recently, Kastner et al [11] have investigated the contribution of changes in agricultural technology (yields), diets and population to cropland expansion rates of the past half-century, considering eleven different food categories. As a major result, their analysis points to an increasing importance of dietary change as compared to population growth, which used to be the primary driver of cropland expansion in most world regions. Our analysis goes beyond these recent decomposition studies with respect to the following three aspects. Firstly, we have adopted the relatively novel method of secondary decompositions [12] to study the contribution of individual crop types (e.g., wheat, rice, maize) to the effect of yield changes within one methodological framework Secondly, we present a (nearly) comprehensive set of national data, while previous studies have focused on selected countries [10] or subcontinental regions [11]. Thirdly, we account for international trade explicitly as part of our decomposition approach as opposed to incorporating trade effects implicitly during data pre-processing [11]. As such, our study adds important details to previous assessments of past drivers of cropland expansion, globally and at the level of individual nations.
2. Methods
Using five year running means of FAOSTAT data [13] for 1961–2007, we decomposed global cropland area (A) according to the following Kaya-type identity:

where P is population, Ccon food consumption (in kcal), Cprod crop production (in kcal), and, thus, D per-capita caloric consumption, L processing losses, and Y area intensity (i.e., inverse of yield). It is important to note that Ccon includes household waste in addition to the food calories actually consumed. Any other losses and waste in the food supply chain (e.g., due to the conversion of vegetal into animal products, non-food usage of crops, transport and storage) are included in L.
Based on (1) and applying Laspeyers index method [14] yearly changes in cropland area (ΔA) can be expressed as the weighted sum of yearly changes in P, D, L, and Y . The contribution of changes in Y to ΔA was further analyzed in terms of different crop categories, according to a formalism recently proposed to study energy-related CO2 emissions [12]. For national data we extended L in (1) by the ratio of crop production to domestic crop supply (Cdom) to account for the influence of trade (and stock variations) L2, in addition to processing losses occurring domestically L1:

We used the results of the decomposition according to (1) and (2) to study the individual effect of driving forces (P, D, L and Y ) on cropland area over 1961–2007, assuming that each factor in turn would have stayed at its 1961 level (in the following referred to as counterfactual analysis). The major caveat associated with this analysis is the non-independence of decomposition factors [9]. If, e.g., no gains in crop yields had occurred, food prices would most likely have been higher, slowing growth in per-capita consumption and human population due to malnutrition. Such dynamic adjustments would have, in the real world, buffered the change in cropland area estimated here. In particular, static approaches as presented in this study may overestimate the land savings of crop yield improvements by an order of magnitude compared to dynamic approaches that take market-mediated adjustments into account [15].
We compared the results of the counterfactual analysis with the planetary land-use boundary as defined by [5]. According to this study, 15% of global land cover converted to cropland constitutes a threshold not to be transgressed if humanity wants to avoid 'unacceptable environmental change'. This threshold corresponds well with the area of currently unused productive land (in non-forested, non-protected regions with low population density), which is estimated to cover approximately 3% of global land cover, apart from the 12% currently in use as cropland [1]. We converted these figures to absolute area using the estimate of [1] for total ice-free land (133 million km2).
Weight units of crop production and domestic supply were converted into calories using conversion factors derived from consumption data (provided in both tons and kcal) in the FAO Food Balance Sheets. We accounted for all crop types listed in the FAO database except fibre crops, which can be excluded as potential food sources. Due to a lack of suitable data of crop-specific arable land [11], we defined cropland as the area harvested in a given year. With this definition, one runs the risk of overestimating the actual area of cultivated land where multicropping occurs. However, a recent study [16] showed that, globally, the area harvested is considerably smaller than the cultivated areas if one takes both multicropping and fallowing into account. As another caveat, observed yield changes derive from actual productivity increases in certain crops, but originate to a small degree also from a shift in cultivation pattern (over 1961–2007 the share of most crop categories in the total area harvested did not vary strongly; only the share of oil and sugarcrops increased significantly at the expense of some cereals; see supplementary data figure S1 available at stacks.iop.org/ERL/9/024011/mmedia). Last but not least, it is important to note that we did not account for calories derived from pasture land. We therefore underestimated the losses due to meat consumption, and any trends towards increasingly grain-fed livestock [17] may only appear implicitly in L More explicitly accounting for changes in meat consumption in (1) is also complicated by the lack or low quality of data on crop production used as human food versus animal feed in the FAO Food Balance Sheets. An alternative approach, albeit with its own large uncertainties on livestock-specific conversion efficiencies is to base calculations on caloric consumption data, as done by [11].
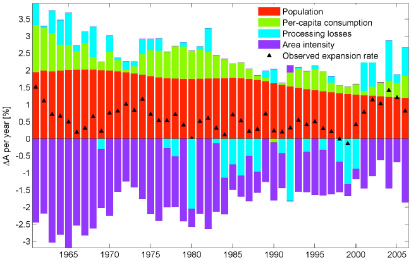
Figure 1. Decomposition of yearly growth rates of global cropland area A (black triangles). Bars indicate contributions from changes in population P (red), per-capita caloric consumption C (green), processing losses L (including conversion of vegetable to animal products; turquoise), and area intensity Y (i.e. inverse of yield; purple). The average change in cropland area over 1961–2007 was 0.6% p.a., which can be decomposed into contributions of +1.7%, +0.5%, −0.04%, −1.6% p.a. from P,C, L, and Y , respectively.
Download figure:
Standard image High-resolution image3. Results
3.1. Global drivers of expanding cropland
3.1.1. Primary decomposition of changes in cropland area
The area of global cropland grew by approximately 30% between 1961 and 2007. In absolute terms, around 3 million km2, equivalent to 40% of Australian land area (AAUS), were converted from grassland and forest to cropland. According to the decomposition results (figure 1) the growth of population, which more than doubled during this time period (from 3 billion to more than 6 billion people), contributed most strongly to cropland expansion. Richer diets, with increasing calories consumed per person, appeared as the secondary driver of cropland expansion. By contrast, decreasing area intensity (i.e. increasing yields) counteracted the increased cropland demand, showing consistent negative contributions to cropland area changes (figure 1). The average contribution of changes in processing losses to cropland expansion was negligible over 1961–2007. We therefore did not consider the effect of changing processing losses in the following analysis of the individual effects of decomposition factors.

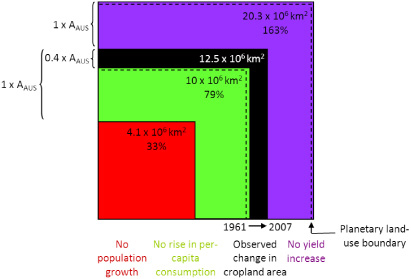
Figure 2. Cumulative change in cropland area over 1961–2007 scaled to de facto area of 2007 (black box), based on decomposition results presented in figure 1. All else equal, with no population growth (red box), no rise in per-capita consumption (green box), and no yield increase (purple box) since 1961, cropland area in 2007 would have been 33%, 79%, and 163% of its actual size, respectively. The sustainable limit of cropland use (planetary land-use boundary) would have already been transgressed in the latter case. Deviations from de facto cropland area of 2007 are expressed in equivalents of total Australian land area (AAUS).
Download figure:
Standard image High-resolution image3.1.2. Counterfactual analysis and secondary decomposition
All else equal, without population growth and rising per-capita consumption since 1961 the crop demand could have been fulfilled with 33% and 79% of currently used cropland area, respectively (figure 2). By contrast, without the yield gains observed since 1961 the world would have used 63% more cropland area in 2007. Under this last scenario the sustainable limit of cropland area would have already been transgressed today. Interestingly, yield gains have roughly offset the increasing demand of a growing world population, while the observed expansion of cropland was of the same magnitude as the change caused by rising per-capita consumption alone (figures 1 and 2). The contribution of yield gains was strongest in maize, wheat and rice, allowing for land sparing of the size of 5.4, 3.8, and 2 times the area of France (AFRA), respectively (figure 3).
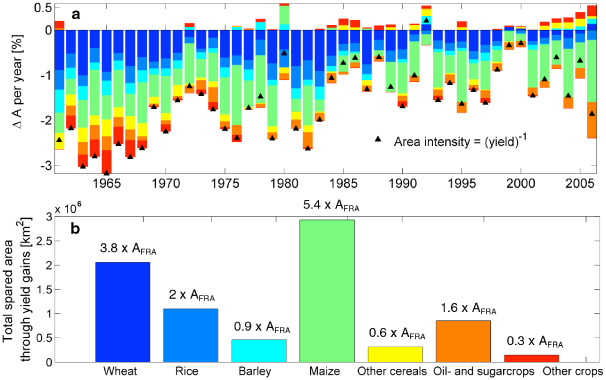
Figure 3. (a) Secondary decomposition of the contribution of changes in area intensity (black triangles) to yearly growth rates of global cropland area (cf purple bars in figure 1), in terms of different crop types (wheat, rice, barley, maize, other cereals, oil and sugar crops, other crops; color code see panel (b). (b) Cumulative cropland area spared through decreases in area intensity (i.e. yield gains) over 1961–2007, based on decomposition results presented in panel (a). All else equal, with no yield gains in wheat, rice, barley, maize, other cereals, oil and sugar crops, and other crops since 1961, global cropland area in 2007 would have been 16.5, 8.8, 3.7, 23.5, 2.5, 6.8, and 1.2% larger than its actual size, respectively. Spared area is also expressed in equivalents of total French land area (AFRA).
Download figure:
Standard image High-resolution image3.2. National drivers of changing cropland
Over 1961–2007 cropland area grew in the majority of the countries worldwide, with strongest expansion in the tropics (figure 4(a)). A notable decline in cropland area took place in only very few—mostly industrialized—countries.
3.2.1. Counterfactual analysis
All else equal, with no population growth since 1961 cropland area would have decreased in every country except Bulgaria (figure 4(b)). Bulgaria was in fact the only country where population did not grow over the study period. The effect of population growth was stronger in developing countries than in industrialized countries and matches with the larger expansion of cropland area observed in these regions (compare figures 4(a) and (b)).
In most countries, a smaller area would have been used for crop cultivation in 2007 if consumption standards had not changed since 1961 (figure 4(c)). Only in Central Africa cropland area would have expanded due to decreasing per-capita caloric consumption over 1961–2007.

Figure 4. Worldwide cropland expansion (red) or regression (green) over 1961–2007 (a) according to country-specific data of [13], and (b)–(f) under the assumption that, all else equal, the decomposition factors P, D, L1, L2 and Y , respectively, would not have changed since 1961. Panel (b), e.g., depicts the percentage change in cropland area between 1961 and 2007 assuming no change in population size over this period, while all other decomposition factors developed as observed.
Download figure:
Standard image High-resolution imageWhile for processing losses no clear geographical pattern appears, a significant share of cropland expansion (corresponding to more than 50% of cropland area of 1961) could have been avoided in some countries (figure 4(d); see in particular Australia and South America) if these losses had not increased since 1961.
Under the assumption of no change in import–export balances since 1961, significantly more land would have gotten under the plough in all countries that today import more crops than in 1961 (figure 4(e); e.g., most countries of Africa, Central America and South East Asia). Conversely, a considerable area of land would have been spared in Central Europe, North America and South East America, which exported increasingly large quantities of crops over 1961–2007.
Without changes in area intensity (i.e., yields), cropland area in most countries would have grown even more strongly than actually observed (figure 4(f)). The only exceptions constitute some regions in Central Africa and South East Asia, where improvements in crop yields were weak or non-existent.
3.2.2. Dominant drivers of cropland expansion and regression
In relative terms, population growth and yield gains exerted the strongest effects on national cropland expansion and sparing, respectively (figures 5(a) and (b)). Notable exceptions include China and parts of Southern Europe, where the effect of increasing per-capita consumption surpassed the effect of a growing population; and other industrialized countries, where cropland expansion was most strongly driven by shifting trade balances towards exports or increasing processing losses (figure 5(a)). On the other hand, in many African countries and a few industrialized countries (e.g., Australia, Japan, Norway), more cropland area was spared due to increasing imports than due to changing yields (figure 5(b)). The Democratic Republic of Congo was the only country where the factors restraining cropland expansion were dominated by falling per-capita consumption. Yearly decomposition data for selected countries, where factors other than population growth and yield changes were dominant, can be found in the supplementary data (figure S2 available at stacks.iop.org/ERL/9/024011/mmedia).

Figure 5. Dominant drivers of national cropland (a) expansion and (b) regression. For each country the decomposition factor is shown that produced the largest per cent of positive or negative change in counterfactual analysis (cf figure 4).
Download figure:
Standard image High-resolution image
4. Discussion
Until the end of the century, global human population is estimated to grow by another 3 billion people [18], approximately the same number of people as were added over 1961–2007. Considering that already today 1 billion people are undernourished [19], providing high quality food for all human beings without greatly expanding cropland area amounts to a great challenge [20]. Our results help to frame this challenge by revealing realistic change rates of important drivers based on historical data. They also provide the empirical basis needed to undertake well-informed projections of land-use change in the future. Based on the results of this study, what are the most important levers to meet this challenge? What are the trends to be expected in the (near) future?
4.1. Slowing population growth
In accordance with other recent decomposition studies [10, 11], our analysis shows that human population growth has been the dominant driver of cropland expansion in the majority of countries worldwide. In this context it is interesting to consider the implications of different versions of the most recent UN human population projections [21]. Assuming that the average annual change rates in contributions of crop yields (−1.6%), per-capita caloric consumption (+0.5%), and processing losses (−0.04%) observed in this study were sustained into the future, the critical threshold of human population growth tantamount to a halt in cropland expansion would roughly be the sum of these rates, thus 1.1% per year. This threshold is undercut already by 2015 in the medium-fertility variant of the UN projections, and by 2030 in the high-fertility variant. Therefore, if one achieved to keep up current rates of crop yield gain, to cap further rise in average per-capita caloric consumption, and to avoid any significant increases in processing losses (but see caveats below), population growth would no longer drive a further expansion of cropland beyond these dates.
4.2. Changing consumption standards
Our results also affirm the observation of [11] that changes in dietary standards have been the second most important driver of cropland expansion in the past. Clearly, per-capita consumption needs to be raised further in countries where people are undernourished today. A few central African countries, most prominently the Democratic Republic of Congo, have even seen a decrease in per-capita consumption over 1961–2007. Concurrently, standards of many industrialized could easily be lowered, since between 30% and 40% of what we label consumption in this study is effectively wasted in the household and at retail level [22]. In the coming decades, as population growth rates are expected to slow, many emerging nations will most likely follow the recent path of China [11], where an increase in per-capita consumption (paralleled with higher incomes) has been the dominant driver of past cropland expansion, outpacing population growth.
4.3. Increasing crop yields
Providing reasons for optimism, our results indicate that over 1961–2007 yield gains were able to keep up with global population growth. This finding is corroborated by [10], who consider crop yield data up to the early 1990s. Kastner et al [11] also report on the near compensation of global population pressures by increasing crop yields over 1963–2005 (although their results are not directly comparable to ours as their yield calculations implicitly account for losses due to meat consumption). Regarding future developments, the slowing of global yield gains since the mid-1980s [3] (also visible for wheat in figure 3(a)), paralleled by falling rates of investment into agricultural R&D [23], might point to critical impediments for the continuation of past trends. Sustaining past increases of crop production into the future is not a given, especially if one also considers potentially detrimental effects of climate change on global crop yields [24]. At the same time large yield gaps wait to be closed in many countries that are currently lacking adequate technologies [25]. Our results reiterate that crop yields have especially been lagging behind in Africa, mainly due to a lack of fertilizer and high-yielding crop varieties [26]. Globally, yield gains in the three major staple crops, maize, wheat and rice have contributed most to potential land sparing. However, as these crops are already dominant today (occupying approximately 45% of harvested area in 2007, see supplementary data figure S1 available at stacks.iop.org/ERL/9/024011/mmedia) and their yields are in many world regions already at or near their ceilings (given current technologies), diversification of crops and investment into neglected crop types are important options to consider [3].
4.4. Reducing processing losses
Processing losses (stemming from increasing meat shares in human diets, inapt storage and transportation facilities in many developing countries, and a growing use of agricultural products for non-food purposes) did not appear in our analysis as distinct drivers of global cropland expansion in the past, in accordance with [10]. Taking individually they are however critical factors that will determine the pressure to expand cropland area in the future. From 1961 to 2007 the share of animal products in total caloric consumption at the global level increased by approximately 2% to 17.5% (with practically all of the increase happening after 1990; calculated based on [13]). The signature of this trend has not yet emerged in our global decomposition data. An exception might be China, where a switch from negative to positive contributions of changes in processing losses to cropland expansion rates is discernible (see supplementary data figure S2a available at stacks.iop.org/ERL/9/024011/mmedia). Further research is required to unambiguously attribute this switch to rising meat consumption in China [27]. Kastner et al [11] do not consider changes in combined processing losses, but find, based on a different approach (see methods), that the increasing consumption of animal products accounted for nearly half of the increase in global land requirements for food over 1963–2005. The second global trend that we expect to see emerging in decomposition studies of drivers of cropland expansion is the increasing use of crops for bioenergy production [28]. Our global decomposition data shows a sudden but persistent increase in processing losses after the year 2000. Whether this can be attributed to the increased conversion of potential food crops into bioenergy products, which started to be globally important around this time [29], also warrants further research.
4.5. Shifting trade balances
Shifting trade balances have, according to our analysis, significantly affected national cropland expansion rates. In some countries, changes in trade have influenced changes in cropland extent more strongly than any of the other drivers considered. Because population growth rates and increases in per-capita consumption will eventually saturate as the world gets richer, trade balances can be expected to become relatively more influential. Projected expansion of global trade in agricultural commodities [30] is likely to further amplify this effect. At first glance, altering trade balances does not constitute a global solution to the challenge of potential land scarcities, as the land spared in one country will need to be put under the plough in another country. However, globally optimizing land-use patterns so as to only use the most fertile and best-managed land for crop cultivation has been shown to produce significant potential land savings while ensuring enough food for all [31]. Under this scenario, changes in imports and exports of crops would probably become the all dominating driver of national cropland expansion rates.
5. Conclusion
In conclusion, let us examine what our results can contribute to answer the question posed in the title of our study 'Will the world run out of land?' On the one hand, our study demonstrates that for the last five decades gains in crop yields have kept pace with population growth, considerably slowing the cropland expansion that would have otherwise occurred. If these rates of yield improvements were sustained into the future, and population growth slowed down as projected by the UN, the pressure to expand cropland, even under further moderate increases of per-capita food consumption, would gradually subside. On the other hand, our study hints at recent increases in processing losses (most likely due to increased meat consumption and bioenergy production) that might emerge as new important drivers of cropland expansion, jeopardizing the prospect of halting cropland expansion in the short to medium term. Finally, as with all studies that extrapolate past observations into the future, all of these considerations need to rely on the assumption that the past can in any meaningful way inform about the future. Yet, due to the major disruptions that climate change might bring upon the global food production systems [32] it is not a given that the major drivers of cropland expansion will continue to change as smoothly and predictably as observed during the last five decades.
Acknowledgments
We thank two anonymous referees and a member of the ERL Editorial Board for their constructive comments on earlier versions of the manuscript. VH is especially grateful to the organizers of the Global Sustainability Summer School 2010 at the Santa Fe Institute, where she initially developed the research idea for this study. BB has contributed to this work as part of GLUES (Global Assessment of Land Use Dynamics, Greenhouse Gas Emissions and Ecosystem Services). This project belongs to the 'Sustainable Land Management' research programme launched by FONA (Research for Sustainable Development), as a framework programme within the resources and sustainability field of action, and is funded by BMBF (German Federal Ministry of Education and Research). [Support code: 01LL0901A]. We also gratefully acknowledge the financial support by the VOLANTE project (FP7 Collaborative Project, grant agreement No. 265104).