
Abstract
Peatlands in Amazonian Peru are known to store large quantities of carbon, but there is high uncertainty in the spatial extent and total carbon stocks of these ecosystems. Here, we use a multi-sensor (Landsat, ALOS PALSAR and SRTM) remote sensing approach, together with field data including 24 forest census plots and 218 peat thickness measurements, to map the distribution of peatland vegetation types and calculate the combined above- and below-ground carbon stock of peatland ecosystems in the Pastaza-Marañon foreland basin in Peru. We find that peatlands cover 35 600 ± 2133 km2 and contain 3.14 (0.44–8.15) Pg C. Variation in peat thickness and bulk density are the most important sources of uncertainty in these values. One particular ecosystem type, peatland pole forest, is found to be the most carbon-dense ecosystem yet identified in Amazonia (1391 ± 710 Mg C ha−1). The novel approach of combining optical and radar remote sensing with above- and below-ground carbon inventories is recommended for developing regional carbon estimates for tropical peatlands globally. Finally, we suggest that Amazonian peatlands should be a priority for research and conservation before the developing regional infrastructure causes an acceleration in the exploitation and degradation of these ecosystems.
Export citation and abstract BibTeX RIS

Content from this work may be used under the terms of the Creative Commons Attribution 3.0 licence. Any further distribution of this work must maintain attribution to the author(s) and the title of the work, journal citation and DOI.
1. Introduction
The large carbon stocks of Amazonian forests have been recognized for many years [1] and estimates of total Amazonian above-ground biomass (AGB) for terra firme (dry land) forest, based on forest census data and remote sensing range from 58 to 134 Pg C [2–8]. However, there is another significant store of carbon in Amazonia which has not, to date, been incorporated into regional or global carbon budgets: the carbon stored in peatlands. Recent work on the Pastaza-Marañón foreland basin (PMFB) in Northwest Peru has revealed the presence of extensive and deep accumulations of peat that contain 2–20 Pg C in below-ground stocks [9, 10]. Such values are significant in the context of both national (e.g. 6.9 Pg C held in AGB in Peru [11]) and regional carbon budgets. Hence it is important that the uncertainties in these estimates are reduced.
The PMFB in Northwest Peru contains the most extensive peatlands yet discovered in Amazonia [10]. It is a subsiding foreland basin of c.100 000 km2 formed during the Cenozoic uplift of the Andes [12–15] and possibly still actively subsiding today [16]. High rainfall, frequent flooding and low lying topography provide the waterlogged and anoxic conditions required for peat formation which, in this geological setting, have enabled significant thicknesses (up to 7.5 m) of peat to accumulate [9, 17, 18]. Much smaller peatlands have also been reported from Southern Peru (294 km2, 0.027 PgC [19]), central Amazonia (area and carbon stocks unknown [20]), and North of the Amazon basin in the Orinoco delta (7000 km2, 0.049 Pg C [21]). In contrast with the better-known but highly degraded and at-risk peatlands of SE Asia [22], those of the PMFB remain largely intact and the threat of destruction from direct human impacts is comparatively low. Climate models suggest that by the end of the 21st century, the Western Amazon, unlike SE Asia, is not likely to become significantly drier, though it is predicted to warm significantly [23, 24]. Increasing wet season precipitation over the last 20 years supports this prediction [25], although evidence for decreased dry season river discharge over the same time period could suggest enhanced seasonality rather than any change in annual precipitation [26]. Therefore, improving carbon storage estimates for the PMFB peatlands is important as they face an uncertain future, which could enhance or diminish this carbon stock depending on climatic and land use change.
Uncertainties in the existing estimate of the amount of carbon stored in the PMFB peatlands derive from a number of factors. The geographical extent and remoteness of the PMFB mean that a relatively small proportion of the peatlands have been mapped in the field, and variability in peat thickness and carbon density at local scales mean that extrapolations from a small number of field observations introduce large uncertainties. In addition, although most of the peatlands are forested, little attempt has previously been made to estimate the above-ground component of the carbon stock using ground data [27, 28], which may be valuable for validating recent remote sensing estimates of above-ground carbon stocks that include the PMFB [11].
A remote sensing approach is useful for mapping peatland area as it provides detailed information at a regional scale, and is especially promising in the PMFB because the peatlands have been found to be floristically, structurally and topographically distinct from terra firme [18, 28]. These features are not only distinctive on the ground, but also in satellite data. Landsat products are effective at describing the surface reflectance properties of vegetation and have previously been used to distinguish between peatlands and terra firme in this region and elsewhere [10]. L-band SAR (synthetic aperture radar) products, such as Advanced Land Observing Satellite (ALOS) phased array type L-band SAR (PALSAR), are able to penetrate the canopy and are effective in characterising forest structure [29, 30] and biomass in terra firme and peatland forests [31–33]. Additionally, SAR responds to soil moisture and can therefore distinguish between inundated and non-inundated areas [34]. SRTM (shuttle radar topography mission) data provide an estimate of elevation and are useful for identifying large-scale topographical boundaries within tropical forests [35, 36]. The most effective approaches to mapping vegetation and estimating AGB identified so far combine data from multiple sensors, such as those described above, in a single analysis [33, 37–40].
Remote sensing data are not only useful for delineating peatland area but may also be useful for constraining the properties of peat (thickness, bulk density and carbon concentration) that account for much uncertainty in estimating carbon stocks. In the PMFB, peat has been found beneath palm swamp forest, 'pole' forests (low stature forest with many thin-stemmed trees), and almost entirely herbaceous 'open' communities [18, 78]. These different peatland vegetation types are associated with different peat properties and, therefore, differing quantities of below-ground carbon, as has been observed elsewhere in tropical peatlands [41, 42]. If peatland vegetation types can be identified by remote sensing and the amount of below-ground carbon is associated with vegetation type, as has been shown for Northern peatlands [43], then detailed vegetation mapping has the potential to better constrain regional carbon estimates.
In addition to our use of data from multiple sensors and using vegetation type as a constraint on peat properties, our approach differs from previous work in the region [10] in the following ways:
- remote sensing classifications have been performed on a single image which spans the entire region, rather than two Landsat scenes individually which can introduce errors in area estimates;
- the number of training points is approximately twice as large as in previous studies, providing more data for the remote sensing classification;
- the number of measurements of peat thickness, bulk density and carbon concentration has also been doubled, providing more representative mean values;
- the contribution of AGB has been included, utilising recently published species-specific allometric equations for palms [44], which are a dominant component of peatland forests.
We thus incorporate vegetation and soil data with a number of suitable remote sensing products (Landsat, ALOS PALSAR and SRTM) to answer the following questions:
- 1.What is the total area and carbon stock of the peatlands of the PMFB?
- 2.How large are the AGB and peat elements of the carbon stock of the peatlands of the PMFB, and how do these vary spatially?
- 3.What are the relative contributions of the different peatland ecosystem types (pole forests, palm swamps and open peatlands) to the total carbon stock of the PMFB?
- 4.How accurate are our estimates of peatland area and carbon storage likely to be, and where does the uncertainty lie?
2. Methods
2.1. Study area and field data
The study area is the PMFB, located in Loreto, Northeast Peru (figure 1). Four categories of field data were used (table S.1): (1) 218 ground reference points, used for remote sensing classification; (2) 24 forest census plots, used to estimate quantities of above-ground carbon; (3) 218 peat-thickness measurement points, used to determine quantities of below-ground carbon; and (4) 33 peat cores, from which C content and dry bulk density were measured. The equal number of ground reference points and peat thickness measurements is coincidental: only 115 of the measurements occur at the same place. Some of these sites were selected as they have been identified as peatlands in previous studies [9, 10]. Other sites were selected based on examination of Landsat data and chosen to provide a representative sample of the range of ecosystem types known to harbour peat.
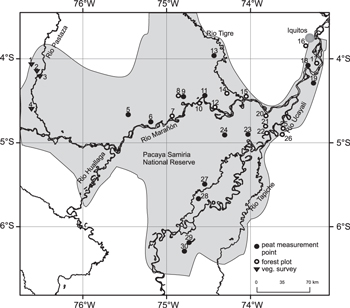
Figure 1. The location of 30 clusters of study sites within the PMFB (shaded area). Filled dots represent clusters of peat depth measurement points; ringed dots represent individual or clusters of 0.5 ha forest census plots; and triangles represent vegetation surveys where peat thickness was not measured (data from [45]). The boundary of the PMFB has been delineated using SRTM elevation data and is based on an elevation drop from c.140 to c.120 m above sea level. Numbers correspond to the site names provided in table S.1.
Download figure:
Standard image High-resolution image2.2. Satellite imagery
All remote sensing image processing and analysis was conducted in ENVI 5.1 (Exelis VIS). Three data products were used: Landsat Thematic Mapper data from the Landsat 5 satellite (six scenes using bands 4, 5 and 7), ALOS/PALSAR (25 scenes using HH and HV polarizations) and SRTM [46]. A final seven-band image stack consisting of Landsat bands 4, 5 and 7, PALSAR bands HH, HV and their ratio (HH/HV), and an SRTM elevation band in metres above sea level was then created (figure 2). Details of images (table S.2) and pre-processing can be found in the supplementary material.

Figure 2. Remote sensing data mosaics. Panel A is an RGB composite Landsat image with bands 4, 5, and 7 assigned to red, green and blue, respectively. Panel B is an RGB composite of the PALSAR data, with HH, HV and HH/HV bands assigned to red, green and blue. Panel C is the SRTM data showing estimated metres above sea level.
Download figure:
Standard image High-resolution image2.3. Image classifications
A supervised classification method was used whereby a number of 'known pixels', assigned to predefined classes, were used to train a classifier for all pixels in the image. These known pixels correspond to ground reference points of a known location and class. In this study these classes are land cover or vegetation types corresponding to three peat-forming (pole forest, palm swamp and open peatlands) and four non peat-forming categories (terra firme/occasionally flooded forest, seasonally flooded forest, open water, and urban areas/river beaches). 218 ground reference points were used: half of these were used as known pixels to perform the classifications, henceforth referred to as 'training data'. The remaining ground reference points (referred to as 'test data') were used to test the accuracy of the classifications by quantifying how closely the predefined classes of these known pixels correspond to the classes they were assigned by the classification. Details of ground reference points can be found in the supplementary information.
Three classifications were undertaken, firstly using Landsat data alone, secondly using Landsat and PALSAR data, and finally using Landsat, PALSAR and SRTM data. The accuracy of each classification was assessed and the most accurate classification was used to provide the area estimates that we used to generate carbon stock estimates. The support vector machine (SVM) classifier in ENVI was used for all classifications because this approach has been found to produce accurate results with limited field data [47]. In this instance it was also more accurate than either the maximum likelihood or ENVI standard neural network classifiers. The default ENVI SVM classifier was used with the radial basis function kernel type. The SVM classifier is a binary classifier but a multiclass classification is achieved by implementing a pairwise classification strategy.
2.4. Above-ground carbon measurements
Twenty-four 0.5 ha forest census plots were established following the RAINFOR (Amazon Forest Inventory Network) protocol [48]. Diameters of all trees with dbh (diameter at breast height, 1.3 m) ≥10 cm were recorded and each tree was identified to species (c. 70% of individuals) or genus level (c. 30% of individuals) by comparison with specimens held in herbariums Herrerense (HH) and Amazonense (AMAZ). Stem height of palms was measured using a clinometer or a laser range finder. The plots were established in five field seasons in 2008, 2009, 2010, 2012 and 2013. Biomass of dicot trees was estimated using the pan-tropical three-parameter (dbh, wood density and E) equation of [49]. Species-specific wood density values were obtained from [28] where available, and the global wood density database otherwise [50, 51]. These sources accounted for more than 95% of calculations in all plots. When species-specific wood density values were not available then a genus-level, or family level mean was used, and if no family-level values were available then the mean plot wood density was used, following [52]. Palm biomass was estimated using species-specific allometric equations [44] which require stem or total height as the only parameter. Above-ground carbon was assumed to be 50% of above ground biomass
2.5. Below-ground carbon measurements
Three measurements are required to determine quantities of below-ground carbon: peat thickness, dry bulk density and carbon concentration. Peat thickness was measured at each peat measurement point using a Russian-type corer [53], from both the edges and centre of the peatlands, though the number of measurements made varied between sites. Stratigraphic units were visually assessed in the field and assigned to peat, 'clayey peat', or 'mud' (deposits dominated by minerogenic sediments) following [10]. Deposits assigned as 'mud' were excluded from all further analysis and were not included in peat thickness measurements. Thirteen peat cores from different vegetation types were analysed as part of this study. Dry bulk density (dry weight (g)/volume (cm3)) was calculated on 100 cm3 samples taken every 50 cm from the peat core and dried at 80 °C for 24 h or until a constant weight was reached. Carbon concentration was primarily determined using previously published data from 30 cores [9, 10], where carbon concentration was measured every 50 cm down-core. Additionally, ten further cores were used in which carbon concentration was determined in four samples from 5, 10, 20 and 30 cm depths. All carbon concentration estimates were made using an Elementar Vario Microcube.
2.6. Carbon stock calculations
The above- and below-ground peat carbon pool was calculated using the equation below, following [54]:

where: CP is the total peatland carbon pool (Pg), p represents each peatland ecosystem type, v represents the total number of peatland ecosystem types, Dp is peat thickness (m), ρp is dry bulk density (kg m3), Cp is carbon concentration (expressed as the percentage mass of carbon in the dry peat), AGCp is above-ground carbon (kg m2), and Ap is area (m2).
In order to generate mean values and confidence intervals for the carbon stock estimates for each peatland ecosystem type, a bootstrap resampling and randomized Monte Carlo method was used as the data are not normally distributed. Firstly, measured values for each variable of equation (1) were grouped into the three peatland ecosystem types providing a distribution of values for each variable in each ecosystem type, e.g. peat thickness in pole forest or bulk density in palm swamps. These distributions of values were then resampled with replacement 1000 times, generating a series of simulated bootstrapped distributions for each variable in each ecosystem type. A randomly selected, single value from each simulated distribution was then entered into equation (1). This process was repeated 107 times, to generate a distribution of simulated carbon stock values for each ecosystem type, from which the mean value and 95% confidence limits could be extracted. Confidence intervals for peatland area were generated separately using the method described by [55], whereby the confusion matrix of the classification was used to estimate map classification error and 95% confidence intervals for the area of each peatland ecosystem type. These 95% confidence intervals were used to generate a simulated distribution of 1000 values of area for each peatland ecosystem type.
2.7. Sensitivity analysis
To assess the importance of each input component (Dp, ρp, Cp, Ap and AGCp), as defined in equation (1) in determining the carbon stock output in each peatland ecosystem type, ranked partial correlation coefficients (RPCCs) were used. RPCCs assess the significance of the relationship between each input component and the carbon stock estimate [56] whilst controlling for variation in the other terms. This was done by extracting 1000 simulated carbon stock values and the corresponding input values; RPCCs were then calculated for each input component in each peatland ecosystem type. All statistical analysis was performed in R [57].
3. Results
3.1. Carbon stock of the PMFB
The total peatland area of the PMFB is estimated to be 35 600 ± 2133 km2 (table 1). Palm swamps account for the majority of the peatland area (78 ± 1.5%), with pole forests and open peatlands accounting for 11 ± 1.7% and 11 ± 0.3%, respectively (table 1). Palm swamps have the greatest total carbon stock (2.3 Pg C), followed by pole forests (0.5 Pg C) and open peatlands (0.3 Pg C), giving a total peatland carbon stock of 3.14 Pg C for the PMFB. However, pole forests store carbon at the greatest density (1391 ± 710 Mg C ha−1). All three peatland ecosystem types store a greater amount of carbon per unit area than neighbouring terra firme forest (figure 3).
Table 1. Summary of above- and below-ground carbon stocks in different peatland vegetation types within the PMFB and the mean, minimum and maximum values of the parameters used to calculate these figures and their corresponding 95% confidence intervals. AGC and BGC refer to above- and below-ground carbon stocks respectively. Confidence intervals for the carbon stock estimates are based on a bootstrap resampling and randomized Monte Carlo method.
| Peatland ecosystem type | Area (km2) | Dry bulk density (g cm−3) | Peat thickness (cm) | C conc. (%) | AGC (Pg) | BGC (Pg) | Total C stock (Pg) | |
|---|---|---|---|---|---|---|---|---|
| Pole forest | Mean | 3,686 | 0.084 | 315 | 50.5 | 0.030 | 0.494 | 0.524 |
| 95% CI | ±810 | ±0.007 | ±26.8 | ±1.6 | 0.009–0.074 | 0.110–1.131 | 0.138–1.174 | |
| Min | — | 0.01 | 90 | 23.2 | — | — | — | |
| Max | — | 0.239 | 660 | 59.1 | — | — | — | |
| Palm swamp | Mean | 27,732 | 0.099 | 173 | 44.0 | 0.263 | 2.073 | 2.336 |
| 95% CI | ±1101 | ±0.009 | ±23.4 | ±2.7 | 0.138—0.355 | 0.012—5.738 | 0.268—5.997 | |
| Min | — | 0.028 | 0 | 24.0 | — | — | — | |
| Max | — | 0.181 | 540 | 55.6 | — | — | — | |
| Open peatland | Mean | 4,181 | 0.051 | 265 | 48.5 | — | 0.277 | 0.277 |
| 95% CI | ±222 | ±0.016 | ±37.8 | ±2.8 | — | — | 0.034—0.974 | |
| Min | — | 0.012 | 50 | 27.7 | — | — | — | |
| Max | — | 0.183 | 450 | 56.1 | — | — | — | |
| Total | 35 600 | — | — | — | 0.293 | 2.844 | 3.137 | |
| 95% CI | ±2133 | — | — | — | — | — | 0.440—8.145 |

Figure 3. Above- and below- ground carbon density of the three peatland ecosystem types: open peatlands (OP), palm swamps (PS), pole forests (PF) and mean values for Amazonian terra firme forests (TF). The negligible AGC of open peatlands is assumed to be zero. Terra firme above-ground values are taken from [52] and below-ground values from [58]. Error bars represent standard errors.
Download figure:
Standard image High-resolution imageOverall, approximately 90% of the carbon in these peatland ecosystems is stored below ground in peat, with the remaining 10% stored in AGB, though this ratio varies between peatland ecosystem types. Pole forests in this study are always located on thick peats (>2.5 m) and have low AGB stocks due to their low stature and thin trunks. Palm swamps occur on both thin and, less typically, thick peats, and store large amounts of carbon in AGB, comparable to quantities of AGB found in terra firme forests (figure 3). Un-forested (open) peatlands were assumed to have negligible AGB with all carbon stored in peat, which was variable in thickness. Open peatlands had the lowest carbon density, as although their below-ground carbon density was approximately equivalent to that of palm swamps, the lack of appreciable AGB reduced their overall carbon stock (figure 3).
3.2. Distribution of peatland ecosystem types
Peatlands in this region are not randomly distributed across the landscape but instead appear to be largely confined to the low-lying areas of the PMFB (figure 4). Whilst individual pixels in upland areas may have spectral and/or structural similarities to peatland vegetation, they can be assumed to be part of the upland forest mosaic in the form of tree fall gaps, heavily degraded forest, small isolated swamps in topographic depressions, or patches of white sand forest. Some of these areas may contain shallow peat deposits, but their inclusion in the classification would lead to increased confusion between terra firme forest and peatlands and potentially overestimations of peatland area. Furthermore, the different peatland ecosystem types show a strong spatial pattern across the PMFB (figure 4). Pole forests are apparently restricted to the Northeastern part of the basin; palm swamps are most extensive in the Pacaya-Samiria National Reserve and bordering the Rio Pastaza (see figures 1 and 4), and open peatlands are most common in the Northwest and far South of the region (figure 4).
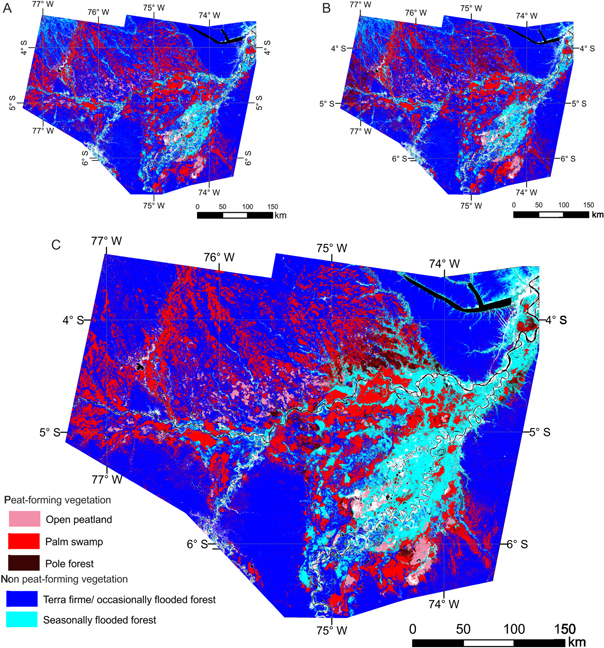
Figure 4. The three support vector machine supervised classifications of the study area, created from Landsat bands 4, 5 and 7 alone (panel A), Landsat bands 4, 5 and 7 and PALSAR bands HH, HV and HH/HV (panel B) and finally Landsat bands 4, 5 and 7, PALSAR bands HH, HV and HH/HV and an SRTM band (Panel C). Colours represent different land cover categories: terra firme and occasionally flooded forest (dark blue), palm swamp (red), open peatland (pink), pole forest peatland (dark red), river beach and urban areas (white), seasonally flooded forest (light blue) and open water (black).
Download figure:
Standard image High-resolution image3.3. Performance of remote sensing classification
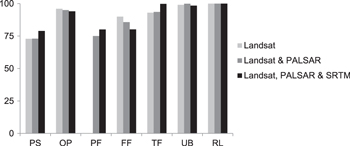
The classification performed well when tested against an independent dataset (table 2 and figure 5), with a mean, minimum and maximum user's accuracy (the proportion of the classified area that corresponds to the correct class based on ground reference points) of 91%, 79% and 100%, and an overall kappa coefficient (coefficient of agreement accounting for agreement occurring by chance) of 0.94. The most accurately mapped vegetation class was terra firme forest; pole forest was the least accurately mapped. The inclusion of the three different satellite products, including optical (Landsat) and radar (ALOS PALSAR and SRTM) data, improved the accuracy of the classification for most classes apart from flooded forests (figure 5) with mean user's accuracy, producer's accuracy (the proportion of ground reference pixels that have been correctly classified) and kappa coefficients all increasing with the addition of each product (table S.3).
Table 2. Confusion matrix for the final SVM classification using Landsat, PALSAR and SRTM data showing the number of pixels per class in both the training data set (used to generate the classification) and test data set (used to assess the accuracy of the classification), how data from these two independent datasets correspond and where errors of omission and commission are found. Additionally the total number of ground reference points (GRPs) for each class and the percentage accuracy for each training and test class are shown. Abbreviations refer to land cover classes; Palm swamps (PSs), open peatlands (OPs), pole forest (PF), seasonally flooded forest (FF), Terra firme/occasionally flooded forest (TF), urban areas and river beaches (UB) and open water rivers and lakes (RLs).
| PS-test | OP-test | PF-test | FF-test | TF-test | UB-test | RL-test | Total | Total GRPs | Accuracy (%) | |
|---|---|---|---|---|---|---|---|---|---|---|
| PS-train | 538 | 0 | 41 | 0 | 103 | 0 | 0 | 682 | 37 | 78.9 |
| OP-train | 0 | 425 | 0 | 0 | 0 | 27 | 0 | 452 | 12 | 94.0 |
| PF-train | 10 | 0 | 88 | 2 | 10 | 0 | 0 | 110 | 17 | 80.0 |
| FF-train | 12 | 1 | 9 | 149 | 2 | 13 | 0 | 186 | 19 | 80.1 |
| TF-train | 2 | 0 | 0 | 0 | 1881 | 3 | 0 | 1886 | 53 | 99.7 |
| UB-train | 0 | 20 | 0 | 0 | 0 | 1238 | 0 | 1258 | 47 | 98.4 |
| RL-train | 0 | 0 | 0 | 0 | 0 | 0 | 1042 | 1042 | 33 | 100 |
| Total | 562 | 446 | 138 | 151 | 1996 | 1281 | 1042 | 5616 | 218 | — |
| Accuracy (%) | 95.7 | 95.3 | 63.8 | 98.7 | 94.2 | 96.6 | 100 | — | — | — |
Figure 5. The proportion of the classified area that corresponds to the correct class based on ground reference point (user's accuracy) assessment for three SVM classifications using only Landsat (light grey), Landsat and PALSAR (dark grey) and Landsat, PALSAR and SRTM (black).
Download figure:
Standard image High-resolution image
Landsat data were generally effective at distinguishing land cover classes, and successfully identified some of the areas of peatlands. However, the Landsat classification was not able to differentiate between pole forest and palm swamp, or between pole forest and terra firme forests (figure 5). This was improved by the addition of ALOS PALSAR data, which can identify the structural differences between the forest types because the backscatter signal of pole forest (many small trees) is very different to that of both terra firme forest (fewer but larger trees) and palm swamp forest (many palm species with no lateral growth). Finally, the use of SRTM data further improved the classification by constraining it to areas of suitable low-lying topography within the PMFB (figure 5 and table 2).
4. Discussion
4.1. Carbon stock of the peatlands of the PMFB
Our analysis confirms the importance of the peatlands of the PMFB as a substantial store of carbon (best estimate 3.14 Pg C), and the most carbon-dense landscape in Amazonia, storing 892 ± 535 Mg C ha−1. Of the three peatland vegetation types, pole forest is the most carbon-dense with 1391 ± 710 Mg C ha−1. Compared with typical terra firme forests which store 63–190 Mg C ha−1 in AGB [4, 52] and a similar amount (132 Mg C ha−1) below ground [59], our study therefore suggests that peatland pole forests are, by a large margin, the most carbon-dense forest type in Amazonia.
Our best estimate of the total PMFB peatland carbon stock of 3.14 Pg C, including below-ground carbon, is nearly 50% of a recent estimate of above-ground carbon for the whole of Peru (6.9 Pg C [11], but see table S4), whilst only occupying 3% of the area of Peruvian forest [5]. It is therefore apparent that these peatlands account for a very large proportion of carbon stocks at regional and national levels and therefore need to be included in total carbon storage estimates. Where another study [6] estimated below-ground biomass stocks for Amazonia, a simple positive relationship between AGB and BGB was assumed. In the PMFB the reverse of this relationship is generally true, illustrating that carbon stocks in peatlands cannot be estimated accurately with more general methods developed for pantropical carbon stock estimates.
AGB typically contributes 10% to the overall carbon stock of these peatland ecosystems; however, this varies between peatland ecosystem types. Unsurprisingly, low-stature pole forest has low AGB (61.8 ± 9.8 Mg ha−1). Previous topographical and geochemical studies have indicated that pole forest occurs on domed, ombrotrophic (i.e. entirely rain-fed) peatlands [18]. The consequently nutrient-poor, acidic conditions exclude many species and presumably also lead to low net primary productivity and, as a result, lower AGB compared to upland forests. Similar structural characteristics are seen in the nutrient-poor white sand forests of Amazonia [60, 61] and on Southeast Asian ombrotrophic peatlands [41, 62]. Palm swamps, in contrast, have an above-ground carbon density (100.9 ± 7.7 Mg ha−1) that is broadly comparable with surrounding terra firme forest (c. 120 Mg C ha−1 [52]). The high AGB of the dominant palm species, Mauritia flexuosa, contributes substantially to the high above-ground carbon density of the palm swamps. M. flexuosa regularly grows to heights greater than 30 m, and due to the lack of lateral growth in the canopy, can achieve high stem densities (>150 individuals ha−1). Moreover, allometric equations that have been developed specifically for palms, provide higher estimates of the biomass of tall, adult Mauritia compared to previous studies [44].
4.2. Sources of uncertainty
The uncertainty associated with our estimate of the total PMFB peatland carbon stock remains substantial (0.4–8.1 Pg C), but significantly lower than previous published estimates (1.7–19.0 Pg C [10]). There is uncertainty associated with each component of the carbon stock calculation and the magnitude of uncertainty within each component varies with vegetation type. Overall, the source of greatest uncertainty is variation in peat thickness and bulk density (table 3). In palm swamps, peat thickness provided the greatest uncertainty due to large variation in peat thickness within and between sites, while in the pole forests, which consistently grow on thick peat, bulk density was the most important source of uncertainty. Systematically increasing these measurements across all peatland ecosystem types and in all areas across the basin would provide more reliable estimates. However, the substantial variation in peat thickness and bulk density occurring both within and between sites suggests that a high degree of uncertainty will likely persist regardless of sampling effort because of the complexity and dynamism of the PMFB landscape. Our analysis indicates relatively little uncertainty associated with the estimated peatland area (table 3). Although this is encouraging, there is an assumption within these uncertainty estimates that the training and testing ground reference points provide complete coverage of the study area, which is not the case. More ground reference points in data-deficient areas are needed to test the classification further. Root biomass is another source of uncertainty in our analysis: although fine roots form part of the peat matrix and are incorporated in our BGC estimates, coarse root biomass is not included in our analysis. Further work on coarse root volume and biomass is required in these ecosystems to account accurately for this uncertainty.
Table 3. The relative importance of each input component in determining carbon stock for each peatland ecosystem type. Importance is defined on the basis of partial ranked correlation coefficients between each input variable and the final output (carbon stock).
| Peatland ecosystem type | Component of carbon stock calculation | Partial rank correlation coefficient (Spearman's ρ) |
| Pole forest | Peat depth | 0.88 |
| Peatland area | 0.25 | |
| Dry bulk density | 0.89 | |
| Carbon concentration | 0.56 | |
| Above-ground biomass | 0.17 | |
| Palm swamps | Peat depth | 0.94 |
| Peatland area | 0.11 | |
| Dry bulk density | 0.81 | |
| Carbon concentration | 0.56 | |
| Above-ground biomass | 0.38 | |
| Open peatlands | Peat depth | 0.88 |
| Peatland area | 0.04 | |
| Dry bulk density | 0.92 | |
| Carbon concentration | 0.49 |
One surprising finding is that our carbon stock estimate is c. 50% of the previous best estimate of 6.232 Pg [10], even with the addition of the AGB component. The disparity between these estimates is partly due to the difference in estimates of total peatland area: our more thorough approach yields an area of 35 600 ± 2133 km2, which is 8258 km2 smaller than the previous estimate of 43 858 km2. The increased number of peat thickness and bulk density measurements also reduced the carbon stock estimate slightly, reducing mean peat thickness from 2.48 to 2.39 m and bulk density from 0.083 to 0.079 g cm−3, although it is encouraging that increasing the number of sites and measurements did not cause large changes in these values. The process of constraining peatland carbon stock estimations by three vegetation types rather than averaging across all individual sites also contributed to reducing our estimate of overall carbon stock. The thickest peat deposits under pole forest account for a small proportion of the total peatland area while palm swamps, although more extensive, store less carbon per unit area.
4.3. The role of multiple remote sensing products
We have shown that combining Landsat, ALOS PALSAR and SRTM products is more effective in distinguishing different ecosystem types in our study area than using any one product alone. In particular, including PALSAR and SRTM datasets in our analysis improved our ability to distinguish between the swamp classes. We recommend the use of this data fusion approach in the future, though we stress that spatial uncertainties remain in the map, particularly to the west of the study area where there are currently few ground reference points. The bootstrap analysis we performed allowed these uncertainties to be propagated through to our carbon estimates.
4.4. Distribution of peatland ecosystem types
A key finding of this study is the strong spatial pattern of the different peatland ecosystem types. Pole forests are largely limited to the Northeastern area of the study region close to the Rio Tigre and are underlain by the thickest, oldest and probably most ombrotrophic peat deposits [10, 18]. The correspondence between thick peat and pole forest may be the result of long term geomorphological stability which has allowed peat to accumulate above the maximum flood level, leading to ombrotrophic conditions, low nutrient status and vegetation succession to pole forest. This explanation is supported by geological evidence that this region has experienced a lower frequency of river avulsions and increased stability since the isolation of the Rio Tigre from the Rio Pastaza c.8000 years BP [63]. The build-up of peat above the maximum flood level during the course of its development in this area is also supported by geochemical evidence which records a transition from high- to low-nutrient status through the peat profile [18], consistent with models of fen to bog transitions in peatlands at high latitudes [64]. Palm swamps, by contrast, are typically found close to large and geomorphologically dynamic rivers [15], and minerogenic intrusions in the peats formed under this vegetation provide evidence of frequent flooding [18]. We suggest that frequent fluvial influence has maintained higher nutrient input throughout their development, up to the present day, and that in these geomorphologically dynamic settings there has not been sufficient time for ombrotrophic conditions to develop. Open peatlands are found primarily close to large and dynamic rivers [16], and while their depth and nutrient status vary [17, 18], radiocarbon dating from the two deepest sites shows they are significantly younger than pole forests [9, 10]. We suggest that open peatlands may represent an early successional community in the development of peatland ecosystems.
Work in progress on the vegetational history of these peatlands will help to test these hypotheses about potential landscape controls on the distribution and development of the different peatland vegetation types. A further vegetation type that is known to harbour peat is seasonally flooded forest [9]. This peatland ecosystem type was excluded from this analysis because it is poorly known (only two such sites, locally known as tahuampa, have been confirmed to hold peat). Further fieldwork is required to quantify its contribution to the carbon stock.
4.5. Contribution of PMFB to the tropical peatland carbon pool
In terms of tropical peatlands globally, the peatlands of the PMFB account for 6.5% of their area and 3.5% of their carbon stocks [54]. Whilst these figures are small in comparison to the deeper and more extensive peatlands of Southeast Asia, the conservation importance of Peruvian peatlands should not be dismissed. Southeast Asian peatlands have experienced decades of destruction, leading to a 50% loss of intact peat swamp forest [22] and large carbon emissions [65, 66]. At current rates of destruction they would be lost entirely by 2030 [22]. Peruvian peatlands, on the other hand, remain almost entirely intact, though they face an increasing range of threats including degradation by large-scale cutting of palms for fruit, hydrocarbon extraction, illegal logging, oil palm plantation expansion, and direct disturbance by proposed rail and road links from the city of Iquitos to the rest of Peru, as well as the knock-on consequences of improved access [67–69]. We therefore suggest that the peatlands of the PMFB should be a priority for carbon-focussed conservation strategies, because they constitute a large carbon stock, and there is an opportunity to protect these areas before infrastructure develops sufficiently for them to be degraded and exploited.
Accurate carbon stock information for tropical peatlands is required to inform initiatives such as reducing emissions from deforestation and degradation (REDD+) [70, 71]. To our knowledge this is the first study in tropical peatlands to estimate both above- and below-ground components of the carbon pool at a regional scale. Estimates of below-ground carbon stocks elsewhere in tropical peatlands have been based on a small number of individual peatlands [19, 72] or on historical, continental or national level inventories, which have little empirical basis and are difficult to verify [62, 73, 74]. AGB estimates have been developed to assess the efficacy of remote sensing products and have used limited ground data [75–77]. We suggest that the method applied here, using extensive above- and below-ground field data alongside multiple remote sensing products, is the most effective way of generating the kind of regional and national carbon stock inventories required by initiatives such as REDD+.
5. Conclusions
This investigation provides the most accurate estimates to date of the carbon stock of an area that is the largest peatland complex in the Neotropics, and confirms the status of the PMFB as the most carbon-dense landscape in Amazonia. The novel approach of combining optical and radar remote sensing with above- and below-ground carbon inventories is shown to increase the accuracy of regional carbon stock estimates and is recommended for developing regional carbon estimates for tropical peatlands globally. The PMFB remains almost entirely intact, but threats to its persistence are increasing. If Amazonian peatlands are to continue to act as a carbon store and avoid the fate of their counterparts in Southeast Asian, then they must be a conservation and research priority.
Acknowledgments
This work was funded by a NERC PhD studentship (NE/J50001X/1). Additional funding for fieldwork was provided by a NERC small grant (NE/H011773/1), The Royal Geographical Society with IGB, The Quarternary Research Association, The Anglo-Peruvian Society and the Earth and Space foundation. Edward Mitchard is funded by a NERC Research Fellowship (NE/I021217/1). Landsat, PALSAR and SRTM data was provided free of charge by USGS/NASA, the JAXA Kyoto and Carbon project and CGIAR respectively. We would like to thank Julio Irarica, Hugo Vasquez, Carlos Mogollon, Frans Ramirez, Sarah Pearl, Esme Shattock and Oliver Clark for their assistance in the field; Ricardo Faroñay, Dennis del Castillo Torres and Jhon del Aguila-Pasquel at IIAP for their support within Peru; Duncan Quincy for valuable remote sensing advice, Christopher Baraloto and Paul Fine for sharing their plot coordinates, Martin Gilpin, David Ashley and Rachel Gasior for help with lab analyses; Amazonia Expeditions Tahuayo Lodge for their support and finally Thomas Kelly, Jacob Socolar and Greta Dargie for helpful discussions.