
Abstract
There is increasing concern about water constraints limiting oil and gas production using hydraulic fracturing (HF) in shale plays, particularly in semiarid regions and during droughts. Here we evaluate HF vulnerability by comparing HF water demand with supply in the semiarid Texas Eagle Ford play, the largest shale oil producer globally. Current HF water demand (18 billion gallons, bgal; 68 billion liters, bL in 2013) equates to ∼16% of total water consumption in the play area. Projected HF water demand of ∼330 bgal with ∼62 000 additional wells over the next 20 years equates to ∼10% of historic groundwater depletion from regional irrigation. Estimated potential freshwater supplies include ∼1000 bgal over 20 yr from recharge and ∼10 000 bgal from aquifer storage, with land-owner lease agreements often stipulating purchase of freshwater. However, pumpage has resulted in excessive drawdown locally with estimated declines of ∼100–200 ft in ∼6% of the western play area since HF began in 2009–2013. Non-freshwater sources include initial flowback water, which is ≤5% of HF water demand, limiting reuse/recycling. Operators report shifting to brackish groundwater with estimated groundwater storage of 80 000 bgal. Comparison with other semiarid plays indicates increasing brackish groundwater and produced water use in the Permian Basin and large surface water inputs from the Missouri River in the Bakken play. The variety of water sources in semiarid regions, with projected HF water demand representing ∼3% of fresh and ∼1% of brackish water storage in the Eagle Ford footprint indicates that, with appropriate management, water availability should not physically limit future shale energy production.
Export citation and abstract BibTeX RIS

Content from this work may be used under the terms of the Creative Commons Attribution 3.0 licence. Any further distribution of this work must maintain attribution to the author(s) and the title of the work, journal citation and DOI.
1. Introduction
With increasing energy production from unconventional shale plays requiring large amounts of water to support hydraulic fracturing (HF), there is concern about limited water supplies. A recent global analysis of water resources relative to shale plays indicates that an estimated ∼40% of shale resources are in arid areas or in areas of high–extremely high water stress, including China, Mexico, and S Africa, ranked 1st, 6th, and 8th in terms of shale gas production, respectively [1–3]. Extreme droughts exacerbate water shortages, with an estimated 15% of global shale resources in areas exposed to high–extremely high drought stress [1]. The USA is the global leader in unconventional oil and gas (O&G) production with initial development of the technology for producing O&G from low permeability shales in the Barnett shale play in Texas using HF and horizontal drilling [4]. In addition, private ownership of mineral rights has incentivized rapid expansion of production in the USA in contrast to government ownership in most other countries. The USA ranks 5th globally in terms of technically recoverable shale gas and 2nd in terms of shale oil resources and was classified as medium to high water stress in the global analysis [1]. An earlier report on USA resources indicates that ∼50% of the 39 000 wells hydraulically fractured (January 2011–May 2013), that consumed ∼100 billion gallons (bgal, ∼380 billion liters, bL) of water, are in high or extremely high water stress areas [5]. The highest shale oil producing plays are in semiarid regions or in regions with low precipitation (Eagle Ford, 34% of USA production in 2013; Bakken, 29%; and Permian Basin, 23%).
Water scarcity is often defined as water demand exceeding water supply. Water demand for HF can be estimated fairly accurately in the USA from commercial and public databases (e.g. IHS Enerdeq database, FracFocus) [4–6]. However, there is considerable uncertainty in future demands based on projected O&G production in these plays (estimated ultimate recovery, EUR). Previous studies indicate that ∼10 000 more wells will be drilled throughout the 20–30 yr life of the Barnett play [7], ∼40 000 more wells in the Bakken [5], and 50 000 in the Eagle Ford [6, 8].
HF water supply is more difficult to assess than HF water demand because the reporting requirements for water sources used for HF in the USA are limited to some states (Pennsylvania, W Virginia, supporting information, SI, section 4, available at stacks.iop.org/ERL/9/124011/mmedia). Surface water supplies are more readily estimated from monitoring data; however, groundwater supplies depend in part on how they are defined. Many studies restrict groundwater supplies for HF to the water flux into the aquifer or recharge, often based on coarse resolution (0.5–1 degree) global models, such as PCR-GLOBWB in the Aqueduct water scarcity product [1, 5, 9]. Others define groundwater supplies based on water storage in aquifers [10]. Water supplies for HF are also impacted by water use in other sectors, particularly irrigation in semiarid regions [11].
Various strategies have been proposed to enhance resilience of HF to water constraints, including trading water among sectors and shifting to non-freshwater sources. Similar approaches are being considered for power generation [12]. Some studies emphasize the potential for trading with irrigated agriculture, considering that this sector is often the largest water consumer in semiarid regions [13, 14]. To date, most HF water has been derived from freshwater resources [5]; however, recent advances in HF technology allow use of more saline water, even as high as 285 000 mg L−1 total dissolved solids (TDS) [15]. While there is much emphasis on reuse (little or no treatment) or recycling (with treatment) of flowback/produced (FP) water, some studies show that flowback water (typically produced within 1–2 weeks after well completion) or water produced from the formation along with O&G (produced water), both referred to generically as FP water, represent a small percentage of HF water demand [4, 16]. Even in the Marcellus Shale, where almost 100% of the water is recycled, recycling accounts for ≤10–30% of the required HF water based on volumes of typical flowback (mean 0.44 × 10⁶ gal/well, 1.7 × 10⁶ L/well) and produced water (0.74 × 10⁶ gal/well, 2.8 × 10⁶ L/well) from wells in Pennsylvania [17] relative to mean HF water use throughout the play (4.4 × 10⁶ gal/well 16.7 × 10⁶ L/well) [5]. Brackish groundwater provides another alternative to freshwater with some referring to the 'sea of brackish water' in the subsurface; however, characterization of this resource is limited in terms of quantity and quality of water that can be recovered [18].
The objectives of this study were to address the following questions:
- (1)How does water use for HF compare with that for other sectors?
- (2)What is the projected demand for HF water for O&G production?
- (3)Is HF in semiarid regions vulnerable to water constraints, i.e. does water demand exceed supply?
- (4)What impacts does HF water use have on water resources?
- (5)What strategies can O&G operators adopt to enhance resilience of HF to water constraints?
This study focused on water use for HF in the Eagle Ford shale play, the top ranked shale-oil producer and 4th ranked shale-gas producer in the USA in 2013 [19, 20]. It builds on a previous analysis that quantified water demand to date for HF in the Eagle Ford play [6]. Water use for HF was considered relative to that for irrigation and municipal sectors. Future HF water demand was projected for the next 20 yr. Water constraints were assessed by comparing HF water demand with estimated freshwater supplies from groundwater recharge and storage from groundwater models [21, 22]. Impacts of HF water use on water resources were evaluated by considering HF water use to date and also the life cycle of shale gas. Adaptive strategies to enhancing resilience of HF water supplies evaluated include use of brackish groundwater, reuse/recycling of FP water, and use of municipal waste water. Results from the Eagle Ford play were compared with those in other semiarid regions, including the Permian Basin play in Texas and Bakken play in N Dakota/Montana. This comprehensive analysis is designed to answer the question of whether HF in semiarid regions will be limited because of water constraints.
2. Materials and methods
2.1. Eagle Ford Shale Play
Unconventional O&G production in the Eagle Ford Play (∼9500 mi2, 24 600 km2 area) began in 2008 (figure 1). Water use for HF in the play totaled 40 bgal (150 bL) for 8301 wells (2009–2013) [6].
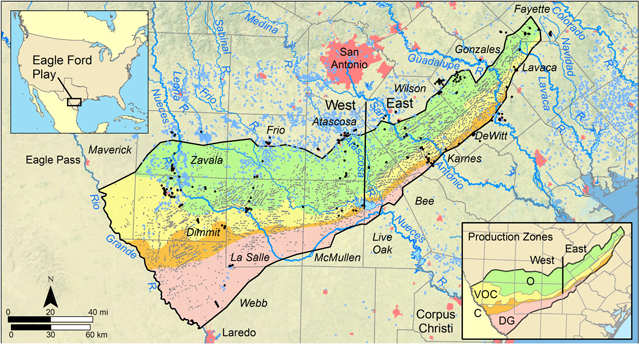
Figure 1. Location of the Eagle Ford Shale play in south-central Texas, USA. The study area (black outline), includes 99% of recently completed (2009–2013) Eagle Ford play area wells. The inset shows the different production zones, including the updip black oil zone (O, green), volatile oil-condensate (VOC, yellow), condensate (C, mustard), and dry gas (DG, rose) [6]. The O, VOC, and C zones were further subdivided into west and east zones. The gray points represent the locations of horizontal oil and gas wells that were completed using hydraulic fracturing (HF) techniques from January 2009 through December 2013 (8301 wells). The black points represent public water supply wells that serve community populations up to ∼10 000 people. The blue points represent irrigation wells, with the highest density upgradient from the HF wells, mostly in the Winter Garden irrigation region. Mean depth of HF wells is ∼2 miles (3.2 km) and the length of horizontals or laterals averages ∼1 mile (1.6 km) [6]. Average HF water use is similar across production zones from oil, through volatile oil, gas condensate (liquid condensed from wet gas at the well head or natural gas plant), and dry gas, on a per well basis (4.7–4.9 × 10⁶ gal/well, 17.8-18.5 × 10⁶ L/well) and per unit length of lateral (930–1020 gal ft−1, 11 500–12 700 m L−1 of lateral). However, HF water use varies spatially and is 17–29% higher in the west relative to the east within each production zone. Oil and gas has been produced in this region since the early 1900s from units such as the Austin Chalk and Edwards Limestone with horizontal drilling used in the relatively tight Austin Chalk for several decades [53]. Conventional oil and gas wells are not shown.
Download figure:
Standard image High-resolution imagePrecipitation in the Eagle Ford play ranges from 19.5 inches/yr (495 mm yr−1) in the west to 38.6 inches/yr (980 mm yr−1) in the east (figure S1). Total population in the play area was ∼0.2 million in 2010 in the mostly rural 16 county area. Nearby major cities include San Antonio (population 2.2 million) and Laredo (population 236 000) (figure S2). Land use/land cover consists of shrubland (45%), pasture (25%), grassland (8%), forest (7%), and cropland (5%) (figure S2). Most cropland and some pasture are irrigated. Major rivers include, from west to east, the Rio Grande, Nueces, Frio, Atascosa, San Antonio, and Guadalupe rivers. Major aquifers in the region include the Carrizo–Wilcox aquifer and the Gulf Coast aquifer system, and minor aquifers include the Queen City, Sparta and Yegua-Jackson aquifers (figures 2, S3) [23]. Groundwater Conservation Districts (8 GCDs) manage regional groundwater according to Texas Senate Bill 1, an omnibus water bill passed in 1997 (figure S4).
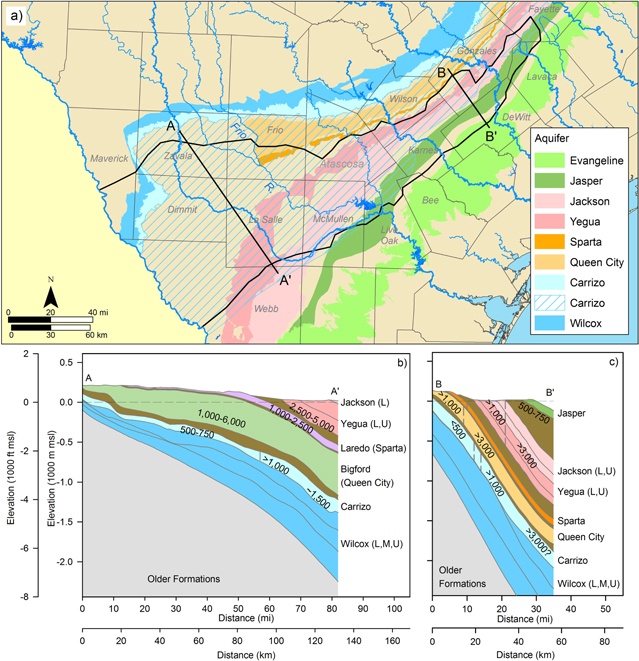
Figure 2. (a) Outcrop and recharge areas for aquifers in the Eagle Ford play area. Major aquifers include the Carrizo–Wilcox and the Gulf Coast (Jasper and Evangeline) and minor aquifers include the Queen City, Sparta, and the Yegua-Jackson. The primary water source in the western region of the Eagle Ford play is the confined section of the Carrizo Sand, represented by the cross-hatched area. Except for the outcrop area lying mostly to the northwest of the Eagle Ford play area, little information regarding water quality is available for the Wilcox units. The Queen City and Sparta aquifers also have equivalent water-bearing units west of the Frio River, although these units are not designated as aquifers in the west because of poor water quality (figure S3) [22]. We did not include water supplies for HF from these units. (b) Cross sections A-A' and (c) B-B'. Values shown in the cross section aquifer units represent approximate groundwater total dissolved solids (TDS) concentrations and dashed vertical lines represent approximate locations of transitional areas between different TDS concentration zones.
Download figure:
Standard image High-resolution image2.2. Data sources and analyses
HF water demand was compared with water supplies at the play and county and square mile grid levels while also considering water use in other sectors to assess vulnerability to water constraints (figure 3). Additional details on data sources are available in SI, section 6. HF water demand or use was based on water use to date (2009–2013) in the Eagle Ford [6]. Information on wells used to supply water for HF was obtained from the Texas Dept. of Licensing and Regulation. HF water use was compared with that for other sectors based on the most recent data from the Texas Water Development Board [24]. Future HF water use was estimated by assuming that the highest established well density (HEWD) for HF wells in each of the seven production zones (2 oil, 2 volatile oil condensate, 2 condensate, and 1 dry gas) or county/production zone intersections (40) would apply to the entire play (SI, section 6, tables S1, S2).
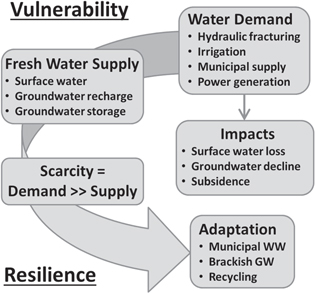
Figure 3. Water demand for HF is based on data on HF water use to date (2009–2013) from IHS and FracFocus databases [6]. Projected HF water demand assumes that additional HF wells will be drilled to achieve the current highest established well density (HEWD) in each of the seven production zones (east and west oil, VOC, and condensate zones, and dry gas zone). Projected HF water demand was calculated by multiplying the number of wells to be drilled in each production zone by the 2013 average HF water use per well in each zone. Water supplies were estimated from surface water (SW) based on data from Water Masters. Recharge rates were determined from a global model (PCR-GLOBWB (PCR-GLOBWB) [25], regional recharge estimates from groundwater chloride [26] and from Groundwater Availability Models (GAMs). Groundwater (GW) supplies from aquifer storage were estimated from GAMs, using water-level data in unconfined aquifers and potentiometric surface data in confined aquifers, aquifer tops and bottoms, and gridded storage coefficients (supporting information, SI, section 9). Total water storage was subdivided into freshwater (FW) and brackish water (BW, total dissolved solids, TDS ≥ 1000 mg L) using water quality data from the Texas Water Development Board. Data on flowback and produced water (FP) were obtained from IHS. Information on municipal waste water (WW) was obtained from municipalities. Impacts of HF on surface water (SW) were estimated by determining which streams are perennial and could be affected by pumpage from unconfined aquifers. Impacts of HF on groundwater were based on groundwater level data from TWDB wells in the region. Net impact of HF on water resources considered use of natural gas in power generation.
Download figure:
Standard image High-resolution imagePrimary sources of HF water include surface water and groundwater from aquifer recharge, aquifer storage, and cross-formational flow from adjacent aquifers; however, the latter was neglected in this analysis. Data on water diversions from the Rio Grande for mining were obtained from the Rio Grande Water Master. Renewable groundwater supplies for HF were estimated from aquifer recharge rates using a global model (PCR GLOBWB) as used in recent studies [1, 5, 25], regional recharge rates from groundwater chloride data [26], and groundwater availability models (GAMs) [27–29]. Groundwater supplies from aquifer storage were estimated from GAMs [22, 27, 28] and include drainable storage (water that would be drained under gravity, aquifer thickness × specific yield) in aquifer outcrop zones and compressible storage (water released from compressible storage: storativity × head decline) in downdip confined sections of aquifers (figure 2, SI, section 9, figure S11).
Impacts of HF on groundwater resources were evaluated using groundwater level monitoring data from 131 wells from the Texas Water Development Board (TWDB) database. Flow duration curves and baseflow were estimated for 20 streamflow gages using the length of record to determine which streams are perennial and could be impacted by HF groundwater pumpage. Net impact of HF on water resources was examined by comparing water use for shale gas extraction with water use for cooling in natural gas power plants [30].
Alternatives to freshwater sources for HF were evaluated, including flowback/produced (FP) water (SI, section 11), brackish groundwater, and municipal waste water. FP water volumes were estimated for individual wells from 2009–2013. The ratio of FP to HF water was calculated to evaluate what percentage of HF water would be available for reuse or recycling. Brackish groundwater was estimated by integrating groundwater quality (TDS) data from TWDB with groundwater storage data from the GAMs. Availability of municipal waste water was evaluated by contacting the 20 largest municipalities in the play area. We contacted O&G operators to determine trends in HF water sourcing through the South Texas Energy and Economic Roundtable (STEER.com) and through conferences. Analyses of water demand versus supply in the Eagle Ford play were compared with water demand from literature-based estimates for the semiarid Permian Basin play in west Texas [5] and from previous analysis for the semiarid Bakken play in N Dakota and Montana [6]. Water demand in the Permian Basin was compared with water supplies from groundwater storage, including brackish water from the GAMs and discussions with operators through the Permian Basin Petroleum Association. Water demand in the Bakken was compared with reservoir storage in the Missouri River [31].
3. Results and discussion
A schematic (figure 4) shows the main components of the Eagle Ford play area, including the Eagle Ford Shale unit at depth, a typical HF well (∼2 miles deep and 1 mile lateral), an injection well for disposal of FP water, a shallow dipping confined aquifer typical of the Gulf Coast aquifers, and various sources of water, including recharge in the aquifer outcrop and fresh and brackish groundwater storage. HF water demand was compared with water supplies based on production to date (2009–2013) and projected production throughout the play life (∼20 yr) at the play level, county level, and where feasible at the one square mile grid level to assess water scarcity.
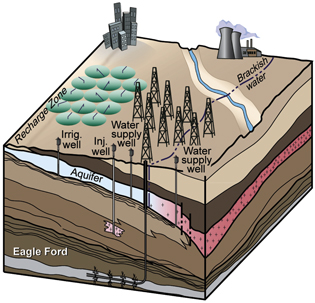
Figure 4. Schematic of Eagle Ford play area. Only one aquifer is shown for clarity and includes an up-dip recharge zone where the aquifer outcrops and downdip confined section including brackish water shown in red. A representative hydraulically fractured well is shown with mean depth of ∼2 miles (3.2 km) and mean lateral length of ∼1 mi (1.6 km). A nearby injection well is shown where flowback-produced water can be disposed. The various water sources are schematized to include groundwater recharge and storage (freshwater and brackish water), reused or recycled FP water from HF wells, municipal waste water, surface water (e.g. Rio Grande), and transfer from the irrigation sector. Irrigation is mostly up-gradient from the Eagle Ford HF and is represented by center pivot irrigation circles representative of the Winter Garden irrigation region. A power generation station is included to represent net impacts of natural gas on water resources including water cooling through power generation and water creation from natural gas combustion.
Download figure:
Standard image High-resolution image3.1. How does water demand for hydraulic fracturing compare with that for other sectors?
Water demand or use for HF in the Eagle Ford in 2013 (17.8 bgal, 67 bL) is assumed to be mostly consumptive because of limited recycling as discussed later. At the state level, HF water demand in the Eagle Ford in 2013 represents 0.3% of statewide water withdrawal (5200 bgal, 20 000 bL, 2012) and 0.5% of statewide water consumption (3900 bgal, 15 000 bL, 2012), assuming 85% of irrigation and 40% of municipal water use is consumptive [32]. The latest year with reported state water use data is 2012. At the play level, HF water consumption represents 4–9% of water withdrawal in 2011 and 2012 and 5–11% of water consumption (figure 5, table S2). However, using 2013 HF water use with 2012 water use data results in HF representing 13% of water withdrawal and 16% of water consumption. The dominant water user in the play is irrigation, accounting for 62–65% of water consumption (2011–2012), followed by municipal (10–12%), and steam electric power (7–13%) (figure 5).
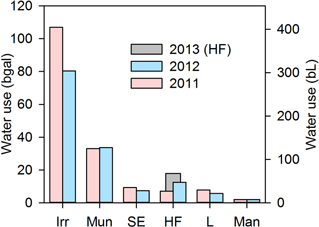
Figure 5. HF water use for 2011–2013 relative to total water use by other sectors in the Eagle Ford play area for 2011 and 2012 (most recent years with complete data) (table S1). Total non-HF water use was 168 bgal (636 bL) for 2011 related to dry conditions associated with most extreme drought on record and 129 bgal (490 bL) for 2012, related to normal conditions. HF water use during the period was 7.0 bgal (36 bL; 2011), 12.5 bgal (47 bL, 2012), and 17.8 bgal (67 bL, 2013).
Download figure:
Standard image High-resolution image3.2. What is the projected water demand for hydraulic fracturing?
Total HF drilling during the remaining life of the play (∼20 years) was estimated based on the current highest established well density (HEWD) to be 50 700–70 400 wells, resulting in ∼42 000–62 000 wells remaining after subtracting the 8300 wells drilled to date [6] (table S3; figure S6), bounding the previous estimate of 50 000 wells [8]. Multiplying 2013 drilling (3512 wells) by 20 and subtracting 8300 would result in a similar estimate (62 000 wells). These projections would result in ∼223–333 bgal (844–1260 bL) of additional HF water based on average 2013 HF water use/well in each production zone (oil, volatile oil, condensate, and dry gas) (table S3), representing ∼6–8 times HF water use to date (∼40 bgal, 150 bL, 2009–2013) [6]. To assess water constraints for HF, we used the upper bound for HF water demand (∼330 bgal, 1250 bL) as a conservative estimate (table 1).
Table 1. Summary of past and projected HF water demand and future HF water supply sources in the Eagle Ford play region.
| HF demand and storage | ||||
|---|---|---|---|---|
| Category | bgal | bL | Demand % of source | |
| HF Water demand | ||||
| 2009–2013 | 40 | 150 | — | |
| 20-Year projection | 330 | 1250 | — | |
| HF Water sources | ||||
| Fresh storage | Unconfined | 6000 | 22 700 | 5 |
| Confined | 3800 | 14 400 | 8 | |
| Brackish storage | Unconfined | 34 800 | 132 000 | 1 |
| Confined | 45 600 | 173 000 | 1 | |
| Othera | Recharge | 1200 | 4540 | 26 |
| MWW | 36 | 136 | 860 | |
aAnnual values (recharge: 60 bgal yr−1, municipal waste water (MWW) 1.8 bgal yr−1) multiplied by 20 yrs.
3.3. How does water demand for hydraulic fraction compare to freshwater supplies?
The dominant HF water supplies in the Eagle Ford play include aquifer recharge and freshwater storage (table 1). The focus on freshwater derives in part from reports that many landowners stipulate use of their fresh groundwater as part of lease agreements to generate an additional revenue stream to land owners and the sole revenue stream to landowners with severed mineral rights. Long-term (1960–2000) mean recharge rates from simulated drainage below the root zone in the PCR-GLOBWB model totaled 49 bgal yr−1 (185 bL yr−1) for the Eagle Ford play area (table S5), ∼170% greater than HF water demand in 2013 (18 bgal, 68 bL) but 65–72% less than total water withdrawal in the play area in 2011 (175 bgal, 662 bL) and 2012 (142 bgal, 538 bL) (table S3). Regional recharge rates from groundwater chloride data in the Carrizo–Wilcox aquifer totaled 43 bgal yr−1 (163 bL yr−1) [26]. Sources of recharge include diffuse recharge from percolation below the root zone and focused recharge beneath losing streams (e.g. Leona, Nueces, and Frio rivers) [33, 34]. Simulated recharge in regional GAMs in outcrop areas in the play totaled ∼60 bgal yr−1 (227 bL yr−1; table S5). All of these recharge estimates refer to aquifer outcrop zones; however, most O&G water supply wells in the western part of the play are in the deeper confined parts of the aquifers (1000–7000 ft deep, 300–2000 m) (figure S5). Net flow to the downdip confined aquifer was estimated to be ∼34% of the outcrop recharge for the Carrizo–Wilcox aquifer, the dominant aquifer in the west, based on the GAM [26]. Applying the percentage of deep recharge in the Carrizo aquifer (34%) to other confined aquifers in the play as an estimate results in net recharge of ∼20 bgal yr−1 (76 bL yr−1), which is similar to HF water use in 2013 (17.8 bgal) but is ∼86–89% less than total water withdrawal in 2011 and 2012 in the play area. Therefore, relying on recharge alone for HF is inadequate because recharge is not uniformly distributed in the play (figure S10) and most of the HF water supply wells are in the deep confined aquifers with very low recharge rates.
The largest water source for HF is groundwater storage in the play area. A previous study of water sources for irrigation pumpage in the confined portion of the Carrizo–Wilcox aquifer indicates that ∼60% of the pumped water was derived from aquifer storage, which is not sustainable and has resulted in groundwater depletion [21]. Freshwater extends far downdip in the Carrizo aquifer in the western part of the play, reflecting high permeability sands but is much more limited in the east [35] (figures 2(b), (c), S9). Drainable freshwater storage in the unconfined portions of the aquifers, estimated from integration of TDS data (figures S19–S23) with storage from the GAMs, totaled ∼6000 bgal (22 700 bL, tables 1 and S6); however, most HF water supply wells are completed in the confined portions of the aquifers, with compressible freshwater storage of ∼3800 bgal (14 400 bL) in the play area (table S6). Projected total HF water demand (330 bgal, 1200 bL) represents ∼3% of freshwater storage (9800 bgal, 37 000 bL) at the play level (table S4). The projected 20 yr water demand from all sectors (∼1400 bgal based on average 2000–2012 withdrawals) is mostly irrigation (62%) and municipal (12%) use, and represents ∼14% of total freshwater storage in the play (table S4). Projected HF water demand at the county level ranges from <1–27% of total freshwater storage (figure 6, table S4). Projected water withdrawal for all sectors at the county level represents 1–36% of total freshwater storage for all counties except Frio (111%) and Zavala (262%) counties which are dominated by irrigation (90–95% of county water use).
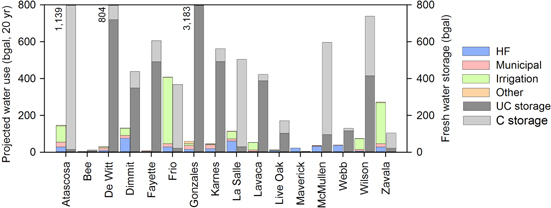
Figure 6. Comparison of estimated 20 yr water demand by sector relative to estimated total fresh water storage in the Eagle Ford play area. 'Other' category includes manufacturing, electrical power generation, and livestock sectors combined. HF demand based on highest established well density for seven production zones from this study and the remaining sector demands estimated as 20 times the respective 2000–2012 annual sector mean values (TWDB). Unconfined (UC) and confined (C) fresh water storage values based on the groundwater availability models (GAMs).
Download figure:
Standard image High-resolution imageA secondary source of water for HF is the Rio Grande for counties adjacent to the river, mostly Webb County. Diversions from the Rio Grande for mining in 2011–2013 ranged from 1.1 to 2.3 bgal yr−1 (4.2–8.8 bL yr−1; table S8). Assuming this water is available for HF, it could provide HF water for ∼230–500 wells/yr assuming an average water use of 4.8 × 10⁶ gal/well, 18.2 × 10⁶ L/well [6] (figure S12). However, there is limited drilling near the Rio Grande and operators do not normally transport water more than ∼5–10 miles.
3.4. How vulnerable is water use for hydraulic fracturing to drought?
The 2011 drought was the most extreme on record for Texas, with precipitation in the play only 42% of the long-term mean (12.3/29.3 inches, www.prism.oregonstate.edu). Droughts generally have a much greater impact on surface water than groundwater; however, reported diversions from the Rio Grande for mining for 2011 were similar to those in 2012 and 2013 (table S8). Drought should not markedly impact water demand for HF or groundwater supply, particularly for the confined aquifers which have been recharging for several thousand years [36]. The main impact of the 2011 drought was related to increased water demand for irrigation (figure 5, table S2). The increase in water withdrawal related to irrigation from 2010 to 2011 (33 bgal, 125 bL) due to the 2011 extreme drought is similar to total HF water use for 2012 and 2013 combined (30 bgal, 114 bL). However, the main irrigation region, the Winter Garden region, is mostly north of the Eagle Ford play area and generally does not compete with HF water use (figures 1 and 4).
3.5. What legal issues impact hydraulic fracturing water use?
In addition to physical availability of water, legal access to water and regulations governing water resources need to be considered. Legal challenges relate to groundwater ownership in Texas, with current law providing that landowners have a 'vested property right' to groundwater in place [37]. Therefore, regulations, including reduced permits by Groundwater Conservation Districts that would restrict landowners' access to groundwater, may constitute 'a taking' and would have to be compensated [38]. These recent rulings call into question the scope and authority of GCDs. In addition, because of confusing language in the Texas Water Code (SI, section 9), it is not clear whether groundwater produced for HF activities is exempt from GCD regulation. While groundwater use for O&G exploration in Texas is exempt from regulation, confusion results from whether to consider HF part of exploration or production.
Groundwater management by the GCDs is based on estimates of desired future conditions (DFCs) for aquifers within groundwater management areas that result from joint-planning efforts by multiple GCDs (Texas Water Code §36.108). In Groundwater Management Area 13, covering most of the Eagle Ford play (figure S4), the desired future condition is a not-to-exceed area-average drawdown of 23 ft (7 m) across the GCD by 2060. However, localized drawdown in pumping centers will likely exceed this amount. This desired future condition translates to modeled available groundwater of ∼150 bgal yr−1 (570 bL yr−1) from the GAMs to honor the drawdown limitation and planning horizon. The 2013 HF water use (18 bgal, 68 bL) corresponds to ∼12% whereas total withdrawal from all sectors (142 bgal, 538 bL) represents ∼95% of the annual modeled available groundwater in this region. These desired future conditions will be revised in 2016 and should reflect groundwater pumpage for HF in the region.
3.6. What impacts does hydraulic fracturing water use have on water resources?
Groundwater level monitoring data from 131 wells in the play area indicate that water levels have declined to a maximum depth of ∼200 ft (∼60 m) in the west and mostly ≤50 ft (15 m) in the east (figures 7, 8, and S13). Greater declines in the west may be related to the deeper O&G water supply wells completed mostly in confined aquifers relative to shallower wells in the east, many of which may be completed in unconfined aquifers (figure S5). The specific yield for most of the unconfined aquifers is ∼0.15 whereas the average storativity of the confined Carrizo–Wilcox aquifer in the west is 0.0012 (table S7). The ratio of the volumetric extent of cones of depression in confined versus unconfined aquifers is equivalent to the ratio of specific yield to storativity, about a factor of 1000 in many cases [39] (SI, section 9). A crude estimate of the impacts of HF water use to date (2009–2013) on groundwater levels in the confined Carrizo–Wilcox aquifer in the west was based on the assumption that all HF water was sourced from compressible aquifer storage within a mile of HF wells (figure 7). While water-level declines are small in much of the region, with 69% of western play area having no declines, 74% ≤ 25 ft (7.6 m) decline, and 81% ≤ 50 ft (15 m) decline, large declines (mostly 100–200 ft, 30–60 m) were found in 6% of the land area (figure 7). These estimates of water-level declines are generally consistent with the limited water-level monitoring data and coincident with high density of HF wells.
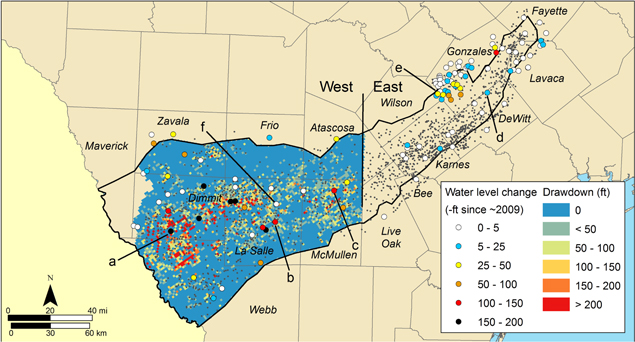
Figure 7. Monitored water level changes (large circular symbols) and estimated drawdown (1 square mile grid cells in west) in the Eagle Ford play. Monitored data are based on groundwater wells from TWDB database showing changes since 2009 when hydraulic fracturing began in the Eagle Ford play. Small gray points represent locations of oil and gas water supply wells. The gridded drawdown map in the western region represents estimated water level changes in the Carrizo–Wilcox aquifer resulting from pumping of water for hydraulic fracturing (HF) from 2009–2013. The analysis was restricted to the west because most water is derived from the Carrizo–Wilcox aquifer in this region. Water for HF is assumed to be derived entirely from compressible aquifer storage in the Carrizo–Wilcox aquifer, neglecting any water derived from recharge or cross-formational flow. Water declines >100 ft occur in 6.2% of the area, >150 ft in 3.7% of the area, and >200 ft in 2.3% of the area. There is general correspondence between the estimated water-level declines and those recorded in monitoring wells with large declines generally coinciding with areas of dense drilling to support HF.
Download figure:
Standard image High-resolution image
Figure 8. Water level hydrographs for '(a) groundwater well location 'a' and (b) groundwater well location 'f' in figure 7. Well 'a' shows long term water level declines resulting from irrigation withdrawals followed by recent rapid water level declines resulting from water withdrawal for hydraulic fracturing. Well 'f' shows slight increases in water levels during the period of record and no discernable water level impacts resulting from HF withdrawal. Analysis of water demand for HF indicates that these large water level declines are restricted to ∼6% of the play area in the west (figure 7).
Download figure:
Standard image High-resolution imageImpacts of past irrigation pumpage can be used as an extreme example of potential impacts of future HF water use in the region. Irrigation in the Winter Garden district lowered groundwater levels by up to 330 ft (100 m) regionally during the past century, decreasing water storage by ∼4000 bgal (15 000 bL) in the Carrizo–Wilcox aquifer (figure S14). Irrigation pumpage reversed groundwater discharge in much of the region and changed some rivers (Atascosa, Frio, and San Antonio rivers) from gaining to losing [21]. No land subsidence has been recorded in this region in response to groundwater depletion, most likely because the sediments are generally indurated. Projected HF water use over the 20 yr life of the play is ∼10% of groundwater depletion from past irrigation. The lack of subsidence from past depletion suggests that HF pumpage should not cause subsidence. HF pumpage may not impact rivers in the west, which are already losing, but could impact river flow in the east which are mostly perennial (figure S15, table S9).
3.7. What is the net impact of hydraulic fracturing water use considering life cycle assessment (LCA)?
Previous studies emphasize the net impact of HF water use on water resources using a LCA of gas production [16, 40, 41]. The primary market for natural gas is thermoelectric power generation, with natural gas representing ∼50% of power generation in Texas in 2012 (SI, section 10, figure S16). Most natural gas power plants in Texas have combined cycle generators (NGCC, 170 out of 215 TWh, 80%) with consumptive cooling water requirements totaling ∼32 bgal (121 bL) in 2012 (∼0.19 gal kWh−1) [30]. Power generation at NGCC plants in Texas in 2012 (170 × 1012 Wh) corresponds to 580 × 1012 Btu of energy (3.412 Btu Wh−1 of electricity) requiring 1318 × 1012 Btu of natural gas assuming 44% fuel efficiency of NGCC power plants in Texas (i.e. 44% of the energy goes to electricity with the remaining 56% to waste heat). The amount of water required to extract Eagle Ford shale gas is estimated to be 1.5 gal/106 Btu [6]. If the natural gas required to power all Texas NGCC power plants during 2012 had been produced entirely from the Eagle Ford, this would represent ∼2 bgal (7.6 bL) of water to extract the gas (1318 × 1012 Btu × 1.5 gal/106 Btu = ∼2.0 bgal of water). Therefore, water consumption for extracting the gas represents ∼6% of the cooling water consumed at the NGCC power plants (2.0 bgal/32 bgal), similar to the estimate of 6% for the Marcellus shale gas in Pennsylvania [40]. In addition, recent replacements of retiring coal steam turbine plants with NGCC plants, which have 1/3rd of the cooling water requirements, result in a net savings of water in the state [32, 42]. However, this water savings does not occur where the gas is produced in the west but where the power in generated, mostly in the central and eastern parts of the state.
Many suggest that the net impact of HF water use on water resources and the hydrologic cycle is much greater than that of other sectors, such as irrigation, because FP water in Texas is mostly disposed of in deep injection wells and removed from the hydrologic cycle (figure S5). However, in the Eagle Ford play, most of the water used for HF is not part of the active hydrologic cycle to begin with as it is mostly derived from deep confined aquifers that have been recharging for several thousand years [36]. In addition, previous studies indicate that methane combustion from natural gas in the Marcellus Shale play puts water vapor back into the hydrologic cycle (5.7 × 10⁶ gal/well, 22 × 106 L/well) that more than compensates for HF water use (3.6 mgal/well, 14 × 106 L/well) [40]. Similar calculations for the Eagle Ford indicate that water vapor from methane combustion alone based on methane production to date is equivalent to ∼90% of HF water use in the play (SI, section 10), ignoring water vapor generated by combustion of other hydrocarbons produced in the play.
3.8. What strategies can O&G operators adopt to increase resilience of hydraulic fracturing to water constraints?
Operators are considering various approaches to reduce vulnerability of HF to water constraints and reduce impacts of HF on water resources. The basic approaches include reducing water demand, increasing water supplies (particularly non-freshwater supplies), and intersectoral transfers (primarily from irrigation to HF). Water demand can be reduced by changing HF fluid types as shown by a recent analysis indicating ∼55–110% higher water demands associated with slickwater HF relative to cross-link gel HF; however, these changes in HF fluid types generally occurred in the early stages of Eagle Ford play development [6]. Water demand can also be reduced through reuse-recycling of FP water. Non-freshwater sources include brackish water and municipal waste water.
3.8.1. Flowback/produced water.
Small FP water volumes generally do not support reuse/recycling requirements. FP/HF ratios are generally <5% within the first month of well completion in all production zones, making it difficult to collect sufficient water to support recycling for HF (figures 9, S18). Most FP water is disposed of in the ∼700 active UIC Class II injection wells in the 18 county area, including and extending beyond the 16 counties in the Eagle Ford play (figure S5). The quality of the FP water is not highly saline, with reported values of ∼40 000 mg L−1 TDS. Some operators are doing a limited amount of recycling; however, there is no formal reporting of these volumes. Portable treatment units are used to treat the FP water, particularly for reducing boron levels, which must be managed for the cross-link gel HF fluid additives. The logistics of recycling is complicated because of the low FP volumes. The economics of recycling is also generally not favorable with relatively low injection well disposal costs.

Figure 9. Monthly (solid lines) and cumulative (dashed lines) median FP to HF ratio in the east and west regions of the Black Oil production zone.
Download figure:
Standard image High-resolution imageTo promote reuse/recycling of FP water the Texas Railroad Commission modified their rules in March 2013. The new rules allow operators to recycle FP fluids on their own leases or they can transfer those fluids for recycling to another operator without the need for a permit [43]. Some operators report that these new rules promote increased reuse/recycling of water.
3.8.2. Brackish groundwater resources
There is an estimated ∼35 000 bgal (130 000 bL) of brackish water in unconfined sections of aquifers and ∼45 000 bgal (170 000 bL) of compressible brackish groundwater storage in the confined sections of the aquifers in the Eagle Ford play area, totaling 80 000 bgal (300 000 bL, figure 10, tables 1, S4, S10). Projected 20 yr HF water demand represents 0.4% of brackish groundwater storage, suggesting sufficient water at a play level. At the county level, projected HF water use is ≤16% of total brackish water storage (table S4). Projected total water demand by all sectors represents ∼2% of brackish water storage at the play level and ranges from 0–13% of brackish water storage, with the exception of Frio (35%) and Zavala (78%) counties where irrigation is dominant and DeWitt county (62%) where brackish water is limited.
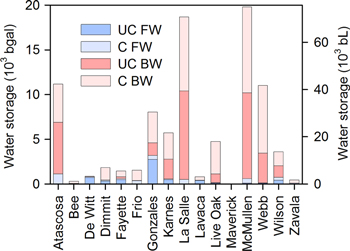
Figure 10. Estimated total fresh water (FW) and brackish water (BW) storage under unconfined (UC) and confined (C) aquifer conditions by county in the Eagle Ford play based on groundwater availability models (GAMs) and water quality data.
Download figure:
Standard image High-resolution imageA previous survey of operators in 2010 indicated that ∼20% of the HF water use throughout the play was brackish [44]; however, HF water use has expanded greatly since that time. To avoid impacting shallower domestic wells, many operators report drilling into deeper units to limit the potential for competition for shallow groundwater. Some operators indicate that 60–80% of their water use is brackish (e.g. Marathon Oil Company reported 85% of their water use in 2012 was non-freshwater, [45]); however, there is no formal reporting of this water source. Another operator reported flowing artesian production from a 6000 ft (1800 m) deep well in the eastern part of the play (Dewitt County) with TDS of ∼36 000 mg L−1. Water treatment is often required to make the water compatible with HF fluid additives. To incentivize use of brackish groundwater, the Pecan Valley GCD recently revised their regulations to allow up to 20 times more groundwater pumpage if brackish water is withdrawn from the aquifer (SI, section 9).
3.8.3. Municipal waste water
Some municipalities are selling their waste water to intermediary companies to provide water to operators (SI, section 11). For example, Laredo Utilities Department contracted 5 × 10⁶ gal d−1 (19 × 106 L) which could be used to HF 380 wells/yr (4.8 mgal/well) or could supply ∼50% of HF water in Webb county based on 2012 HF water use (table 1). However, infrastructure needs to be built to transport this water to HF sites. Most municipal waste water was previously disposed of in surface water bodies using a National Pollution Discharge Elimination System permit. The Texas state water plan projects continually increasing municipal water demand in the future; therefore, municipalities may require this waste water to meet their own future water demands.
3.8.4. Purchasing water from irrigation
Intersectoral water transfers have been proposed in semiarid regions, primarily purchasing water from the irrigation sector [13, 14]. However, the dominant irrigation region in the Eagle Ford play (Winter Garden region) is generally not collocated with the highest density of HF wells (figures 1 and 4), reducing the feasibility of intersectoral water transfers within the play. However, another study suggested that increasing irrigation efficiency in the Lower Rio Grande Valley, downstream of the Eagle Ford play, could provide ∼250–500 bgal water/yr for HF, though infrastructure development would be required to transport the water to HF sites [46].
3.9. Overall water supply versus demand and related uncertainties for the Eagle Ford Play
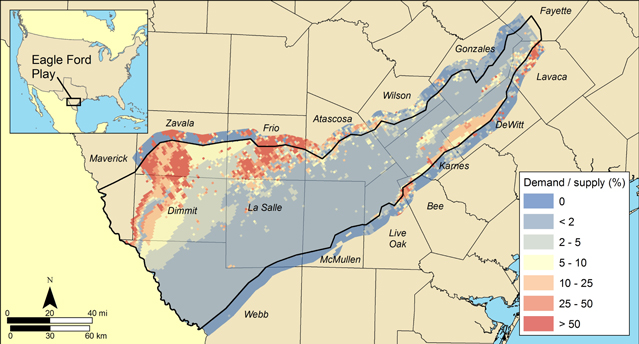
The previous discussions of water demand versus supply focused on fresh and brackish water separately. However, projected HF water demand is a small percentage of total water resources at both the play (0.4%) and the county (0.1–6%) levels. Projected total water demand for all sectors (HF, irrigation, municipal and other) is also a small percentage of total available water at the play level (1.6%) as well as at the county level for most counties (0.2–7%), excluding two counties with high irrigation demands (Frio: 27%, Zavala: 60%), and one county (Maverick) that has essentially no modeled available groundwater resources in the play (table S4). Mapping the relationship between demand and supply indicates that there should not be problems with available water throughout much of the play, with the highest demands relative to supplies focused where irrigation demand is currently high in the northwest (figure 11).
Figure 11. Distribution of the projected total 20 yr water demand for the HF, irrigation, and municipal sectors expressed as a percentage of available total groundwater storage per square mile, including freshwater and brackish water. HF demand assumes that the Eagle Ford play matures to the current seven-zone highest established well density in each production zone (figure S7) and that irrigation and municipal demands equal the average annual sector demands for the period 2000–2012 multiplied by 20 yr (projected life of the play) (figure S8). Note this depiction does not account for distribution or transport of water demand or supply across cell boundaries and assumes the current land use footprint remains static. Higher percentage of demand versus supply areas located along the southeastern play boundary in Lavaca, DeWitt, Karnes, and Bee counties reflect the Carrizo–Wilcox, Queen City-Sparta, and Yegua-Jackson GAM model limitations in regions with high groundwater TDS.
Download figure:
Standard image High-resolution image
Uncertainties in water demand to date (2009–2013) are considered relatively low because of the reporting requirements and availability of multiple databases [6]. The analysis of water demand in the Eagle Ford play is hindered by lack of reporting requirements for the source of water used for HF (e.g. surface water, groundwater, recycled FP water) or the quality of the water used (fresh versus brackish). Uncertainties in projected HF water demands are considered high because they are based on the assumption that the HEWD to date will apply to entire O&G production zones. A much more granular analysis based on square mile productivity and considering production economics, such as that available for the Barnett play [7], is required to improve estimates of projected HF water demand. This level of analysis is currently being conducted for a project funded by the Sloan Foundation [47]. Uncertainties in water demand for other sectors also need to be considered and are considered high for irrigation. Current studies funded by TWDB are evaluating remote sensing approaches to improve these estimates [48].
Data on water supplies in the Eagle Ford rely heavily on GAMs for the region. These models were designed to assess mostly freshwater resources in aquifers; however, the Bigford and Laredo Fms. which are stratigraphically equivalent to the Queen City and Sparta, respectively, west of the Frio River are not considered aquifers and recharge and storage estimates are considered less reliable west of the Frio River. The emphasis of these models is on fresh water and estimates of brackish water are not as reliable because of limited data availability. Future models should be developed that focus on brackish water resources and integrate data being collected by industry in these regions. A recent analysis of geophysical logs in the Eagle Ford play supports the estimated volumes of brackish water in these regions [49] (figure S24). While comparisons of water demand versus supply in this study have been limited, future modeling would provide more comprehensive comparisons that would include all the water sources, including groundwater from recharge and fresh and brackish water storage, and leakage from adjacent geologic units. More detailed models may be required for assessing water demand versus supply at the level of municipalities. The impact of pressure loss in confined aquifers on well yields is not known in detail. In particular, how many water wells would be required to produce similar water volumes and would water production be economical?
While the current water level monitoring network has been invaluable in documenting impacts of water use in the play on groundwater depletion, this network should be expanded and should be designed to provide detailed information in critical areas, such as those in the vicinity of municipal well fields.
4. Comparison with shale plays in other semiarid regions
The semiarid Permian Basin in west Texas includes conventional and unconventional production, with HF water use totaling 10.4 bgal (39 bL) from 9308 wells for 2.5 years (2011–mid-2013) [5]. Water use for conventional production has shifted from predominantly fresh (85%) in 1995 to brackish and produced water (80%) in 2010 based on a survey of operators in 2010 [44]. HF water use may follow a similar trend, with many current lease agreements stipulating freshwater use to provide revenue streams to landowners. Some use the term 'water play' to refer to the water markets in this region. A reconnaissance analysis from GAMs indicates large volumes of brackish groundwater resources in the underlying aquifers (figure S25), totaling an estimated 360 bgal (1360 bL) in compressible storage (table S11) [50]. Uncertainties in the location and accessibility of these brackish resources should decrease with increased exploration and production. Collocated unconventional and conventional energy production means that the large volume of produced water with conventional oil production (volumetric produced water to oil ratio of ∼8 from 2009–2012, table S12, similar to that in the USA [51]), may provide additional water for HF in the region, if it is not used for water flooding for conventional oil production. Presentations in a recent symposium sponsored by the Railroad Commission of Texas on reuse/recycling of water indicated increasing trends in some companies to use brackish and FP water and discontinue use of freshwater [52] (SI, section 12).
The Bakken play is the second largest shale oil producer in the USA with HF water use of 16 bgal (60 bL) for 7868 wells from 2005 through 2013 [6]. Low precipitation rates in the Bakken play in North Dakota and Montana (mean 14.6 inches/yr (370 mm yr−1), 1981–2010, PRISM precipitation, figure S26) might suggest that HF production could be vulnerable to water constraints. However, the Missouri River provides a major source of water in the region, with the Sakakawea Reservoir (7800 bgal (30 000 bL) storage capacity, figure S27) located in the middle of the Bakken play, though regulatory issues currently limit access to this water source, which is controlled by the USA Army Corps of Engineers. Additional water is provided by groundwater with water depots in different regions of the play. In addition, low population density and limited irrigation, particularly in the North Dakota region of the play, reduces water stress in the region (table S13).
5. Conclusions
- (1)Water demand for HF in the Eagle Ford (18 bgal in 2013) represents 16% of consumptive water use in the play area. Maximum projected HF water use over the next 20 yr is 330 bgal from 62 000 additional wells, representing ∼8 times HF water use to date. Projected HF water use represents ∼10% of historic groundwater depletion resulting from irrigation in the adjacent Winter Garden region over the last century.
- (2)Water supplies for HF include groundwater recharge, estimated to be ∼60 bgal yr−1 in the aquifer outcrop area and ∼20 bgal yr−1 in the deep confined aquifers.
- (3)Additional water supplies are provided by fresh groundwater storage, with projected HF water use (330 bgal) representing ∼3% of groundwater storage in the play.
- (4)While regional impacts of water pumpage to support HF are small, localized impacts can be large with estimated water level declines of ∼100–200 ft in ∼6% of the western play area.
- (5)The net impact of HF water use based on life cycle of natural gas is low, with HF water use for gas extraction representing ∼6% of water consumed at the power plants.
- (6)Brackish groundwater may provide a viable alternative to freshwater with projected HF water use representing 0.4% of the estimated 80 000 bgal of brackish groundwater storage.
- (7)There is limited potential for reuse or recycling of flowback or produced water because of small volumes (≤5% of HF water requirements in the first month) in the Eagle Ford play.
- (8)Evaluation of HF water use in the semiarid Permian Basin play in Texas indicates increasing use of brackish groundwater and recycling of produced water, which benefits from large volumes of produced water from collocated conventional oil production (volumetric water: oil ratio of ∼8). In the Bakken play in N Dakota and Montana, water inputs from outside this dry basin through the Missouri River provide a large potential resource for HF, although currently limited because by regulatory restrictions.
- (9)The comprehensive analysis of Eagle Ford water issues and comparison with other semiarid plays indicates that, with proper management, water should not constrain HF in these semiarid regions.
Acknowledgments
We would like to acknowledge the Jackson School of Geosciences, the Shell University of Texas Unconventional Research (SUTUR) program, BP, and the Mitchell Foundation for funding this study. We would also like to acknowledge free access to the Enerdeq database provided by IHS. We are very grateful to Dr Yun Huang for input to model parameters for the southern Carrizo–Wilcox aquifer. We appreciate communications with various O&G operators in the Eagle Ford play and discussions with members of the South Texas Energy and Economics Roundtable. We appreciate input on groundwater modeling from Shirley Wade and groundwater monitoring from Janie Hopkins, both at TWDB. We are grateful for reviews by Walt Ayers (Texas A&M Univ.), Jim Bradbury (James D Bradbury PLLC), Ron Green (Southwest Research Institute), Robert Mace (TWDB), William Mullican (Mullican & Associates), and two anonymous reviewers.