
Abstract
Assessing potential climate effects of natural gas versus coal electricity generation is complicated by the large number of factors reported in life cycle assessment studies, compounded by the large number of proposed climate metrics. Thus, there is a need to identify the key factors affecting the climate effects of natural gas versus coal electricity production, and to present these climate effects in as clear and transparent a way as possible. Here, we identify power plant efficiencies and methane leakage rates as the factors that explain most of the variance in greenhouse gas emissions by natural gas and coal power plants. Thus, we focus on the role of these factors in determining the relative merits of natural gas versus coal power plants. We develop a simple model estimating CO2 and CH4 emissions from natural gas and coal power plants, and resulting temperature change. Simple underlying physical changes can be obscured by abstract evaluation metrics, thus we focus our analysis on the time evolution of global mean temperature. We find that, during the period of plant operation, if there is substantial methane leakage, natural gas plants can produce greater near-term warming than coal plants with the same power output. However, if methane leakage rates are low and power plant efficiency is high, natural gas plants can produce some reduction in near-term warming. In the long term, natural gas power plants produce less warming than would occur with coal power plants. However, without carbon capture and storage natural gas power plants cannot achieve the deep reductions that would be required to avoid substantial contribution to additional global warming.
Export citation and abstract BibTeX RIS

Content from this work may be used under the terms of the Creative Commons Attribution 3.0 licence. Any further distribution of this work must maintain attribution to the author(s) and the title of the work, journal citation and DOI.
1. Introduction
The most severe impacts of climate change may be avoided if efforts are made to transform the global energy systems into one that does not rely so heavily on disposing of greenhouse gases (GHGs) in the atmosphere. A transition from a global system of high GHG emission electricity generation to low GHG emission electricity generation will be central to any effort to mitigate climate change (Hoffert et al 1998, 2002, Caldeira et al 2003, Myhrvold and Caldeira 2012, WeijerMars et al 2013).
Natural gas is increasingly seen as a 'bridge fuel' for transitions to renewable and/or near-zero emission energy sources (Moniz et al 2011, Paltsev et al 2011). However, recent research has led to differing conclusions about the climate implications of more energy reliance on natural gas, and the impacts of natural gas utilization on climate are being debated (Howarth et al 2011, Wigley 2011, Alvarez et al 2012, Burnham et al 2012, Grubert et al 2012, Levi 2013, Jackson et al 2014, Shearer et al 2014). Several studies have surveyed the impacts of GHG from natural gas production and utilization, focusing on different factors and leading to different conclusions (Jiang et al 2011, Karion et al 2013, Allen et al 2013, Miller et al 2013, Brandt et al 2014, Howarth 2014). On one hand, the use of natural gas emits less CO2 per unit energy than does coal. On the other hand, because the climate is far more sensitive to methane than to carbon dioxide (Shindell et al 2012), researches have been emerging that potential climate benefits of natural gas use may be offset by leaks at gas drilling fields or other earlier points in the natural gas production lifecycle (Howarth et al 2011, Wigley 2011, Burnham et al 2012, Jackson et al 2014).
Various studies use and/or advocate for different metrics to estimate the climate impact of natural gas utilization. Studies by Howarth et al (2011), Howarth (2014) compared the emissions of natural gas, coal and other fossil fuels, and suggested that both a 20-year time horizon Global Warming Potential (GWP20) and a 100-year Global Warming Potential (GWP100) should be used when analyzing the impacts of these fuels. Alvarez et al (Alvarez et al 2012) extended the Global Warming Potential (GWP) metrices by use of integrated radiative forcing (RF) to estimate methane emission from natural gas, and found that using natural gas instead of coal for power plants can immediately reduce RF and that reducing methane emission would produce greater benefits. Burnham et al (2012) developed distribution functions to estimate methane emissions with GWP20 and GWP100 for life-cycle GHG emissions. Caldeira and Myhrvold (Caldeira and Myhrvold 2012) looked at the projected time evolution of temperature change from various power plants to conclude that, compared with the most efficient coal power plants, natural gas can at best achieve modest climate benefits on the century time scale.
In this study, we develop a power plant GHG emission model and apply available life-cycle parameters to calculate associated CO2 and CH4 emissions. We then feed these emissions into a simple climate model to predict resulting time evolution of RF and global mean temperature. These results make it clear that hundreds of years after a plant ceases operation, CO2 emissions from the plant are primarily responsible for warming (indicating that on these time scales, efficiency and fuel type (natural gas versus coal) are the most important factors). Nevertheless, if natural gas leakage rates are high, CH4 emissions can be the dominant warming effect during plant operation. Thus, controlling natural gas leakage remains a critical issue. Nevertheless, in the absence of carbon capture and storage, even in the most optimistic of scenarios, the operation of natural gas plants results in large amounts of GHGs emitted to the atmosphere. In the absence of carbon capture and storage, natural gas plants cannot produce the deep reductions in emissions that would be required of energy systems that do not contribute substantially to global warming.
2. Methods
To estimate the amount of global warming that would be produced by different natural gas and coal power plants, we developed a power plant GHG emissions model, and used a schematic climate model (Myhrvold and Caldeira 2012, 2013) to investigate the RF and global mean temperature changes (ΔT). This model (see section 2.2), considers the pathway from emissions of GHGs to global mean temperature response.
2.1. Power plant emissions
The plants in this study are single natural gas power plants and single coal power plants with capacity of 1 GW. The major emission period of power plants is the operation period, construction emissions are relatively small in total life-cycle emissions, and relatively similar for the two types of plants (Pacca and Horvath 2002, Weisser 2007, Myhrvold and Caldeira 2012, Whitaker et al 2012, O'Donoughue et al 2014, Heath et al 2014), so construction emission is ignored in this study. The major emissions from electricity generated with natural gas are CO2 and CH4 (see figures 1 and SS1), although some cases considered second important emissions such as black carbon and SO2 (Spath et al 1999, Hayhoe et al 2002, Wigley 2011). In our analysis, we do not consider climate effects of these emissions because (1) while the individual contributions of black carbon and SO2 are large, the net climate effect of black carbon and SO2 emissions is small (see figure 1), (2) we assume that there is motivation to reduce these emissions for non-climate (i.e. health) reasons, and (3) they are not intrinsic to the technologies being considered and may be reduced through point source pollution controls. (See S1 in the supplementary data for more detail, available at stacks.iop.org/ERL/9/114022/mmedia.) Life-cycle analysis (LCA) parameters for all scenarios of natural gas and coal power plants are provided in table S1.

Figure 1. Attribution analysis for climate effects of (a) natural gas and (b) coal power plants, using radiative forcing (RF) as climate metric. The greenhouse gases and aerosols considered include CO2, CH4, black carbon (BC) and SO2. The emissions use the relationship of the gases and aerosols emissions noted by Hayhoe et al (2002) and Wigley (2011). At the end of operational period, the net contributions to radiative forcing are dominated by greenhouse gases (CO2 and CH4 comprise ∼100% of natural gas plant and 95.6% of coal plant radiative forcing). Individual contributions of black carbon and SO2 are large but the combined net contributions of these aerosols are small (BC and SO2 comprise ∼0.1% of natural gas plant and 4.4% of coal power plant radiative forcing). See S1 in the supplementary data, available at stacks.iop.org/ERL/9/114022/mmedia, for more detail.
Download figure:
Standard image High-resolution imageAnnual GHG emissions were calculated by simple models (see S2 for derivation and parameter values).
For natural gas power plants:
annual CO2 emission is
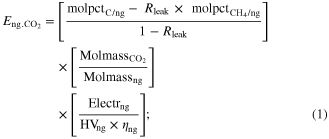
annual CH4 emission is

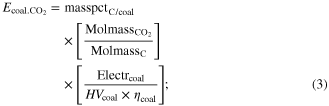
For coal power plants: annual CO2 emission is
annual CH4 emission is

where  is molar carbon per molar natural gas;
  is the mass percent of carbon in coal;
  is natural gas leakage rate;
  is the ratio of CH4 emissions to CO2 emissions from coal mining;
  is the molar fraction of methane in natural gas;
  ,
,  ,
,  and
and  are molar masses of CO2, CH4, carbon and natural gas;
  and
and  are 1 GW;
  and
and  are heating value of natural gas and coal;
  and
and  are the efficiencies of natural gas and coal power plants.
Thermal efficiency and emission rate data were taken from the National Renewable Energy Laboratory (NREL) Life Cycle Assessment Database (Whitaker et al 2012, O'Donoughue et al 2014) and recent literature (Brandt et al 2014, Howarth 2014, UNFCCC 2014). The coal power plant thermal efficiencies in this database range from 23% to 51% (Whitaker et al 2012), and the value for a world typical coal plant is 34% (WEC 2013), with 4.18‰ methane leakage (the ratio of methane emission to carbon emission from coal use). It should be noted that the 51% efficiency is reported for an experimental black coal integrated gas combined cycle (IGCC) system (May and Brennan 2003) and may exceed what is feasible for commercial operation. The natural gas power plant thermal efficiencies range from 25% to 60% (O'Donoughue et al 2014), and the value for a typical natural gas power plant is 40% (WEC 2013). The methane leakage rates (the ratio of methane emission to total natural gas use) range from 0% to 9% (Brandt et al 2014, Howarth 2014). For more details of parameter values please see S2, and relative literatures (McGurl et al 2004, EPA 2008, Whitaker et al 2012, Zhang et al 2012a, 2012b, 2013, O'Donoughue et al 2014, Brandt et al 2014, Howarth 2014)
An important aim of this paper is to identify a small handful of key factors that explain most of the difference in climate effects between natural gas and coal based power production. The model for natural gas power plant GHG emissions represented by equations (1) and (2) considers thermal efficiency and natural gas leakage rates, and explains 98.1% of the variance among natural gas power plant GHG emissions as determined by the harmonization study of O'Donoughue et al (2014) and shown in table S2. The next most important factor explaining variance in these emission rates is CO2 emission during natural gas production and transportation (see figure S1 for a version of figure 2 with gas production and transportation considered, based on Dones et al 2007). The model for coal power plant GHG emissions represented by equations (3) and (4) considers thermal efficiency and coal mine methane emissions, and explains 98.2% of the variance in coal power plant GHG emissions as determined by the harmonization study of Whitaker et al (2012) and shown in table S2. The model presented here is intended to provide a quantitative and conceptual understanding of the role of key factors affecting all natural gas and coal based electricity generation. In particular cases, such as with liquid natural gas fueled power plants, where transportation emissions could be high, other factors could prove important. In these cases, it may be important to specify the full range of parameters in equations (1) through (4).

Figure 2. Global temperature change from the (a) most efficient and (b) typical efficiency natural gas and coal power plants. The operational period is 40 years. Efficiencies of natural gas and coal power plants are 60% and 51% for the most efficient natural gas and coal power plants, respectively, (Whitaker et al 2012, O'Donoughue et al 2014); 40.3% and 34.3%, respectively, for global fleet average efficiencies (world typical plants, WEC 2013). The range of natural gas leakage rate considered is 0%–9% (Howarth 2014). Amount of warming from natural gas versus coal power plants for the first several decades depends sensitively on natural gas leakage rates and power plant efficiencies. Several decades after the plant ceases to operate, most of the methane no longer resides in the atmosphere; at that time, the relative warming from natural gas versus coal power plants depends primarily on power plant efficiency.
Download figure:
Standard image High-resolution image2.2. Climate model
2.2.1. GHG residence in the atmosphere
Emissions of GHGs were converted to concentrations of GHGs in the atmospheric environment. The amount of GHGs in the atmosphere is:

where  is annual GHG emission, 0 ≤ t ≤ tm.
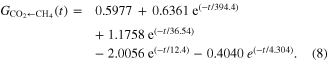
In this study, we applied Joos et al's (Joos et al 2013) parameter of CO2 impulse response function and Prather et al's (Prather et al 2012) parameters of CH4 impulse response function to estimate atmospheric GHG concentrations


2.2.2. Radiative forcing (RF)
The RF was calculated using equations provided by the Intergovernmental Panel on Climate Change (IPCC, 2013).

where

and  ,
,  are constants used to convert the mass to concentrations.
 is concentration of GHG in the atmosphere.
  and
and  are the baseline concentrations of CO2 and CH4 in the atmosphere before emissions.
  is a function about concentrations of CH4 and N2O, and here
  is zero. For more details please see SE1.3 of (Myhrvold and Caldeira 2012).
2.2.3. Temperature change
Global mean temperature changes (ΔT) were estimated from the RF by using a simple energy balance model that represents the effective heat capacity of the climate system as a one-dimensional diffusive column, as described in (Caldeira and Myhrvold 2013):


Model parameters were chosen to mimic median results from the Climate Model Intercomparison Project phase 5 (CMIP5, Caldeira and Myhrvold 2013). The climate sensitivity parameter (λ) is 1.051. The ratio of adjusted RF to the classical RF derived from the IPCC formula is 0.775. The thermal diffusivity ( ) is 4.24 × 10³ m2 s−1. For more details, see (Myhrvold and Caldeira 2012, 2013).
2.3. Scenarios
To project the amount of global warming that would be caused by the operation of different power plants, we performed simulations using the climate model described above for each natural gas plant described in O'Donoughue et al (2014) and each coal plant described in Whitaker et al (2012). These plants were assumed to operate for 40 years.
To quantify the relative importance of methane leakage rates versus variation in power plant efficiency, we analyzed four end-member scenarios for natural gas power plants (table S1). The scenarios are high GHG emission with high methane leakage rate and low thermal efficiency, low GHG emission with zero methane leakage rate and high thermal efficiency, zero methane leakage rate and low thermal efficiency, and high methane leakage rate and high thermal efficiency. To compare, there are also three scenarios for coal power plants which are low, high and typical thermal efficiencies, respectively, using a median estimate for coal-bed methane leakage as shown in table SS3. All high and low values were taken from the National Renewable Energy Laboratory (NREL) natural gas and coal LCA harmonization studies (Whitaker et al 2012, O'Donoughue et al 2014). These simulations were done for two scenarios: one in which the plants operated for a 40 year period and another in which the plants were assumed to continue operating indefinitely.
3. Results
3.1. Simulations based on full set of natural gas and coal power plant LCA studies
We used our simple climate model to project changes in atmospheric GHG concentrations, RF, and temperature change using LCA data. Results for the full set of power plants in the NREL natural gas and coal LCA studies (Whitaker et al 2012, O'Donoughue et al 2014) and recent literature (Brandt et al 2014, Howarth 2014) can be found in figures 2 and S2. In these figures, global mean temperatures increase for the first 40 years, while the power plants are in operation. The power plants are turned off at year 40. Temperatures for the coal plants and the least-warming natural gas plant remain relatively constant even after emissions cease. Temperatures decrease over a period of decades after the cessation of the natural gas power plants that produce the most warming. This is a result of the chemical breakdown of methane in the atmosphere and ultimately the radiation of energy to space. The part of warming that is caused by CO2 releases from the natural gas power plant persists far longer, as is the case with CO2 emissions from coal power plants. However, the range of temperature increases for natural gas plants span the range of increases for coal plants for most of the century.
To quantify the extent to which variation in methane leakage rates versus variation in power plant efficiency explained the range of results seen in figures 2 and S2, we show the highest efficiency gas plant with the highest methane leakage (9%) and the lowest efficiency gas plant with no methane leakage (figure S3). The most efficient natural gas plant (60%) even with the highest leakage rate (9%) produced less warming than the coal plant at the end of the century. However, if integrated measures are used that take into consideration average changes over a century, the most efficient coal plants would be considered better than the most efficient natural gas plant with such high upstream leakage rates (figure S3(b)).
3.2. Importance of methane leakage and plant efficiency
To examine the climate consequences of different methane leakage rates, we performed a series of simulations (figures 2, 3 and S4) using methane leakage rates in the range of 0%–9% (Brandt et al 2014, Howarth 2014) using both world typical (WEC 2013) and best (Whitaker et al 2012, O'Donoughue et al 2014) natural gas power plant efficiencies. (See figure S5 for United States typical and best natural gas power plants.) For the 40-year period of plant operation, in the case of the most efficient (60%) power plant, a 2% leakage rate maintains approximate warming parity with the most efficient (51%) coal plant (figure 2(a)). However, during this 40-year operational period, the most efficient gas plant maintains approximate parity with a typical efficient (34.3%) coal plant with methane leakage rates of 5 or 6%. By the end of the century, 60 years after the cessation of power generation, warming from the coal plants considerably exceed the amount of warming from natural gas plants, even with 9% methane leakage. By the end of the century, the most efficient natural gas plant is producing 6.3%–35.0% less warming than the most efficient coal plant, and 40.0%–58.4% less warming than the typical coal plant, depending on the methane leakage rate in the 0%–9% range. For the several centuries period of plant operation, at the end of 1000 years, the most efficient natural gas power plant is producing 12.5%–31.3% less warming than the most efficient coal plant, and 41.7%–54.2% less warming than the typical coal plant, depending on the methane leakage rate in the 0%–9% range.

Figure 3. Global temperature change from continuous operation of the (a) most efficient and (b) typical efficiency natural gas and coal power plants. Efficiencies of natural gas and coal power plants are 60% and 51% for the most efficient plants; 40.3% and 34.3% for global fleet average efficiencies (world typical plants). Range of natural gas leakage rates is from 0% to 9%. Within this range of leakage, after several centuries, the best natural gas plants produce less warming than coal plants. In the long term, power plant efficiency (and whether the plant is burning natural gas or coal) is more important than the rate of methane leakage.
Download figure:
Standard image High-resolution image
The importance of methane leakage rate relative to power-plant efficiency diminishes when longer time horizons are considered. To illustrate fundamental physical characteristics of GHGs and the climate system, we simulated 1000 years of continuous operation (figure 3), using the same power plants as in figure 2, to show that the relative importance of methane leakage rate relative to efficiency diminishes when longer time horizons are considered. It should not be seen as a realistic projection of future resource use. At year 100, the most efficient natural gas plant warms from 32% less than to 41% more than the most efficient coal plant, depending on methane leakage in the 0%–9% range. By year 1000, the most efficient natural gas plant avoids from 12.5% to 31.3% of the warming that would be produced by the most efficient coal plant. Again, we note that the results reported for the most efficient coal plant used here are an experimental plant. No plant in commercial operation has attained such efficiencies.
4. Discussion
The results presented above show that whether natural gas plants are better than coal plants cannot be answered in the general case. In terms of direct climate effects, the question can be answered with reference to a particular natural gas plant with a particular upstream methane leakage rate when compared with a particular coal plant using a specified metric evaluated over a specified time interval. In the following discussion, we use 'better' and 'worse' to describe whether one power plant would produce less or more, respectively, of a temperature change than another power plant.
We recognize that climate effects would be only part of a more comprehensive power plant evaluation. Natural gas plants differ from coal plants not only in their direct climate consequences, but also in other important ways. For example, natural gas plants can provide reserve services to the power grid, while coal plants can do this to a much lesser degree (Armaroli and Balzani 2011). Therefore, natural gas plants might facilitate near-term integration of larger percentage of renewables, assuming policy drivers for deployment of renewables were in place (Richardson 2013). Further, natural gas can offer significant benefits over coal plants in terms of air quality (Han et al 2009, Zhan et al 2009, Zhang et al 2009, de Gouw et al 2014). Evaluating the relative benefits of these characteristics of gas and coal plants is beyond the scope of our study. Nevertheless, with respect to climate benefits of natural gas versus coal power plants, some general results have emerged from our study.
In this study, we assessed and discussed key factors affecting the evaluation of the climate consequences of natural gas versus coal electricity generation. The key factors affecting the climate consequences of natural gas plants with the same power output are the efficiency of the gas plant and the leakage of methane associated with natural gas supply. The key factor affecting climate consequences of coal plants (assuming appropriate scrubbing of SO2 and black carbon) is the power plant efficiency. Other factors such as leakage of methane from coal beds could also potentially be important in some circumstances. Thus, the evaluation from a climate perspective of the relative merits of a natural gas plant and a coal plant largely depend on these power plant efficiencies and methane leakage. In general, because natural gas produces more thermal energy per unit carbon and natural gas plants can be more efficient than coal plants, natural gas power plants produce less warming than coal plants in the long term (figure 3). However, because methane is a potent but relatively short-lived GHG, if there is substantial methane leakage associated with natural gas supply, then natural gas plants can produce more warming than a comparable coal plant during the period of operation.
Whether a natural gas plant with a certain methane leakage rate and efficiency is better or worse than a coal plant, depends not only on the metric being considered but also on the characteristics of the reference coal plant. Natural gas power plants need lower methane leakage rates or higher efficiencies to perform better than higher efficiency coal plants (figures 2, S4 and S5). Some of the apparent disagreement among studies was due to the fact that different studies assumed different reference coal power plants (Howarth et al 2011, Myhrvold and Caldeira 2012, Howarth 2014).
Different reference power plants are relevant to different situations. For example, if someone were considering building a new power plant today, they could decide between building a high efficiency natural gas plant (60% efficiency) versus a high efficiency coal plant (51% efficiency) (figure 2(a)). In this case, if the methane leakage rate is above about 2%, then the natural gas plant will produce more warming in the first decades than will the coal plant. It should be noted that power plants with 51% efficiency are not commercially available today (May and Brennan 2003), but this could represent an upper bound efficiency for some future commercial coal plant. However, for plants with a 40-year operation time, the natural gas plant will produce less warming at 100 years, even with a 9% methane leakage rate. If someone were considering whether to replace a typical coal plant (34.3% efficiency) with the best natural gas plant (60% efficiency), the natural gas plant would cause less climate change throughout even with a 4% or 5% methane leakage rate.
Furthermore, if someone were faced with the alternative of shutting down a typical gas plant versus a typical coal plant, there would be climate benefit to shutting down the gas plant in the near term if methane leakage was below about 2%; however, there would be long-term climate benefit even if methane leakage rates were substantially greater (figures 2(b) and S5(c)).
5. Conclusions
This study has focused on comparison of natural gas power plants versus coal power plants and has emphasized the climate effects of electricity generation, specifying conditions when one type of plant becomes better than another. However, it is important to note that in many cases when a natural gas plant is deemed 'better' than a reference coal plant, it is only somewhat better than the reference coal plant (figures 2 and 3). For example, the best natural gas plant with a zero methane leakage rate still produces about two-thirds of the century-integrated warming as does the best coal power plant (figure 2(a)). High-efficiency natural gas plants with low methane leakage rates can, in principle, produce half the century-integrated warming as today's typical coal plant. Thus, there is potential climate benefit in replacing low-efficiency coal plants with high-efficiency, low-methane leakage natural gas plants.
However, many well-publicized GHG emission targets require much deeper cuts in emissions than can be provided by natural gas. For example, California's AB32 regulation calls for 80% reductions in emissions below 1990 levels by mid-century (CARB 2007). Many power plants built today could still be operational in mid-century; this raises the question of the extent to which natural gas can help in achieving these policy objectives. If natural gas is to play a long-term role in electricity production in a world with greatly constrained carbon emissions, then carbon capture and storage may be an essential component of future natural gas systems (Davidson et al 2005).
Natural gas is thought of as a 'bridge' fuel by some policy makers—a temporary fuel to be used until a transition to near-zero emission technologies becomes more feasible (Moniz et al 2011, Paltsev et al 2011, BP 2014). Thus, natural gas is promoted as a way to decrease near-term emissions as we make a transition to energy systems that deeply cut long-term emissions. However, if methane leakage rates cannot be maintained at very low values, near-term climate benefits may be small or non-existent. There is potential that, relative to coal, the deployment of natural gas power plants could both produce excess near-term warming (if methane leakage rates are high) and produce excess long-term warming (if the deployment of natural gas plants today delays the transition to near-zero emission technologies. Thus, achieving climate benefits from the use of natural gas depends on building high-efficiency natural gas plants, controlling methane leakage, and on developing a policy environment that assures a transition to future lower-emission technologies.
Acknowledgements
We thank Ms Dawn Ross (Carnegie Institution for Science) and Dr Dan Freeman (Intellectual Ventures) for help in preparing this document. We thank the anonymous referees for their constructive comments.