
Abstract
Global land acquisitions, often dubbed 'land grabbing' are increasingly becoming drivers of land change. We use the tools of network science to describe the connectivity of the global acquisition system. We find that 126 countries participate in this form of global land trade. Importers are concentrated in the Global North, the emerging economies of Asia, and the Middle East, while exporters are confined to the Global South and Eastern Europe. A small handful of countries account for the majority of land acquisitions (particularly China, the UK, and the US), the cumulative distribution of which is best described by a power law. We also find that countries with many land trading partners play a disproportionately central role in providing connectivity across the network with the shortest trading path between any two countries traversing either China, the US, or the UK over a third of the time. The land acquisition network is characterized by very few trading cliques and therefore characterized by a low degree of preferential trading or regionalization. We also show that countries with many export partners trade land with countries with few import partners, and vice versa, meaning that less developed countries have a large array of export partnerships with developed countries, but very few import partnerships (dissassortative relationship). Finally, we find that the structure of the network is potentially prone to propagating crises (e.g., if importing countries become dependent on crops exported from their land trading partners). This network analysis approach can be used to quantitatively analyze and understand telecoupled systems as well as to anticipate and diagnose the potential effects of telecoupling.
Export citation and abstract BibTeX RIS

Content from this work may be used under the terms of the Creative Commons Attribution 3.0 licence. Any further distribution of this work must maintain attribution to the author(s) and the title of the work, journal citation and DOI.
1. Introduction
The issue of large-scale, trans-national land acquisitions (sometimes called 'land grabbing') has rocketed towards the top of the sustainability agenda in recent years. These deals involve public and private sector actors, including governments and agribusinesses, leasing or purchasing large tracts of land, mainly in developing countries in the Global South, for the production of goods of their choosing. Recent events that have triggered the rush for land include the rising cost of oil and the 2008 spike in food prices (Anseeuw et al 2012). These deals are controversial because they raise concerns about neo-colonialism, land tenure rights, and sustainable livelihoods for local communities in land-exporting countries (e.g., Anseeuw et al 2012). Meanwhile, others see such investments as opportunities for agricultural development and greater self-sufficiency in the Global South (Deininger et al 2011). Large-scale land acquisitions are rapidly evolving, and have the potential to quickly become a major driver of land change (Lazarus 2014). Indeed, there is mounting uneasiness that competition for food, energy and water, coupled with population increase, will result in a land 'bottleneck' (Lambin and Meyfroidt 2011).
Recent work has used analyses of international trade to allocate consumer responsibility for environmental impacts of goods produced internationally, including biodiversity loss (Lenzen et al 2012), CO2 emissions (Davis and Caldeira 2010), and virtual water use (Hoekstra and Mekonnen 2012). This work focuses on how traded commodities, such as livestock, crops, and manufactured goods, result in global reallocation of the natural resources (e.g., land and water) used to produce them, often calling this 'virtual' trade to refer to the resources embedded in the production of the traded goods. Previous work has also analyzed the land embodied in goods produced for trade, finding for example that this 'land use displacement' where high-income countries acquire goods produced in low-income countries accounts for 6% of global land use (Weinzettel et al 2013). International trade of commodities (and of the land embedded in them) contribute to increasing environmental footprints associated with unsustainable production and consumption of goods globally (e.g., Hoekstra and Wiedmann 2014).
Global land acquisitions represent a new case within the domain of virtual land trade, where it is not only the yields or goods produced from land that is traded, but the ownership of the land itself. A recent analysis showed that substantial volumes of land have been traded through international land deals, totaling between 32.7 and 82.2 million hectares as of 2012. This corresponds to 0.75–1.75 of the Earth's agricultural land (Rulli et al 2013).
Land systems are increasingly globalized (Seto et al 2012, Yang et al 2013) and telecoupled, meaning human and natural systems are linked through socioeconomic and environmental interactions over large distances (Liu et al 2013). Research priorities for telecoupled systems identified by Liu et al (2013) include adopting network approaches to analyze connections between multiple locations while increasing understanding of cross-system integration. Accomplishing this would help in generating new insights for evaluating changes in telecoupled systems. From this perspective, the global land acquisition system is inherently a telecoupled system that can be represented as a network, but it has yet to be studied as such (Liu et al 2013).
Recently, applying the tools of network science to large empirical datasets has enabled major strides in understanding in areas as diverse as brain function (Telesford et al 2011), international finance patterns (Vitali et al 2011), ecosystems (Proulx et al 2005), human migration (Davis et al 2013), and water trading (Konar et al 2011). Topology is a network science term that refers to the connectivity between nodes in a network (Heywood et al 2002), and in the context of this study describes how countries (nodes) are coupled to one another through land acquisitions (links). Note that topology refers to the patterns of connectivity only, and not the amount or use of land involved or the products derived from the land. The strength of this methodology lies in its ability to quickly analyze the relations between interacting components in a complex system in order to tease out structures that could yield insight into system functioning (e.g. Albert and Barabási 2002, Newman et al 2006).
In this article, we describe and analyze the structure of the global land acquisition system by representing it as network. Our first objective is to characterize the position of different countries in the topology of the land acquisition network in terms of: (a) the number of land trade partners associated with a country, and (b) the role that a country plays in connecting other countries to the network in a continuous chain, thereby contributing to global network integration. Our second objective is to identify the presence of land trading submarkets (relatively closed communities) embedded within the global land trade network. Our third objective is to discover whether countries tend to trade land with other countries with similar numbers of trading partners, or with dissimilar numbers of trading partners (which we term trade orientation). The latter would indicate an asymmetric trade system characterized by a small number of important global players that provide trade connections for a large number of peripheral countries. Finally, we briefly highlight the implications of our findings for vulnerabilities of the global land trade system in light of environmental or geopolitical stressors.
2. Data and methods
2.1. Land transactions data
In order to create the networks, we used two databases with collections of large-scale (>200 ha) land deals, retrieved October 2012: GRAIN (2012) and Land Matrix (Landportal.info 2012). At that time, the GRAIN database had 416 deals that were all trans-national, with a focus on food crops. The Land Matrix database contained 1006 deals, with a greater emphasis on flexible and fuel crops. Approximately 300 of these deals were internal, meaning that at least one of up to several investors were from the same country where the investment takes place.
To merge the GRAIN and Land Matrix deals into one database, we standardized country and crop labels following the FAO's country and crop naming conventions where available, including all trading partners in the case of deals with multiple importers. Duplicate deals between the two sources were identified by matching target country, investor country, number of hectares, crop(s) grown, and investor name, and the deal with more detailed information was retained while the other was deleted. Of the 1422 entries for individual land deals, 48 were identified as duplicates and removed, leaving 1374 individual land trade deals, which were further aggregated according to import and export country (including all trading partners in the case of deals with multiple importers). These data were then analyzed using Gephi (Bastian et al 2009), an open-source software package for visualizing and analyzing large-scale networks, and UCINET, a software package for the analysis of social networks (Borgatti et al 2002).
2.2. Network approach
The land trading system can be depicted as a network where countries are linked by agreements that represent the transfer of land via purchase or lease. Using this approach, land traded between two countries defines a trade link that connects two countries (or nodes). Many countries trading land form a network of topological relations (or agreements) that can then be analyzed. For simplicity, we confine most of our more sophisticated analysis (objective 1b and objective 2) to examining the undirected land trade network. Specifying directionality to the links adds another level of complexity to the representation (country A leases or purchases land from country B, yielding an export of land from country B to country A) which we use for the analysis of objective 3. Note that in the land acquisition network, countries can both import (acquire) land from one country and/or export (sell) land to another country, which we call 'land trading.' As a matter of convenience, we use this terminology throughout the rest of the article in order to frame the analysis.
2.3. Objective 1—position of countries in the land trade network
2.3.1. Objective 1a: number of land trade partners
In order identify the key actors in the land trading system we ranked the countries according to their number of land trading partners (import partners, export partners, and their sum for total partners). Cumulative frequency distributions were also constructed in order to inspect the trade activity levels across the land trade network.
2.3.2. Objective 1b: role of country for providing network connectivity
To analyze the role a country plays for providing land trade network connectivity (thereby shaping cross-system behavior), we use the network analysis measure of normalized betweenness centrality and plot it against the number of trading partners for each country from objective 1a. Betweenness centrality for a country counts the effective number of times that country lies on the shortest path (minimum number of trade links) 'between' all other country pairs in the network (e.g. Freeman 1977, Newman 2010). Betweenness centrality goes beyond using the information on a country's local trading activity from its number of land trade partners. Rather, it is a measure that gives information about the load that a country bears for ensuring that countries are sequentially connected across the network in an unbroken chain. It is computed by counting the number of times a country of interest intercepts the shortest pathway between all other country pairs in the network, divided by the number of shortest paths between all country pairs, before finally summing across all of these proportions for every country in the network. Therefore, if a country of interest does not possess the only shortest pathway between two other countries, its influence is reduced in the computation by increasing the denominator. Note that the word chain here implies that the one trade link connecting a pair of countries can join up with another trade link connecting another country pair where one of the countries in these two pairs is a member of both pairs. In this way, a gap-free chain of agreements is built up across the network. We therefore underscore that the word chain does not refer to the production chains commonly analyzed in multi-regional input–output analysis from economics (e.g., Moran et al 2013), or the material and energy flow analysis common in industrial ecology (e.g., Suh 2005), where raw materials exported by country A are processed by country B and the product is exported further to country C.
Here we report normalized betweenness centrality by dividing the betweenness centrality of a country by the total number of country pairs in the network (excluding the country for which betweenness centrality is calculated) (e.g. Newman 2003). This produces a value between 0 and 1 (and often expressed as a percentage), where a value near 1 (100%) indicates a central player ensuring that countries are connected in an unbroken sequence across the network, and a value near 0 indicating a more peripheral country that is relatively uninfluential in the broader network. For further information on calculations for network metrics, see supplementary material A, available at stacks.iop.org/ERL/9/114006/mmedia.
2.4. Objective 2—land trade submarkets
To identify the existence of land trading submarkets, we used the local clustering coefficient (e.g., Watts and Strogatz 1998, Borgatti et al 2002) which quantifies the extent to which subsets of countries form dense land trading relations among themselves, and sparse trading relations with other countries (e.g., Piccardi and Tajoli 2012). The local clustering coefficient is computed as the ratio between the number of land trades that occur between the direct trading partners of a country of interest and the theoretical maximum number of land trades that could potentially occur between those same partners. The local clustering coefficient can take any value between 0 and 1, with 0 indicating that none of the trading partners of a country of interest trade land with one another, and 1 indicating that every trading partner for a given country of interest has direct trade ties with one another. For further information, see supplementary material A.
2.5. Objective 3—land trade orientation
Finally, we examined whether countries tend to trade land with other countries with similar numbers of trading partners (which we term assortative trade orientation), or whether countries tend to trade with other countries with dissimilar numbers of trading partners (which we term disassortative trade orientation). Assortative trade orientation would occur if a country with many trading partners traded with other countries with many partners themselves (or if countries with few trading partners traded with each other). Disassortative trade orientation would occur if countries with many (few) trading partners trade land with other countries with few (many) trading partners. We examined land trade orientation using the metric of average nearest neighbor degree, and plotted this metric against the number of trading partners. Here, neighbor is not used in a geographic sense, but rather refers to countries that share a direct trading relationship. For example, though Sweden and Tanzania are not geographical neighbors, they are trading neighbors. For a country of interest, the average nearest neighbor degree is computed by first counting its number of trading partners. Thereafter, a tally is made of the total number of trading partners that, in turn, each of the trading partners of the country of interest has. Finally, this latter value is divided by the former value to obtain average nearest neighbor degree (e.g. Pastor-Satorras et al 2001, Newman 2003, Konar et al 2011). For the analysis of land trade orientation, we considered direction of trade (import or export) in order yield general insights regarding the country-level factors that may lie behind any observed trade asymmetries. More details can be found in supplementary material A.
3. Results and discussion
3.1. Objective 1—position of countries in the land trade network
3.1.1. Objective 1a: number of land trade partners
Out of the 195 countries recognized by the UN as of 2013, 126 (or 65%) participate in land trading. We found a total of 471 land trade relationships between these countries, which included 40 countries with one local import partner in addition to international partners. We removed these reflexive links from our analysis, thereby reducing the number of links from 471 to 431.
We found that the land trade network is dominated by a small number of countries that trade land with a large number of partners, with many additional countries playing minor roles by only trading with one or a few partners. Considering all trades without reference to the trading role played (land importer or exporter), China tops the list for total number of trading partners (36), followed by the US (31), UK (30), Brazil (24) and Australia (22) (figure 1).

Figure 1. The top 20 countries in the global land trade network, ordered by the largest number of trading partners. The list is also partitioned by number of import partners (gray bars) and number of export partners (red bars).
Download figure:
Standard image High-resolution imageThere are 70 countries importing land, which represents 55% of all countries in the network, but most of these also engage in exporting land (figure 2); relatively few countries (24 in total or 19%) act purely as land importers. For all importing countries, China again dominates, importing land from 33 countries, with the UK (30), US (28), Germany (20), and Singapore (18) rounding off the top five (figure 1). The importing countries are geographically clustered in North America, the Middle East, Western Europe, and Asia (figure 2). The number of exporting countries total 80, which represents 63% of all countries in the network, with most of these (56 countries, or 44%) acting purely as land exporters. The exporting country with the most trading partners is Ethiopia, which exports land to 21 countries, followed by Madagascar (18), Philippines (18), Brazil (17), and Mozambique (17). Exporting countries generally consist of less developed countries and are concentrated in Africa, South America, Southeast Asia, and Eastern Europe (figure 2). This highlights the fact that the division between land importing and exporting nations is an economic one, where land resources are being transferred from the Global South to the Global North.
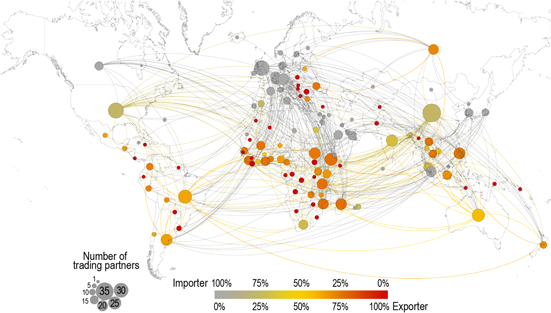
Figure 2. Map of the land trading network. The color of the node shows to what extent a country is an importer (gray) or an exporter of land (red), and the size of the node represents the number of trading partners. The links represent the flow of land acquired by an importer from an exporter. Link colors are that of the importing node. Number of countries (nodes) = 126, while number of land trade relationships (links) = 471 (reflexive links shown, e.g., loop for China having a national partner involved in land trade along with international partners).
Download figure:
Standard image High-resolution imageA total of 46 nations in the network (37%) are both importers and exporters of land (particularly those located in Asia and Eastern Europe), including two of the top five in terms of total trading partners (Australia and Brazil). For example, of Australia's total of 22 trading partners, it exports land to 13 partners and imports land from nine others. Despite this, most countries (63%) play only one role (importer or exporter) in the land trade system.
Most countries participating in global land trade, either as importers or exporters, are involved with only one or very few partners, underscoring the dominance of a very small number of countries in the land trade system (see figure 3, which contains cumulative frequency distributions showing the fraction of countries with number of trading partners greater than or equal to a certain size). A majority of exporting countries (70%) export land to six or fewer countries, with only 24 countries exporting land to seven or more partners. Trading is even more concentrated in importing countries, where 33% import from only one partner, and only 21 countries import land from seven or more partners.
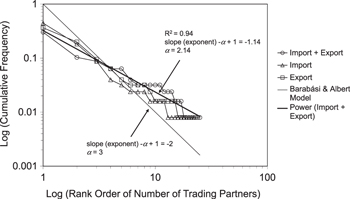
Figure 3. Cumulative frequency distributions (rank/frequency plot) of number of trading partners per country for the 126 countries participating in international land trades for both land imports and exports (circles), imports only (triangles), and exports only (squares). The thick curve is a power law fitted to imports and exports with slope (exponent) –α + 1, with α = 2.14 and R2 = 0.94. The thin curve represents a power law with slope –α + 1, with α = 3, conforming to the preferential attachment model of Barabási and Albert (1999). Construction of the cumulative frequency distributions follow the method given in appendix A of Newman (2005).
Download figure:
Standard image High-resolution imageNote that figure 3 shows that the cumulative frequency distribution of land trading partners (imports + exports) also conforms to a power law with exponent (slope in figure 3) equal to −α + 1, where in this case α = 2.14 and R2 = 0.94 (thick curve—see Newman (2005), for further details on power laws). The power law relationship implies that the network is scale-free, meaning that a typical number of trading partners for a country cannot be defined, and that the shape of the distribution remains unchanged across all domains of the distribution.
Though α is within the range of values typical for a great number of natural and some social systems, α = 3 would be expected for a network characterized by a pure preferential attachment process described by the Barabási and Albert (1999) model (thin curve in figure 3). Since α < 3, we hypothesize that this mechanism is constrained by geography, political relations, legal frameworks and colonial ties. For example, it might be easier for countries to forge land deals with partners that are geographical neighbors, or with partners that share common history or language. One potential implication of the preferential attachment process is that those countries with many trading partners will tend to accumulate even more trading partners over time, making them increasingly dominant players in the global land trade system. This tendency is a feature of a great number of natural and some social systems (Barabási and Albert 1999). The economic opportunity and/or need amongst some of the land-rich countries across the Global South, coupled with the demand and financial means amongst some of the more land-impoverished countries of the Global North would mean that these two groups would have greater visibility in the land acquisition markets through promoting themselves. This would conceivably lead to a positive feedback in the number of trading partners they accumulate over time.
3.1.2. Objective 1b: role of country for providing network connectivity
In general, we find that countries with many trading partners also play a more important role in providing network integrity as shown by their high normalized betweenness centrality scores, while those with few trading partners have low normalized betweenness centrality scores (figure 4(a)). The association is weakly nonlinear, indicating that as the number of trading partners increases, a country has proportionally greater influence in contributing to trade connectivity of the network. The average normalized betweenness centrality score for the entire land trading network is 1.4%, meaning that on average, any given country in the network lies on the shortest path between any two other countries only 1.4% of the time. Three countries (China, the US, and the UK) have normalized betweenness centrality scores over 10%, meaning that individually, these countries are found along the shortest trading paths between more than 10% of all other country pairs in the network. A total of 41 countries (33% of those in the network) with normalized betweenness centrality scores of 0 represent the outer periphery of the network and possess only one direct trading partner. Note that figure 4(b) shows that the relationship between number of trading partners and normalized betweenness centrality is best fit by a power law with slope (exponent) = 2.33, accompanied by a R2 = 0.81 (thick curve). The thin curve shows a model with slope (exponent) = 1.0 for comparison. That this relationship also follows a power law is to be expected given its correlation with number of trading partners (the distribution of which is also best fit by a power law), while the slope (exponent) near 2 indicates that the land acquisition network has a well-developed branching structure (e.g., Barthélemy 2004).
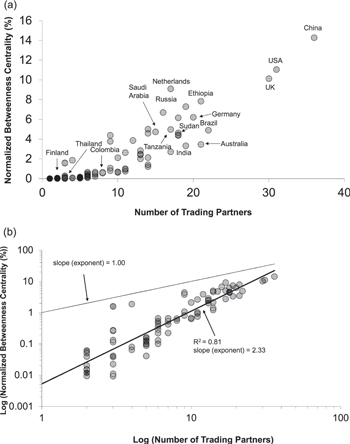
Figure 4. (a) Normalized betweenness centrality versus number of land trading partners (imports + exports) for 126 countries in the land trade network (circles). Circle shade intensity indicates degree of overlap between data points (the more circles that overlap, the darker the shade). A high normalized betweenness centrality indicates a globally influential country that is responsible for connecting many other countries in an unbroken sequence across the network, and a value near 0 indicates a more peripheral country that is relatively uninfluential in the broader network. (b) Same as (a) but on log–log scale, showing that the relationship between normalized betweenness centrality and number of land trading partners (imports + exports) follows a power law with slope (exponent) of 2.33 and R2 = 0.81. A power law with slope (exponent) 1 is shown for comparison.
Download figure:
Standard image High-resolution imageThe Netherlands is an anomaly because it has a normalized betweenness centrality score almost as large as the UK (figure 4(a)) despite having half as many trading partners, meaning its relatively few trading partners are strategically important for providing network connectivity. The Netherlands has for many centuries functioned as a transportation hub due to its strategic maritime position, coordinating the traffic of goods and services between Europe and the rest of the world. Previous studies concerning the global trade network of agriculture and finance show that the Netherlands has played a disproportionately large role for coordinating global trade, as indicated by high betweenness centrality scores computed for finance (De Benedictis and Tajoli 2011, Ercsey-Ravasz et al 2012) and water (Konar et al 2011) networks. As the land trade network is a subset of the larger global trade network, it is reasonable to assume that it would inherit some of the larger network's features (see section 3.4).
3.2. Objective 2—land trade submarkets
Overall, the land trade network displays a low incidence of clustering and therefore a high degree of global homogeneity and integration. This is shown by the fact that most countries in the land trade network have a small local clustering coefficient, with a mean for the entire network of 0.17. This implies that only 17% of all potential trading ties are established between the trading partners of a country, on average. Figure 5(a) shows that although the relationships between local clustering coefficient and number of trading partners exhibit considerable scatter, the local clustering coefficient decreases as the number of trading partners increase. But we also note that many countries with few trading partners also have low local clustering coefficients.

Figure 5. (a) Local clustering coefficient versus number of trading partners (imports + exports) for 126 countries in the global land trade network (circles). Circle shade intensity indicates degree of overlap between data points (the more circles that overlap, the darker the shade). The local clustering coefficient identifies the existence of trading submarkets in the network, where countries with values near 1 indicate that their trading partners form dense land trade connections with one another (trading submarket) while values near 0 indicate sparse trading links between its trading partners. (b) Same as (a) but on log–log scale, showing that the relationship between normalized betweenness centrality and number of land trading partners (imports + exports) is best fit by a power law with slope (exponent) of −0.69 and R2 = 0.40. A power law with slope (exponent) of −1 is shown for comparison.The power law combined with the weak correlation coefficient suggests that the organization of submarkets is weakly hierarchical.
Download figure:
Standard image High-resolution imageDespite the overall low level of clustering, a few distinct submarkets exist in the global land trade network, where trading partners are well-connected both directly to each other, and indirectly through one intermediary country with whom they both trade. For example, Finland has a local clustering coefficient of 1.0 (figure 5(a)), meaning that Finland's trading partners (Sudan and China) also trade land with each other. Note, however, that this does not imply that Sudan and China are trading land exclusively with each other and with Finland, as Sudan and China also have many other trading partners and themselves possess low local clustering coefficients (0.20 and 0.09 respectively). Countries with low numbers of trading partners, therefore, can form trading cliques where the trading partners of these countries also trade land with one another.
Most countries, in particular those with many trading partners, have low local clustering coefficients around 0.1, including the UK, the US, and China. This means that only 10% of the potential trading links between China's trading partners are realized. Therefore those countries with many trading partners function to bring those countries with a low number of trading partners into the land trading network.
We hypothesize that land trade relations for countries with moderate or high local clustering coefficients could be shaped by pre-established historical, geographical, political, and colonial ties. An example from our study would the land trading ties that bind Swaziland (local clustering coefficient of 1), the UK, and South Africa; further investigating this hypothesis across the land trade network would require detailed case studies.
We also hypothesize that the land trade network is weakly hierarchical, where trading between small trading submarkets undergirds the less vigorous trading between larger, more weakly connected submarkets and so on. This is because there exists a moderately weak power law relationship between the clustering coefficient and number of trading partners with slope (exponent) = −0.69 and R2 = 0.40 (thick curve) (figure 5(b)). Networks that are strongly hierarchical yield slopes (exponents) very close to −1 (see the thin curve in figure 5(b) for comparison) (e.g., Ravasz and Barabási 2003). We propose that geography imposes an organizational structure onto the land trade network that acts to pull the slope (exponent) of the relationship closer to 0. Such an effect (though more extreme) has been demonstrated in networks more purely organized by geographical location such as the power grid and internet routers (Ravasz and Barabási 2003).
3.3. Objective 3—land trade orientation
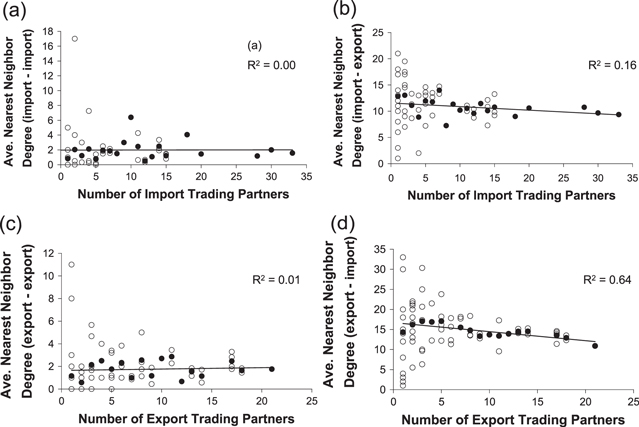
In comparing the trading activity level of countries with their import and export partners (land trade orientation using nearest neighbor degree), we found no clear relationship between number of import (figure 6(a)) or export (figure 6(c)) partners for countries of interest (located on the x-axis) and their trading partners (in both cases, slope is near 0 with an R2 < 0.01). There was a slight tendency towards disassortativity for countries with many import partners to trade with countries with many export relationships (figure 6(b) has a negative slope, R2 = 0.16). For example, Kenya imports land from two countries (Sudan and Tanzania) that in turn export land to 17 other countries on average. There was a moderately strong disassortative relationship where countries with a low (high) number of export partners show a strong preference for trading land with countries having a high (low) number of import partners (figure 6(d) has a steeper negative slope, with R2 = 0.64). Examples include Cameroon, which exports land to six countries that in turn import land from 17.8 countries on average.
Figure 6. Average nearest neighbor degree versus number of trading partners four land trade orientations: (a) number of import partners versus average number of import partners of nearest neighbors. (b) Number of import partners versus average number of export partners of nearest neighbors. (c) Number of export partners versus average number of export partners of nearest neighbors. (d) Number of export partners versus average number of import partners of nearest neighbors. Open circles are average nearest neighbor degree per country, while the solid circles are means per 'number of trading partner' class. The solid line is a least squares regression through the means (solid circles) with an associated coefficient of determination (R2). Negative slopes indicate disassortative land trade orientation where countries with many (few) trading partners trade land with other countries with few (many) trading partners.
Download figure:
Standard image High-resolution image
For figures 6(a)–(d), note the steep decrease in the range of average nearest neighbor values (open circles) with increasing trade activity for all instances, meaning that the pool of countries with high trade activity decreases considerably, thereby severely limiting the number of average nearest neighbor degree observations for a given country with vigorous trade activity. This is to be expected, as we have shown that very few countries are highly active land traders (section 3.1).
The slight to moderate disassortativity shown in figures 6(b) and (d) implies that less developed countries tend to have a large array of export partnerships with wealthy countries, but import little land themselves. For example, Ethiopia exports land to 21 countries located in the Global North and to the more developed parts of Asia and the Middle East, but does not import any land at all. It is also evident that some more developed countries cast a diverse net and import land from many other countries, thus plugging them into the global land trade network, but do not export much land. An example is China, importing land from 33 countries but exporting land to only three. However, those countries that simultaneously have larger numbers of both import and export partners provide exceptions to these generalizations and act to weaken the relationships in figure 6. Examples include Australia and Brazil, who export to 13 and 17 partners respectively, while importing from nine and seven partners.
We hypothesize that vigorous importers of land trading land with one another would not yield financial benefits because land resources are either expensive or scarce in these countries, which is why they seek to import land from the exporting countries where it is more cheap and plentiful. As an example, Saudi Arabia has 15 exporting partners, most of which are located in Africa. Additionally, exporting countries trading land with one another would not yield benefits as these countries would already have adequate land resources and would therefore seek to export their land to those countries that desire land for various reasons. An example would be Ethiopia, which exports land to 17 other countries mostly located in the Global North and the richer parts of the Middle East. These types of relations likely underlie the weaker relationships evident in figures 6(a) and (c).
A multitude of other factors could also contribute to the reduction in disassortativity and large scatter in average nearest neighbor degree, particularly for low levels of trade (open circles) in figure 6. For example, while countries tend to form trading partnerships with other countries that already have high trade activity, certain types of land trade partnerships may be forged due to the existence of geographical, historical, colonial, legal and linguistic ties. A similar interpretation is provided by Davis et al (2013) in order to account for similarly weak patterns in their study of global human migration.
3.4. Comparison with the global agricultural trade network
Recent work has used network analysis to characterize trade in agricultural products, particularly by focusing on the virtual water embedded in some internationally traded crops and food products (Konar et al 2011, Suweis et al 2011, Dalin et al 2012). These analyses include a much larger fraction of global agricultural production (e.g., 60% of global calorie consumption in Dalin et al (2012)) than the land trade network analyzed here, although our analysis also includes deals producing flexible or fuel crops as well as food. Thus, we will briefly compare some of the broad similarities and differences between these previous analyses of larger networks of global food production, and our analysis focusing on production of crops for a variety of purposes on internationally acquired land.
Firstly, it is apparent that countries located in the Global South are completely absent from the top traders in these larger networks (e.g., Konar et al 2011) presumably because they are restricted to subsistence trade flows. The prominence, therefore, of a great many of countries located in the Global South in the land acquisition system represents a novel development in global trade systems.
Topologically, the land acquisition network is much smaller in terms of mean number of trade links per country, as well as total number of trade links, by factors of about seven and ten respectively, compared to the larger trade networks (e.g. Konar et al 2011, Suweis et al 2011, Dalin et al 2012). The larger networks are also characterized by the dominance of a small number of countries but their cumulative frequency distributions of trading partners are best fit by exponential models, unlike the power law we found for land acquisitions (e.g., Konar et al 2011, Dalin et al 2012). Furthermore a greater degree of regionalization in these larger networks is apparent as can be seen from a much higher degree of local clustering. Like the land acquisition network, a strong dependence of betweenness centrality on number of trading partners is also observed in the larger networks (Konar et al 2011, Suweis et al 2011)
We speculate that these structural differences are due to the fact that the global agricultural trade network represents a more mature configuration where the growth of the network has slowed considerably and changes in network size are restricted to the addition and removal of trade links between already participating countries rather than the addition of new participant countries. Additionally, economically powerful countries that have long been at the core of the global agricultural network may no longer be forging new trade relations as quickly and are giving way to the emergence of a new set of second tier, but still influential actors (e.g., De Benedictis and Tajoli 2011). All of these factors would contribute to the reduction of a well-developed 'core–periphery' pattern still found in the land trade network. That the cumulative frequency distribution of trading partners for the large agricultural trade network is best fit by an exponential model rather than a power law also suggests a significant deviation from the preferential attachment process described by the Barabási and Albert (1999) model (see section 3.1) and lends some support to these arguments.
3.5. Vulnerabilities arising from land trade telecoupling
From a risk perspective, environmental or geopolitical stressors affecting a country that is tightly woven into the land trade network could efficiently transfer such a crisis to many other countries. For example, Ethiopia is a land export hub, selling or leasing land to 21 countries in the network (figure 1). Ethiopia also has a relatively high normalized betweenness centrality (7.8%), meaning that it plays a prominent role in indirectly connecting many other countries through land trading. Should any country become dependent on Ethiopia for future food imports (e.g., Saudi Arabia), a famine in Ethiopia could lead to price hikes in dependent countries. Such a price ripple could spread across many other countries indirectly through the importing country.
We note that many areas of land export are concentrated in regions with moderate to high yield gaps such as sub-Saharan Africa and Eastern Europe (Mueller et al 2012); such areas have the potential to increase yields through increased technology and management from foreign partners, but also to transfer risk throughout the network under stress. These countries would also be internally vulnerable to the vagaries of the global markets because investors on the ground (e.g. government or corporate importers of land) could suddenly pull out, therefore saddling the exporting country with various problems.
We have also shown that countries that have a large number of export partners tend to trade land with countries that have a low number of import partners (disassortative relationship in figure 6(d)), implying that such a stressor could simultaneously reach a diverse array of import countries in the network. In line with this, there is evidence that the structure of the land trading network is fragile. Simulation experiments by Newman (2002) show that networks that are either disassortative or randomly arranged (neither assortative nor disassortative) are more unstable, and thus more vulnerable to disintegration, compared to networks that show assortative properties. Topologically, this would entail a major decline in a node's number of links or the deletion of a node. In terms of the land trade network, this would be equivalent to a decline or disappearance of a country from the land trade network due to a decrease or elimination trade relations from changes in natural resource availability or economic status.
We speculate that countries belonging to land trade submarkets may be buffered against geopolitical and environmental disturbance (caused by or causing changes in natural resource availability) because of decreased dependence on global land trade. Local clustering has been shown to lead to robust function in biological networks (Kashtan and Alon 2005). But the rare occurrence of submarkets in the land trade system (indicated by a low average clustering coefficient, 0.17) is suggestive of a highly integrated globalized system that would be more prone to the efficient spread of a crisis.
The emerging paradigms of teleconnections and telecouplings in the land and sustainability sciences (Seto et al 2012, Liu et al 2013, Yang et al 2013) recognize that the planet is shrinking due to the interconnectivities associated with global trade. While there may be a large geographical separation between trading nations, the relational distances can be small by virtue of these trade connections. Recent work has underscored the vulnerability of geographically distant places and people to environmental stressors (Adger et al 2008), which can undermine institutional structures that aim to protect human rights and ecosystem services (Sikor et al 2013). On an interconnected planet, such crises can spread well beyond their places of origin while simultaneously interacting and synchronizing with events elsewhere (Biggs et al 2011). In this paper, we point to an explicit framework for tracing such perturbations through the land trading system.
Other analytical frameworks such as multi-regional input–output analysis from economics (e.g., Moran et al 2013) and material and energy flow analysis common in industrial ecology (e.g., Suh 2005) also use network representations. To the best of our understanding, these approaches are designed to be used with data on flows energy, resources, or money across a chain of inputs and outputs in well-defined systems. Conceivably, these methods could be applied successfully to the land acquisition system, but a larger number of assumptions and a different kind of data would be required to implement them. This combined with a lack of appropriate and reliable data about land acquisitions motivates our application of a more inductive, data-mining framework (that of complex networks) that facilitates a general and fundamental understanding of system structure and function.
We recognize several possible limitations of this study that would benefit from further analysis. One limitation in our study entails our choice of country as the unit of analysis. Though most global-level studies associated with trade apply similar, or even coarser levels of aggregation (e.g., FAO regions), this level of aggregation obscures the role that corporations and financial markets play in shaping land acquisitions. These entities may not be wholly acting in the interests of the country, though they may be subjected to some form of regulation. Another uncertainty entails the reliability of the land transaction data itself, at the sub-country level. Though we merged two databases in order to establish a more complete pool of data with which to work, the data reporting is often incomplete and inaccurate, partly due to the lack of standardization in reporting, and partly due to poor transparency by those engaged in land trades (e.g., Edelman 2013, Oya 2013, Pearce 2013). The data are also subject to change as new information comes to light. For example, new countries not previously represented in our database may enter the land trade network, or new agreements may be established between countries already engaged in the land trade network that did not previously trade land with each other.
Nevertheless, in spite of frequent changes to these databases, we expect that our data (aggregated to the country level) would be insensitive to errors in over- or under-reporting of specific deals already established between actors (governments, private firms) within two specific countries already participating in land trading. This is because it is sufficient to have one deal established between actors in two countries in order to define a link at the country-level. A greater number of deals established at a sub-country level would not produce a greater number of trade links at the country level. Finally, it remains to be seen whether the overall properties of the land trading system (characterized by strong hierarchical ordering in land trade connections and betweenness centrality, low level of local clustering, and weak to moderate disassortativity) will remain consistent over the long-term as various countries may shift their relative positions within the network over time, and as new countries enter into land trading.
4. Conclusions
To the best of our knowledge, we have provided the first exploratory, top-down analysis of the topology of the land trading system using a complex networks approach. We have shown that trade activity conforms to a well-developed hierarchy, with a small number of countries showing high trading activity for both import and export of land. Importing nations are concentrated in the Global North, the emerging economies of Asia, and the Middle East, while exporting nations are generally concentrated in the Global South and Eastern Europe where yield gaps are highest, as well as areas with mixed yield performance including South America and Southeast Asia. We have also shown that the land trade network is highly integrated and globalized, with a small number of countries responsible for connecting the system. This result is further underscored by the overall weak level of preferential or regional land trading signified by the small number of land trade submarkets. Finally, we have shown that the land trading system is weakly disassortative. Many of our results underscore the potential fragility of the network.
We have also contributed to advancing research in telecoupling by applying the tools of network science for describing the architecture and cross-scale integration of the global land trade system. Such a global analytical framework is useful for generating insights about how changes in the global land trade system over time could influence its functioning (as we have demonstrated). Insights of this kind could be applied to other global systems such as migration of people and species, and transfers of physical, financial, and knowledge resources to better understand and manage an increasingly globalized world.
Acknowledgements
We are indebted to LUCID (www.lucid.lu.se), a Linnaeus Centre of Excellence at Lund University funded by FORMAS (grant number 259-2008-1718), as well as the FORMAS-funded LUsTT (Land Use Today and Tomorrow) project (grant number 211-2009-1682) for financial support. We thank the members of the LUCID steering committee for providing a rich forum for discussing the work. We are also grateful to Dr Megan Konar at University of Illinois at Urbana-Champaign for providing the code for computing nearest neighbor correlations. Finally, we thank two anonymous reviewers for helping improve the clarity and content of the manuscript.