
Abstract
Producing energy resources requires significant quantities of fresh water. As an energy sector changes or expands, the mix of technologies deployed to produce fuels and electricity determines the associated burden on regional water resources. Many reports have identified the water consumption of various energy production technologies. This paper synthesizes and expands upon this previous work by exploring the geographic distribution of water use by national energy portfolios. By defining and calculating an indicator to compare the water consumption of energy production for over 150 countries, we estimate that approximately 52 billion cubic meters of fresh water is consumed annually for global energy production. Further, in consolidating the data, it became clear that both the quality of the data and global reporting standards should be improved to track this important variable at the global scale. By introducing a consistent indicator to empirically assess coupled water–energy systems, it is hoped that this research will provide greater visibility into the magnitude of water use for energy production at the national and global scales.
Export citation and abstract BibTeX RIS

Content from this work may be used under the terms of the Creative Commons Attribution 3.0 licence. Any further distribution of this work must maintain attribution to the author(s) and the title of the work, journal citation and DOI.
1. Introduction
Producing energy resources often requires significant quantities of freshwater (Gleick 1994). Water is required for nearly all production and conversion processes in the energy sector, including fuel extraction and processing (fossil and nuclear fuels as well as biofuels) and electricity generation (thermoelectric, hydropower, and renewable technologies). As an energy sector changes or expands, the mix of technologies deployed to produce fuels and electricity determines the associated burden on regional water resources.
To guide the assessment of the water use impact of energy production on water resources, it is useful to apply the well-developed concept known as the water footprint. A water footprint is 'the volume of water needed for the production of goods and services consumed by the inhabitants of the country' (Hoekstra and Chapagain 2007, 35). The water footprint is further specified by type of water use, with 'blue water' representing consumption of surface and groundwater, 'green water' representing consumption of water via soil strata (e.g. rain-fed agriculture), and 'gray water' as the amount of water required to dilute pollutant flows into the environment (Mekonnen and Hoekstra 2010).
A number of previous studies have applied the concept of the water footprint to the energy sector (either directly or indirectly) by consolidating estimates of water use coefficients for a range of energy technologies, with emphasis on fuel production (Wu et al 2009, Mittal 2010, Mekonnen and Hoekstra 2010), electricity generation (Barker 2007, Macknick et al 2011), or both (Gleick 1994, DOE 2006, Fthenakis and Kim 2010, Mulder et al 2010, Mielke et al 2010, Meldrum et al 2013). The results of these studies collectively demonstrated that the quantity and quality of water demanded varies significantly by energy process and technology, from rather negligible quantities of water used for wind and solar electricity generation to vast, agricultural-scale water use for the cultivation of biofuel feedstock crops. Hence, the selection of technologies deployed for energy production within a given location has important implications on regional water use.
Additional studies have explored this geographic approach to water use for energy systems, including country-level or regional analyses of water consumption across entire energy portfolios (DOE 2006, Elcock 2010) or global analyses of water consumption by a single energy type (Vassolo and Döll 2005). This study builds on this previous work by providing the first international, country-level comparison of water consumption for both fuels and electricity production.
For consistency and brevity, the metric for estimating 'water consumption for energy production' will be referred to as water consumption of energy production (WCEP). The WCEP indicator is conceptually similar to the water footprint, but is more specifically defined as a detailed estimate of regional 'blue water' consumed by the processes and technologies specifically for producing energy, including both fuels and electricity. Further, in addition to the categories of freshwater and groundwater, we also include highly treated water from impaired sources, such as desalinated seawater, within the category of 'blue water' to indicate that the post-treatment quality of the water sufficiently merits its reclassification as a more competitive resource. Finally, while energy production does have both green and gray water footprints as well, these categories of water use fall outside the scope of this paper.
In further defining water use, it is important to distinguish between water withdrawals and water consumption. As defined by the US Geological Survey (USGS), water withdrawals are defined as 'the amount of water removed from the ground or diverted from a water source for use' (USGS 2009, 49). Water consumption is a subset of the withdrawals category and refers to the amount of 'water withdrawn that is evaporated, transpired, incorporated into products or crops, or otherwise removed from the immediate water environment' (USGS 2009, 47).
The WCEP indicator focuses on water consumption, rather than withdrawals, as the key water use variable in this study. While both consumption and withdrawals are important variables to consider within the broader regional management of water, water consumption is especially useful in understanding the impact of energy sector operations on the water sector. Consumption represents an exclusionary use of water where use by one user directly prevents other users from accessing that quantity of the resource, providing a direct measurable impact on water security and sustainability. In contrast, water withdrawals may be returned to the water source (albeit at a potentially lower quality) to be used again by other consumers or by the natural environment, and hence represent a more equivocal metric for assessing regional water impact.
Finally, this paper does not include water consumption estimates for hydropower. While some studies allocate evaporative reservoir losses as a consumptive use of water by hydropower, this association is ambiguous. Reservoirs serve a multitude of other critical societal purposes, most notably water supply storage and regional flood control (WCD 2000, Fthenakis and Kim 2010). Therefore, assigning reservoir water evaporation to hydropower can be misleading. For this reason, and in following the precedent of other substantive studies that have excluded hydropower from water for energy studies (Elcock 2010, Macknick et al 2012), calculations of water consumption for hydropower are not included in the overall WCEP assessment.
2. Methodology
This research compares the total water consumption of national energy portfolios by energy type. Because data on actual water consumption for energy systems do not exist at the international scale, estimating these values required consolidating country-level energy production data and applying water consumption factors by energy production technology or process to approximate a water volume.
Existing estimates of water consumption factors for energy production vary substantially in the literature. Hence, establishing the consistency of the WCEP metric required defining clear parameters for the selected estimates. For this paper, only 'operational' water consumption (i.e. consumption that is limited to processes directly related to energy production) is considered (Macknick et al 2011). It does not include the embedded water in equipment and materials (e.g., in fabricating photovoltaic panels) or related to power plant construction. Similarly, water used at energy production facilities for auxiliary purposes (e.g., bathrooms at a power plant) is not included. In sum, water consumption factors were consolidated from the literature and selected specifically from the most recent reports that were able to clearly and consistently identify the consumptive use of freshwater for operational energy production.
2.1. Fuel production
Fuel production data were gathered from the US Energy Information Administration International Energy Statistics Database (EIA 2011). Energy production data for each energy category were consolidated and converted to a common unit (gigajoule; GJ) to ease aggregation and water consumption calculations. For fossil, nuclear, and biomass-based fuels, it was necessary to find data on the fuel production quantities for each major process in the fuel cycle. Because fuel extraction and processing do not necessarily take place in the same country, we collected as much readily available data as possible to trace water consumption geographically according to each phase of the fuel cycle.
For fossil fuels, the EIA database does not provide detail on the production of conventional vs. unconventional fossil fuels, so additional data were acquired from the EIA for oil sands (EIA 2010), and from the World Energy Council (WEC) for heavy oil, shale oil, and shale gas (WEC 2010a, 2010b). Water use associated with fossil fuel transformations (such as coal gasification, coal liquefaction, and hydrogen production) was not included in this study, but could be included in future assessments as these processes become more widespread.
Water consumption estimates for fuel production are mostly related to direct extraction and processing (Gleick 1994). Given the limited data on specific fossil fuel extraction and processing technologies utilized within each country studied, it made sense to apply the water consumption estimate that reflected the most frequently applied technologies or processes. For example, for oil production we used an averaged water consumption factor for primary and secondary extraction (Wu et al 2009), since we did not have data on the deployment of more advanced technologies, such as Enhanced Oil Recovery (EOR).
Table 1 provides a summary of the categories of fuel production included in this study, the sources for international estimates of fuel production on a country-by-country basis, and the estimates and sources for the water consumption factors applied to each fuel production category.
Table 1. Fuel production categories with water consumption factors and data sources.
| Water consumption factor (m3 GJ−1) | ||||||
|---|---|---|---|---|---|---|
| Energy category | Sub-category | Energy production sourcea | Estimateb | Min | Max | Sourcec |
| Fossil fuel | Coald | [1] | 0.043 | 0.006 | 0.242 | [7] |
| Conventional oile | [1] | 0.081 | 0.036 | 0.140 | [8] | |
| Oil sandsf | [2], [3] | 0.114 | 0.072 | 0.132 | [8] | |
| Oil refining | [1] | 0.040 | 0.026 | 0.048 | [8] | |
| Conventional gas | [1] | 0.004 | 0.001 | 0.027 | [7] | |
| Shale gas | [4] | 0.017 | 0.003 | 0.221 | [7] | |
| Nuclear fuel | Uranium miningd | [5] | 0.033 | 0.000 | 0.252 | [7] |
| Milling | [5] | 0.012 | 0.003 | 0.030 | [7] | |
| Conversion | [5] | 0.011 | 0.004 | 0.014 | [7] | |
| Diffusion (enrichment) | [5] | 0.037 | 0.034 | 0.039 | [7] | |
| Centrifuge (enrichment) | [5] | 0.004 | 0.003 | 0.006 | [7] | |
| Fuel fabrication | [5] | 0.001 | 0.001 | 0.003 | [7] | |
| Fuel reprocessing | [5] | 0.007 | 0.007 | 0.007 | [7] | |
| Biofuel processing | Ethanol | [1] | 0.145 | 0.092 | 0.290 | [9] |
| Biodiesel | [1] | 0.031 | 0.031 | 0.031 | [9] | |
| Biofuel cultivation | Sugarcane (ethanol) | [3], [6] | 24.550 | 0.000 | 156.000 | [10] |
| Maize (ethanol) | [3], [6] | 8.090 | 0.000 | 554.000 | [10] | |
| Sugarbeet (ethanol) | [3], [6] | 9.790 | 0.000 | 157.000 | [10] | |
| Rapeseed (biodiesel) | [3], [6] | 19.740 | 0.000 | 270.000 | [10] | |
| Soybean (biodiesel) | [3], [6] | 11.260 | 0.000 | 844.000 | [10] | |
| Palm oil (biodiesel) | [3], [6] | 0.000 | 0.000 | 0.850 | [10] | |
aSources for global energy production estimates (all data for 2008 unless otherwise specified) [1]: EIA (2011), Oil refining data for 2006 [2]; EIA (2010) for oil sands data [3]; WEC (2010a) [4]; WEC (2010b) [5]; IAEA (2011) [6]; Cushion et al (2009). bAll water consumption factor estimates are for the median values except for the biofuel feedstock cultivation estimates, which represents the average value. This is consistent with the estimates in the literature. cSources for water consumption factor estimates [7]: Meldrum et al (2013) [8]; Wu et al (2009) [9]; Mittal (2010) [10]; Mekonnen and Hoekstra (2010). dThe source paper for the water consumption factor (Meldrum et al 2013) differentiates the coal fuel cycle and uranium mining by underground and surface mining. However, since the EIA and IAEA energy production data does not specify mining type for coal or uranium production, the average of the underground and surface water consumption factors was calculated within each of the energy categories. eAssumed all oil production was through primary/secondary recovery since enhanced oil recovery (EOR) processes were not specified in data. EOR methods can be ∼3× more water-intensive than primary/secondary recovery (Mielke et al 2010). fIncludes estimation of oil shale and heavy oil as well.
For nuclear fuel extraction and processing, data were collected from the International Atomic Energy Agency's (IAEA) online database of nuclear fuel cycle processing capacity, the Nuclear Fuel Cycle Information System (NCFIS, IAEA 2011). The NCFIS database contained uranium production data disaggregated by country and by process stage in the nuclear fuel cycle. Since the data are given in terms of production capacity and not actual production, it was assumed that all plants were operating at full capacity to provide annual production estimates. Finally, while the NCFIS database provided uranium production in terms of mass, all the water consumption factors were linked to units of nuclear fuel energy (Meldrum et al 2013). Nuclear fuel mass units were converted to energy units using conversion factors from the World Information Service on Energy (WISE 2009) Uranium Project (2009). See table SI-1 in the supplementary information (SI), available at stacks.iop.org/ERL/9/105002/mmedia, for more details.
Unlike the data for fossil fuels, where extraction quantities were clearly disaggregated from refinery production, the biofuel data source (EIA 2011) does not specify between biofuel cultivation and processing. As such, all biofuels produced in a country were assumed to have been derived from feedstock crops grown in that country. Further, given the lack of a comprehensive international database of biofuel production by crop feedstock, we needed to derive estimates for biofuel feedstock production for each country based on secondary reports (WEC 2010a, Cushion et al 2009).
Similarly, water consumption factors for biofuels had to be consolidated for both cultivating the feedstock crops and processing the feedstock into biofuels. The biofuel crops studied were first-generation biofuels in current production, not second-generation biofuels derived from algal or cellulosic feedstocks. Water consumption calculations were based on applying water consumption coefficients to the specific biofuel feedstock cultivation of the following fuel crops: rapeseed, soybean, and palm oil for biodiesel production, and sugarcane, maize, and sugarbeet for ethanol production.
Irrigation requirements vary widely based on the regional climate, irrigation technology deployed, local farming practices, and regional land use change (Mekonnen and Hoekstra 2010). To accommodate this variation we consolidated country-specific water consumption factors for irrigation by crop type from a detailed analysis by Mekonnen and Hoekstra (2010). Water consumption factors for biofuel processing were selected from Mittal (2010).
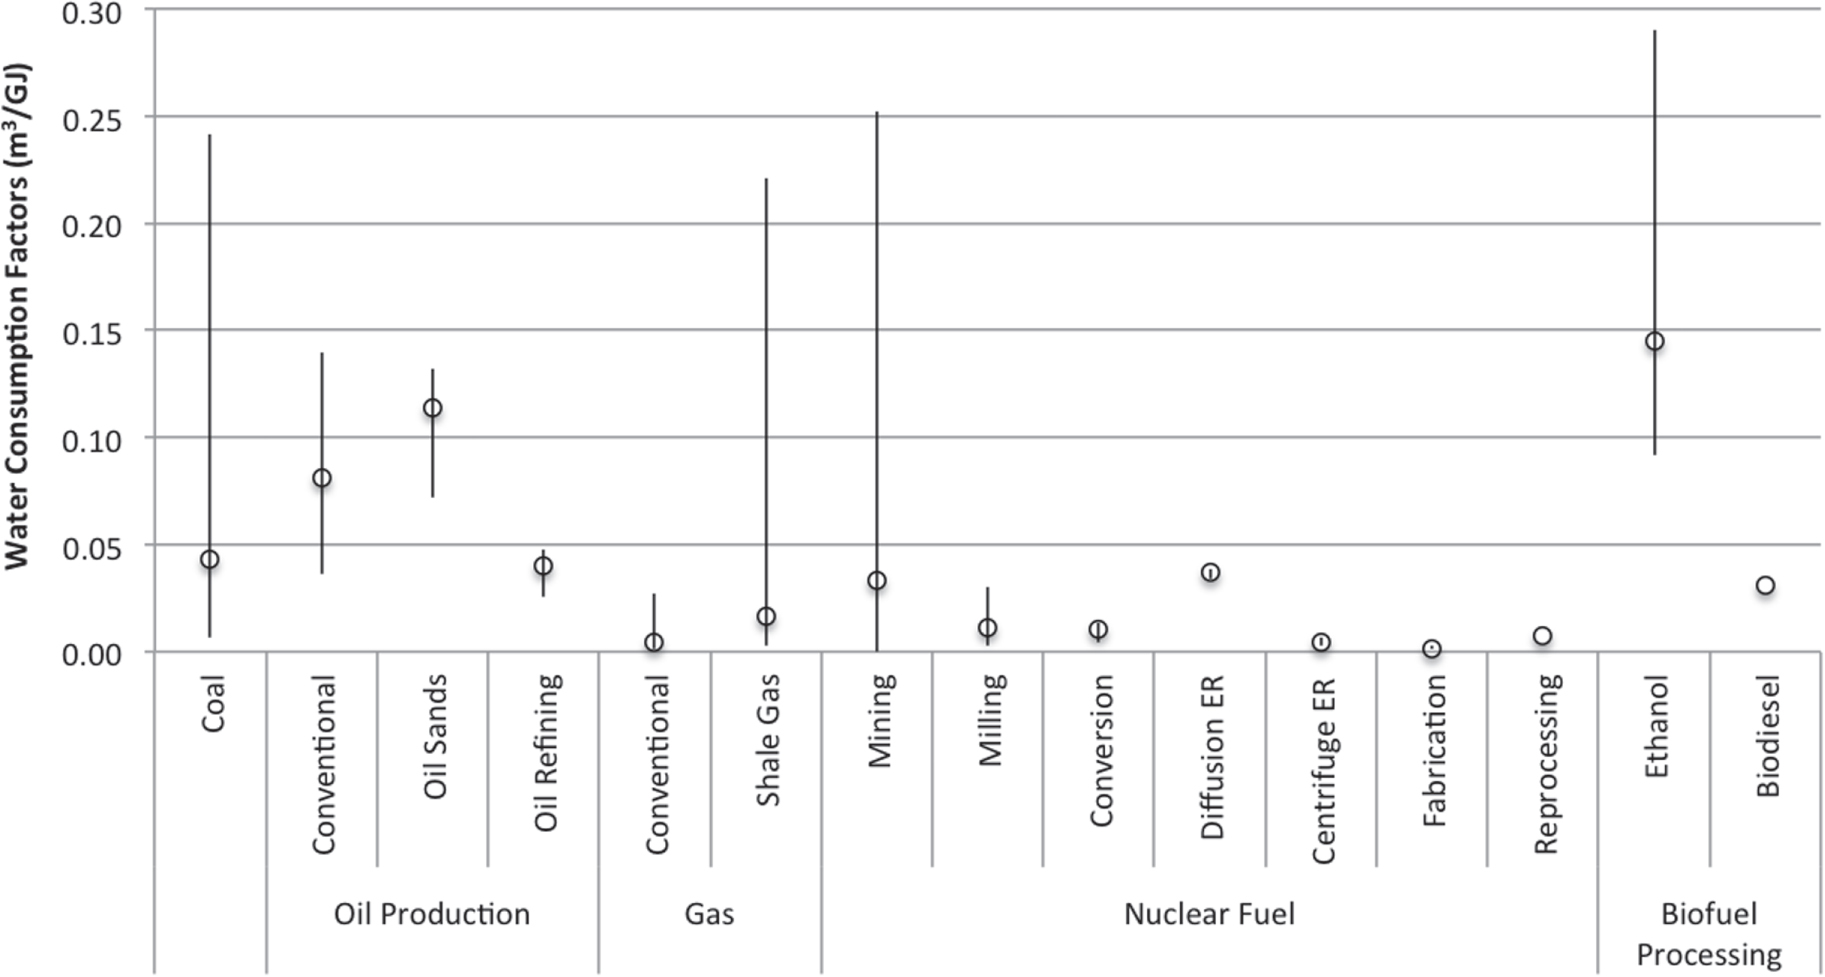
Figure 1 consolidates the estimates of water consumption factors for fuel production (median and range) as listed in table 1. The median estimates for water consumption factors for oil production tend to be higher than those for any other fuel category (aside from ethanol processing). Further, unconventional fossil fuel sources (oil sands and shale gas) tend to consume more water than conventional sources. Finally, it is worth noting the wide range of water consumption estimates for coal, shale gas, uranium mining and ethanol processing, suggesting that these estimates might be more variable from site to site based on local conditions or type of technologies deployed (Mittal 2010, Meldrum et al 2013).

Figure 1. Consolidated estimates of water consumption factors for primary fuel extraction and processing. Note: ER = enrichment.
Download figure:
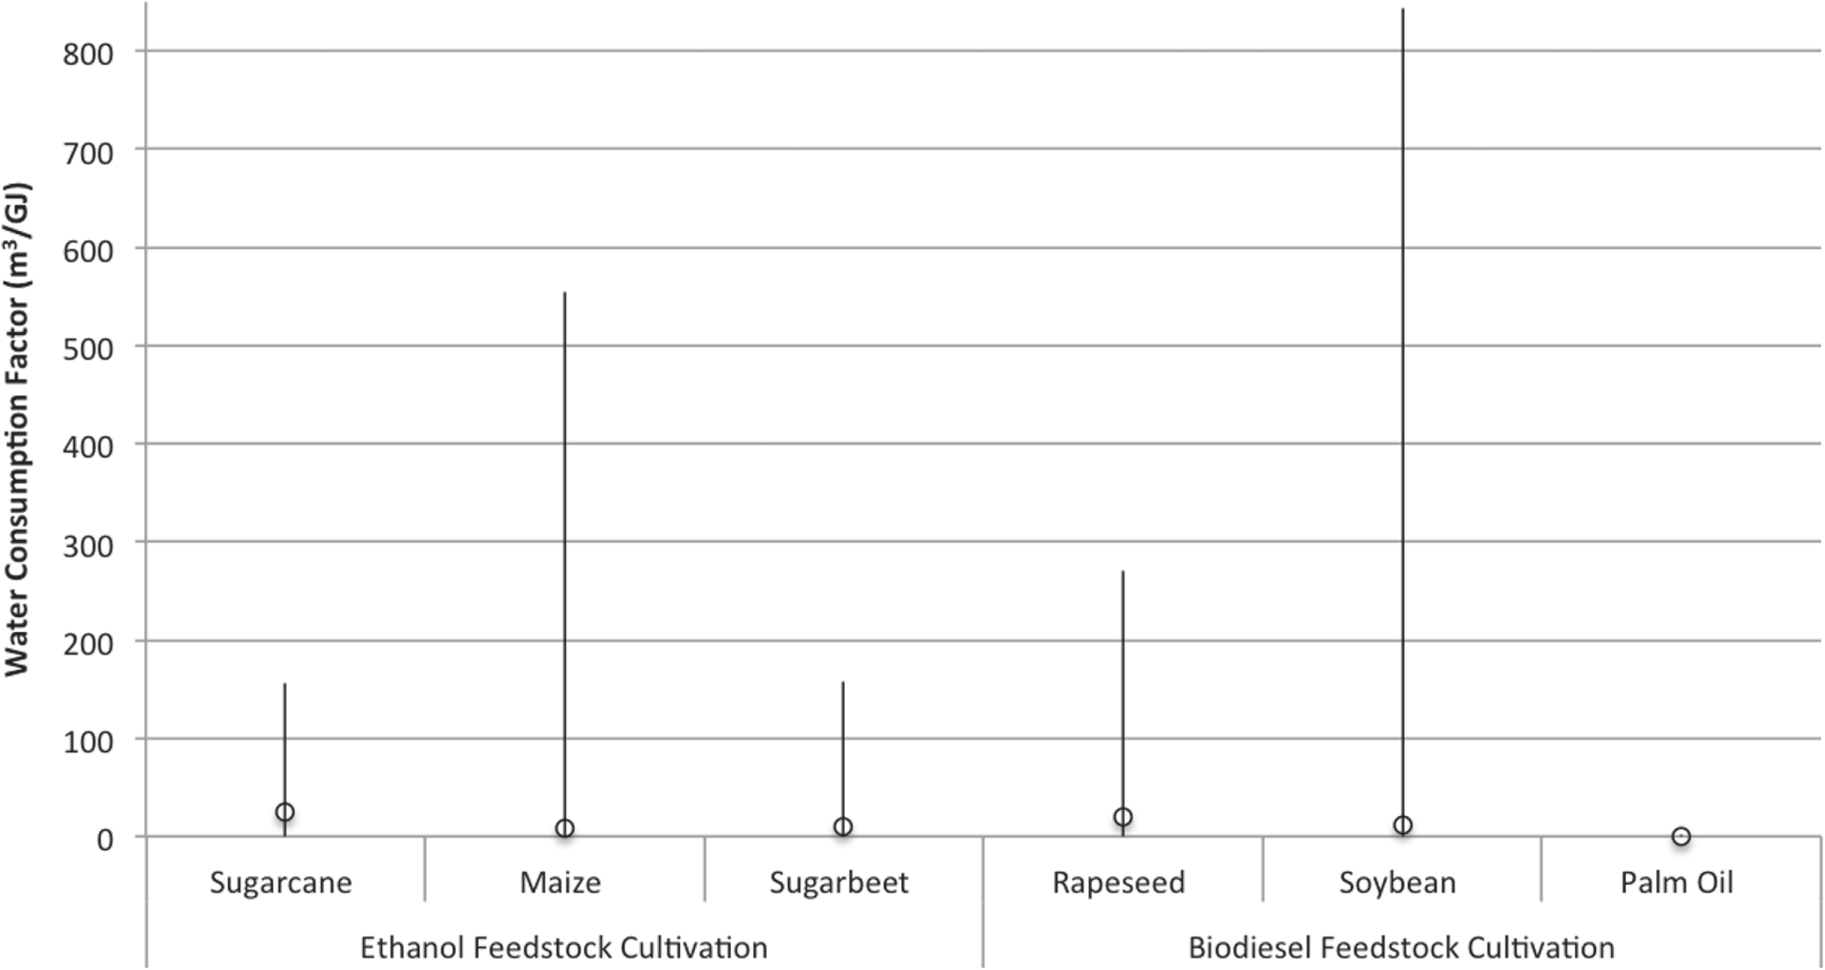
Standard image High-resolution imageA separate figure (figure 2) shows water consumption factors (mean and range), for biofuel feedstock cultivation since these factors are one to two orders of magnitude greater than all other fuel production processes. Further the vast range of water consumption within each biofuel feedstock category is significant, with estimates of zero to represent rain-fed feedstock crop cultivation and maximum values that extend 6x to 80x beyond the value of the median values for each category. Palm oil remains an outlier in this category, where estimated water consumption is assumed to be negligible, since palm oil production does not frequently require direct irrigation.

Figure 2. Consolidated estimates of water consumption factors for biofuel feedstock cultivation.
Download figure:
Standard image High-resolution image2.2. Electricity generation
Calculating the WCEP for electricity generation required a similarly high level of data resolution as for fuel production. Water consumption varies significantly by generation technology, fuel type, and cooling type at the scale of the individual power plant. While water is used for a variety of processes in the production of electricity (e.g., flue gas desulfurization, washing solar panels), the majority of water use is for cooling in thermoelectric power plants. Because of its high specific heat, water is an ideal heat transfer medium for cooling steam after it exits the generator turbine. Some power plants use seawater for cooling or even dry cooling technologies (using air rather than water for heat transfer), but the vast majority of power plants consume freshwater for cooling (Platts 2010).
To consider this level of technological detail in power plants at the international scale required extracting and processing data from the Platts World Electric Power Plants (WEPP) Database (2010). While the WEPP database is relatively comprehensive for generator technology and fuel type, it only contains cooling technology information for roughly 37% of relevant power plants in the database. For power plants with no cooling type specified, the cooling portfolio mix by generator and fuel type exhibited in the rest of the country (or region5 , as necessary) was assumed.
As with nuclear fuel cycle data, the WEPP database provides information on power plant capacity, but not annual production. To convert the installed capacity of the power plants to an estimate of annual electricity production, each technology was assumed to have operated at its capacity factor, as estimated by the National Renewable Energy Laboratory (NREL 2010), also shown in table 2. Converting installed capacity to estimated annual electricity generation is calculated using (2):

Table 2. Electricity generation categories with capacity factors, water consumption factors and data sources.
| Electricity generation categorya | Water consumption factor (m3 GJ−1) | ||||||
|---|---|---|---|---|---|---|---|
| Fuel | Technologyb | Coolingc | Capacity factord | Estimatee | Min | Max | Sourcef |
| Coal | ST | CT | 0.85 | 0.722 | 0.505 | 1.157 | [1] |
| OTF | 0.85 | 0.263 | 0.105 | 0.333 | [1] | ||
| CP | 0.85 | 0.573 | 0.315 | 0.736 | [1] | ||
| AIR | 0.85 | 0.027 | 0.027 | 0.027 | [1]g | ||
| Nuclear | ST | CT | 0.90 | 0.757 | 0.610 | 0.936 | [2] |
| OTF | 0.90 | 0.421 | 0.105 | 0.421 | [2] | ||
| CP | 0.90 | 0.641 | 0.421 | 0.757 | [2] | ||
| Gas/oil | ST | CT | 0.85 | 0.768 | 0.589 | 1.157 | [2] |
| OTF | 0.85 | 0.305 | 0.200 | 0.431 | [2] | ||
| CP | 0.85 | 0.284 | 0.284 | 0.284 | [2] | ||
| AIR | 0.85 | 0.027 | 0.027 | 0.027 | [1]g | ||
| CC | CT | 0.85 | 0.221 | 0.049 | 0.315 | [2] | |
| OTF | 0.85 | 0.105 | 0.021 | 0.242 | [2] | ||
| CP | 0.85 | 0.252 | 0.252 | 0.252 | [2] | ||
| AIR | 0.85 | 0.004 | 0.004 | 0.126 | [2] | ||
| GT | NA | 0.85 | 0.053 | 0.053 | 0.358 | [2] | |
| Biomass | ST | CT | 0.68 | 0.581 | 0.505 | 1.015 | [1] |
| OTF | 0.68 | 0.315 | 0.315 | 0.315 | [1] | ||
| AIR | 0.68 | 0.027 | 0.027 | 0.027 | [1]g | ||
| Waste heat | ST | CT | 0.68h | 0.581 | 0.505 | 1.015 | [1]i |
| OTF | 0.68h | 0.315 | 0.315 | 0.315 | [1]i | ||
| CP | 0.68h | 0.641 | 0.421 | 0.757 | [2]j | ||
| AIR | 0.68h | 0.027 | 0.027 | 0.027 | [1]g | ||
| Geothermal | ST | CT | 0.84 | 0.736 | 0.736 | 0.736 | [2] |
| OTF | 0.84 | 0.315 | 0.315 | 0.315 | [1]i | ||
| CP | 0.84 | 0.410 | 0.315 | 0.505 | [1]i | ||
| AIR | 0.84 | 0.305 | 0.284 | 0.662 | [2] | ||
| Solar | ST | CT | 0.32 | 0.852 | 0.778 | 0.904 | [2] |
| AIR | 0.32 | 0.027 | 0.027 | 0.027 | [2] | ||
| PV | NA | 0.20 | 0.006 | 0.001 | 0.027 | [2] | |
| Wind | NA | NA | 0.39 | 0.000 | 0.000 | 0.001 | [2] |
aAll data for global electricity production comes from two sources: Platts (2010) and EIA (2011). bElectricity generation technology types: ST = steam turbine; CC = combined cycle; GT = gas turbine; PV = photovoltaic; NA = not applicable. cThermoelectric cooling technologies: CT = cooling tower; OTF = once-through freshwater; CP = cooling pond; AIR = dry cooling. dNREL (2010). eAll water consumption factor estimates are for the median values, which is consistent with estimates in the literature. fSources for water consumption factor estimates [1]: Macknick et al (2011) [2]; Meldrum et al (2013). gInferred from the Macknick et al (2011) estimate of Solar ST-AIR because it was the only steam turbine-linked estimate of dry cooling water consumption. hThe NREL (2010) study did not provide a capacity factor estimate for waste-heat-based steam turbine generators, so the relatively conservative estimate for biofuel-based power plants was applied. iInferred from the Macknick et al (2011) estimate of Biomass ST-CT and ST-OTF because it was assumed that waste heat and geothermal were both lower grade fuel sources, like biomass relative to coal, gas and nuclear. jInferred from the Meldrum et al (2013) estimate of Nuclear ST-CP as the least water-efficient comparable ST-CP technology.
To cross-validate the power generation amounts for each power plant technology calculated from the WEPP database capacity data, the total energy generation portfolio was normalized to national electricity production data from the EIA for 2008 (EIA 2011). In this way, we could use the higher resolution data from the WEPP database to determine the relative significance of each sub-technology within each national-level power plant portfolio, while improving the accuracy of comparisons between countries by ensuring total generation quanitities were in line with international data sources. Equation 2 summarizes this normalization where the annual electricity generation for each technology type (i) is equal to the WEPP generation calculation for that technology multiplied by the ratio of EIA total generation over WEPP total generation.

Figure 3 consolidates the water consumption factors for electricity-generating technologies by fuel source, generation technology, and cooling type (where applicable). For thermoelectric production systems, evaporative cooling towers (CTs) show significantly higher consumption than once-through cooling (OTC) systems and cooling ponds (CP). As an aside, even though OTC systems consume less water, they withdraw between 20 to 50 times more water than CT systems (Meldrum et al 2013). While the bulk of this water is returned to the original waterway (albeit with an associated thermal pollution load), this high withdrawal demand leaves the power plant considerably vulnerable in times of regional water shortages (NETL 2009).

Figure 3. Consolidated estimates of water consumption factors for electricity generation. Notes: electricity generation technology types: ST = steam turbine; CC = combined cycle; GT = gas turbine; PV = photovoltaic; NA = not applicable. Thermoelectric cooling technologies: CT = cooling tower; OTF = once-through freshwater; CP = cooling pond; AIR = dry cooling.
Download figure:
Standard image High-resolution imageWhile dry cooling systems (Dry) look like a great technology option in terms of reducing water consumption, they carry an efficiency penalty of about 2% (DOE 2006) for the power plant, thereby reducing the electricity output per unit fuel input. In other words, dry cooling leads to both an economic penalty (higher capital costs and higher operating costs from reduced production per unit fuel), as well as increased carbon emissions per unit energy produced for fossil fuel-based plants (DOE 2006).
In contrast to other electricity technologies, solar photovoltaic (PV) and wind power production consume only marginal quantities of water, mostly associated with the occasional requirement to wash PV panels and wind turbine blades (Meldrum et al 2013).
2.3. WCEP calculation
Once the data for energy production by each energy category (i) was consolidated on a country-by-country basis, the water consumption factors could be used to calculate the WCEP values by using equation (3).

WCEP estimates for each energy category were then summed to get an estimate of total water consumption for each country in the study's entire energy production portfolio.
While the final calculation of WCEP is straightforward, limitations in the source data affect the accuracy of WCEP estimates. While some of the data limitations were discussed in the previous sections, some key challenges merit review, among them: overly aggregated and incomplete energy data, difficulties in tracking international energy processing cycles, inconsistency in definitions of water use and energy processes, and unavailability of regionally appropriate water consumption estimates.
Current international energy data do not provide sufficient resolution for highly accurate water consumption calculations. For example, the EIA provides detailed information on the total oil produced in the country and the number of refined petroleum products produced, but includes no information on the oil's extraction in terms of primary production, secondary recovery, or enhanced oil recovery (EIA 2011). Additional gaps exist between data sets that provide actual energy production quantities and others that list overall production capacity (e.g. providing nominal capacity of power plants rather than actual annual electricity production).
Raw materials are commonly extracted, processed, and consumed across national borders. Calculating a national WCEP requires knowing where these processing steps are taking place for each resource. While this information is readily available for nuclear fuel processing, it is more difficult to segregate processing steps for current global biofuel production.
Consistently differentiating 'water use' estimates in terms of water consumption rather than water withdrawals is essential. However, these different definitions of water use are unevenly delineated in the literature. Also, modes of water consumption associated directly with energy production (e.g., CTs) as opposed to consumption for auxiliary purposes at the facilities should be clearly defined.
The global scope of this study necessitated WCEP at the national level, but developing estimates of WCEP into more granular regional estimates would provide additional insights into the consumption of water for energy, especially for the very large countries. Results at a finer geographical resolution would allow for an improved assessment of water impacts at relevant sub-national geographic scales, such as regional watersheds. This approach would require improved data on the specific location of energy production operations (mining, biofuel crop cultivation, fuel processing, and electricity generation), which are not yet broadly available.
Further refinement in determining the regional water impact of energy processes would involve improved data on source water quality. Using high-quality surface water has different implications than using impaired or brackish water. For example, water flooding is a water-intensive technique used to enhance production of older oil reservoirs, but most of the time, produced water from the oil field itself (often a low-quality water) is used for this purpose rather than freshwater from a more competitive source (Wu et al 2009). Understanding the deployment (location and scale) of similar water reuse and recycling opportunities for energy systems would enhance our ability to classify the broader watershed impacts of WCEP as well as highlight potential opportunities for the transfer of innovative technologies from one region to another.
Similarly, applying universal water consumption factors obscures regional variation in WCEP. Water consumption per unit energy depends not just on the technologies employed, but also on local conditions. For example, quality of local source water, specific attributes of process equipment (e.g. age, efficiency), and regional climate conditions can impact the amount of water consumed to cool thermoelectric power plants (Yang and Dziegielewski 2007). Currently, most coefficients applied in the literature are highly US-centric, so developing a more robust portfolio of water consumption estimates derived from direct regional measurements would contribute significantly to this field of study.
Despite these data limitations, we believe there is great value in synthesizing the best available water consumption estimates with widely available energy production data to provide this preliminary view of WCEP at the global scale. It is hoped that these results will further engage the research community and engender ongoing efforts to collect and share better data, and ultimately, produce more refined and higher resolution estimation of international WCEP values over time.
3. Results and discussion
This paper provides a global perspective of WCEP at the national level for 158 countries. As discussed in the methodology section, international energy data were consolidated from multiple sources to define the composition and scale of energy production portfolios.
The graphical representations for consolidating the results in this section are ranked bar charts for the top 25 countries with the highest values for the related indicator. Since nearly all the rankings drop precipitously in value at some point within the top 25 countries, it was considered sufficient to focus on the highest-ranked countries in terms of the various water consumption metrics. However, results for all individual countries are available in map form as well as listed in table format in the SI section. As a final layer of analysis, the WCEP results are compared to existing energy-based water use studies.
3.1. Water consumption: total energy production
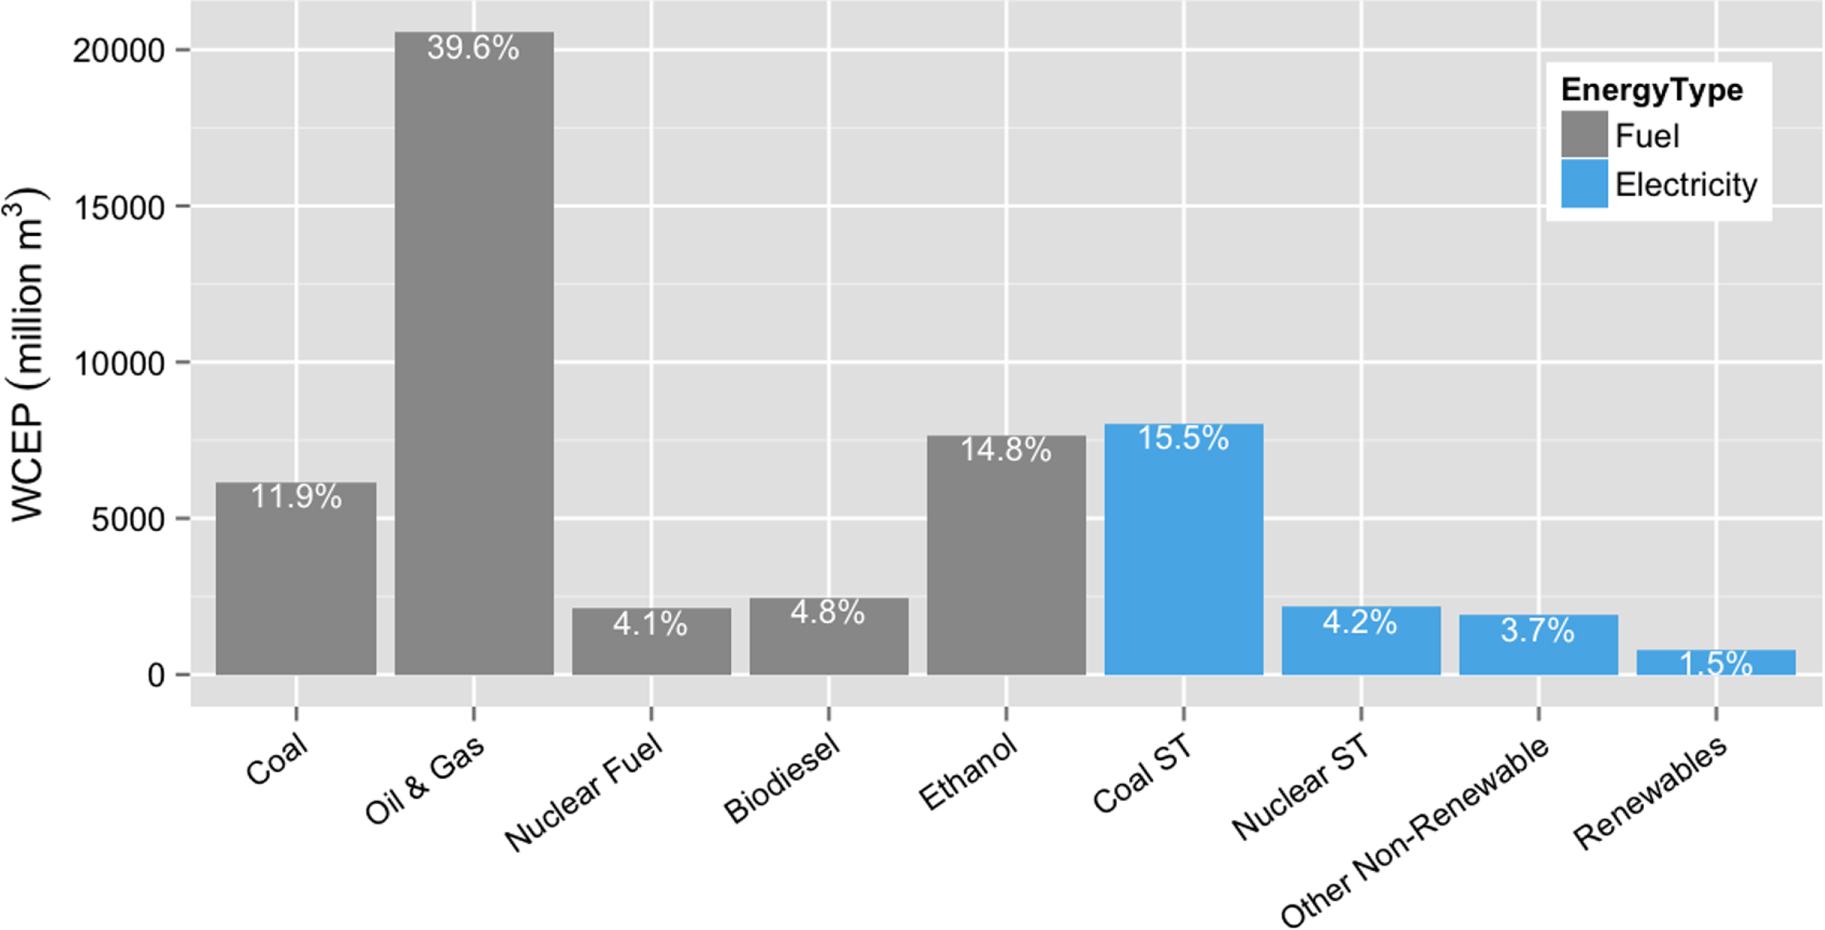
The global WCEP was estimated at approximately 52 billion cubic meters of fresh water. Of this global WCEP volume, oil and gas production has the highest proportional WCEP (40%) relative to the additional energy categories of coal, nuclear fuel, biodiesel, ethanol, coal-based electricity (steam turbine, ST), nuclear ST electricity, other non-renewable electricity (oil ST, gas ST, combined cycle, and gas turbine), and renewable electricity (biomass ST, waste heat ST, geothermal ST, solar ST, solar PV, and wind), as shown in figure 4 below. As described above, this estimate does not assign any water consumption to the production of hydropower.

Figure 4. Total global WCEP by major energy category, 2008.
Download figure:
Standard image High-resolution imageOil and gas WCEP demonstrates the greatest share of global WCEP, representing more than all (non-hydro) electricity generation combined. It is also worth noting that the amount of water consumed at the global scale for ethanol production is roughly equivalent to global water consumption for coal-fired power plants, even though global ethanol production represents approximately 1/100th the energy content of global coal-fired electricity production. Finally, in terms of renewable energy, the total WCEP for all renewable electricity production is roughly 1/10th the total WCEP for biofuel production. Hence, while renewable electricity may represent opportunities for reducing both water consumption and carbon emissions, the water impact of biofuels requires important consideration as the world's regions seek to transition to lower-carbon energy portfolios.
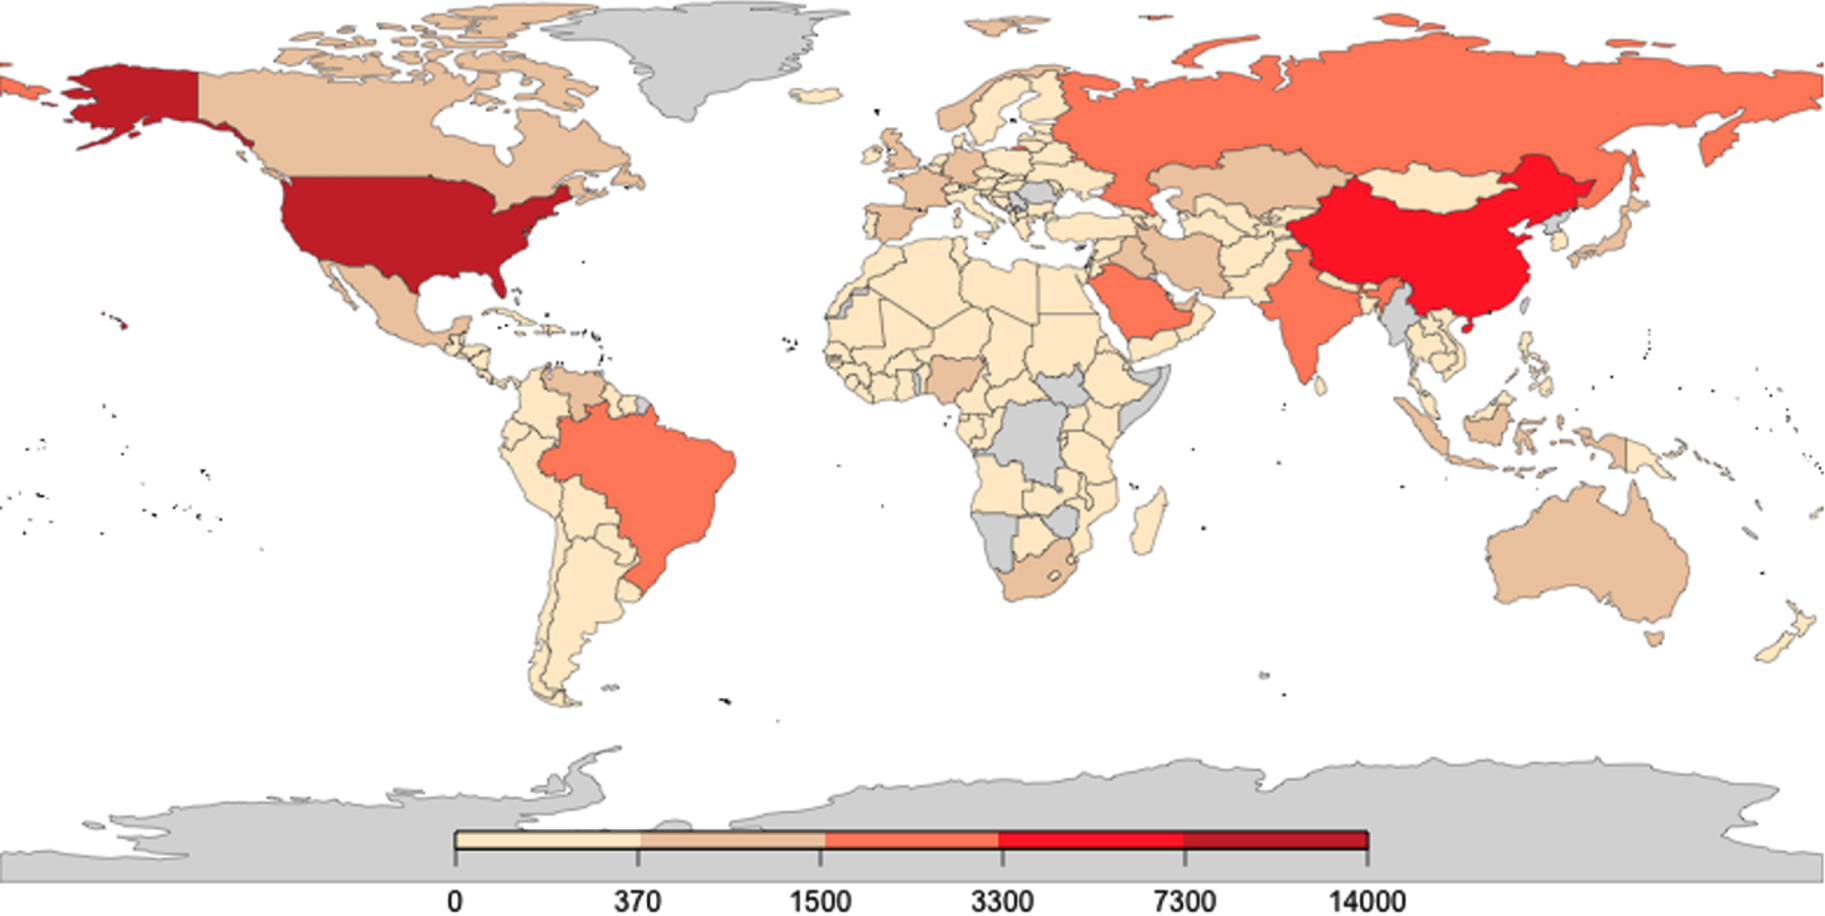
In terms of country-by-country WCEP estimates, map 1 provides a global overview. Total energy WCEP is dominated by the United States and the BRIC (Brazil, Russia, India, and China) countries, which reflects the influence of the physical and economic scale of these large countries. Saudi Arabia, Canada, Germany, France, and Iran round out the top ten WCEP countries.

Map 1. Total water consumption for energy production (WCEP) 2008.
Download figure:
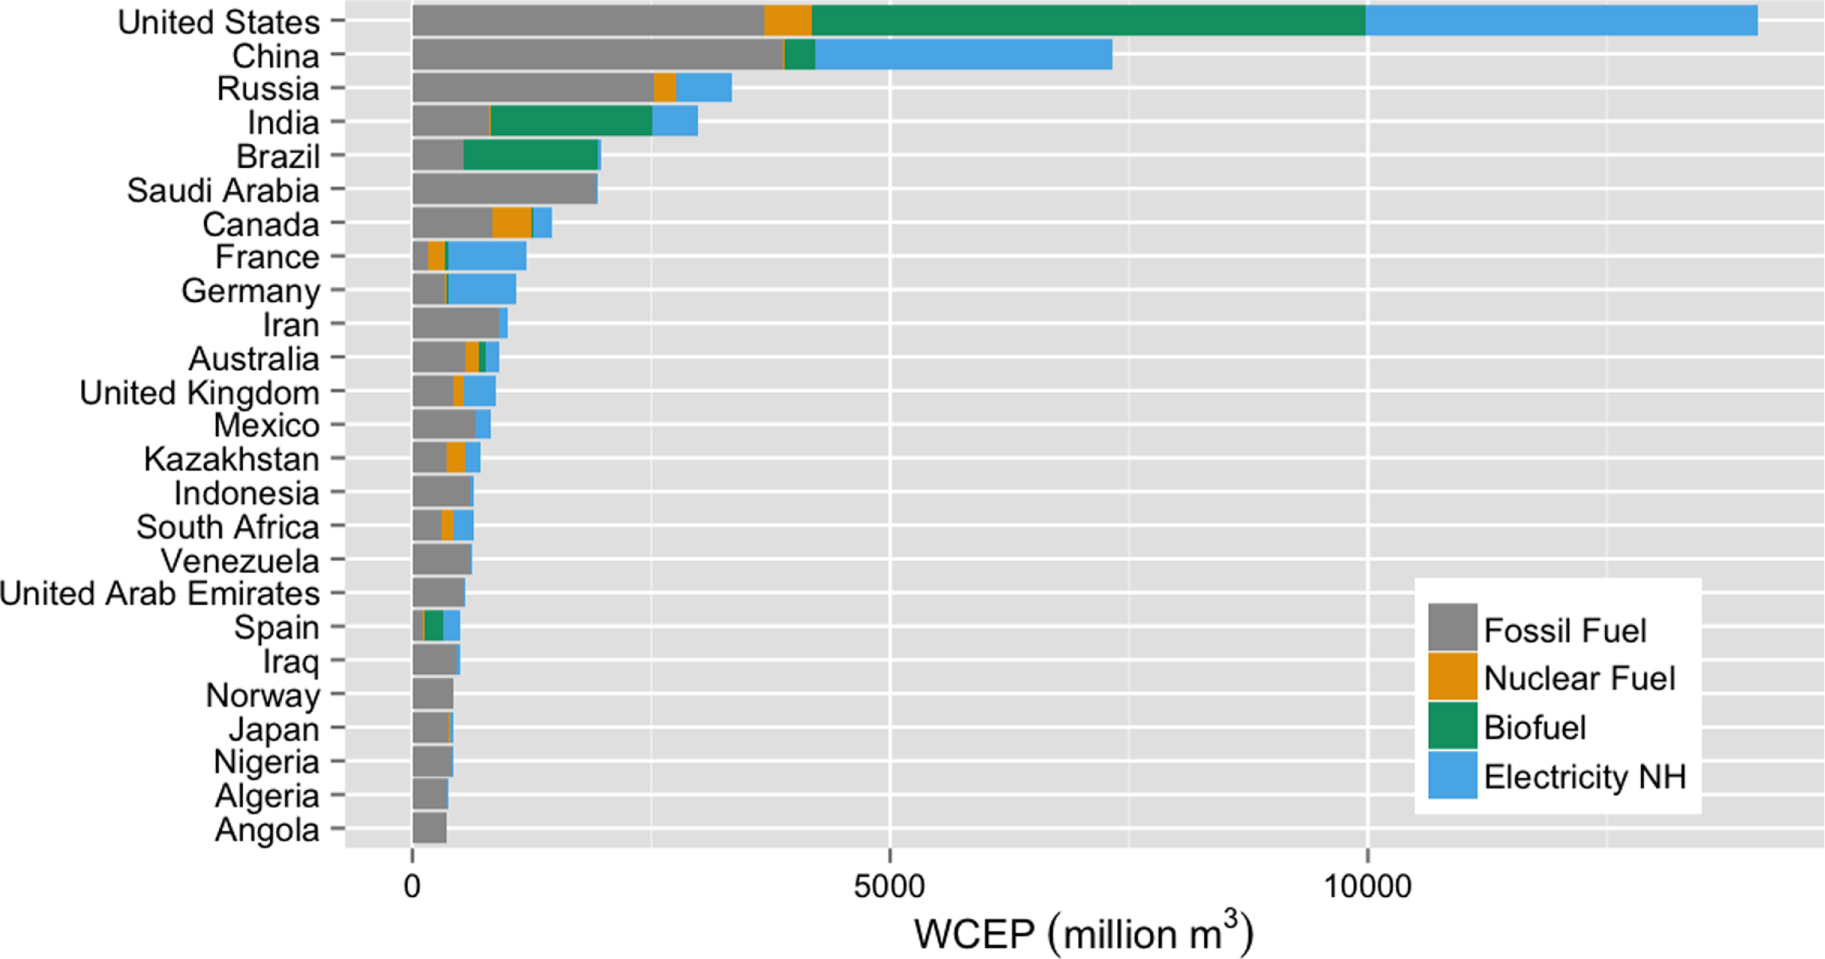
Standard image High-resolution imageDisaggregating WCEP by energy subcategory (figure 5) shows fossil fuels consuming significant proportions of water in most countries (less so for India, Brazil, Germany, and France within the top ten.) Nuclear fuel production plays a minimal role overall, with the United States and Canada having the highest nuclear fuel WCEP values. Biofuel WCEP is significant in the United States, India, and Brazil. Meanwhile, the United States and China consume by far the most water for electric power generation.

Figure 5. Total WCEP by energy category, 2008.
Download figure:
Standard image High-resolution image3.2. Fossil fuel WCEP
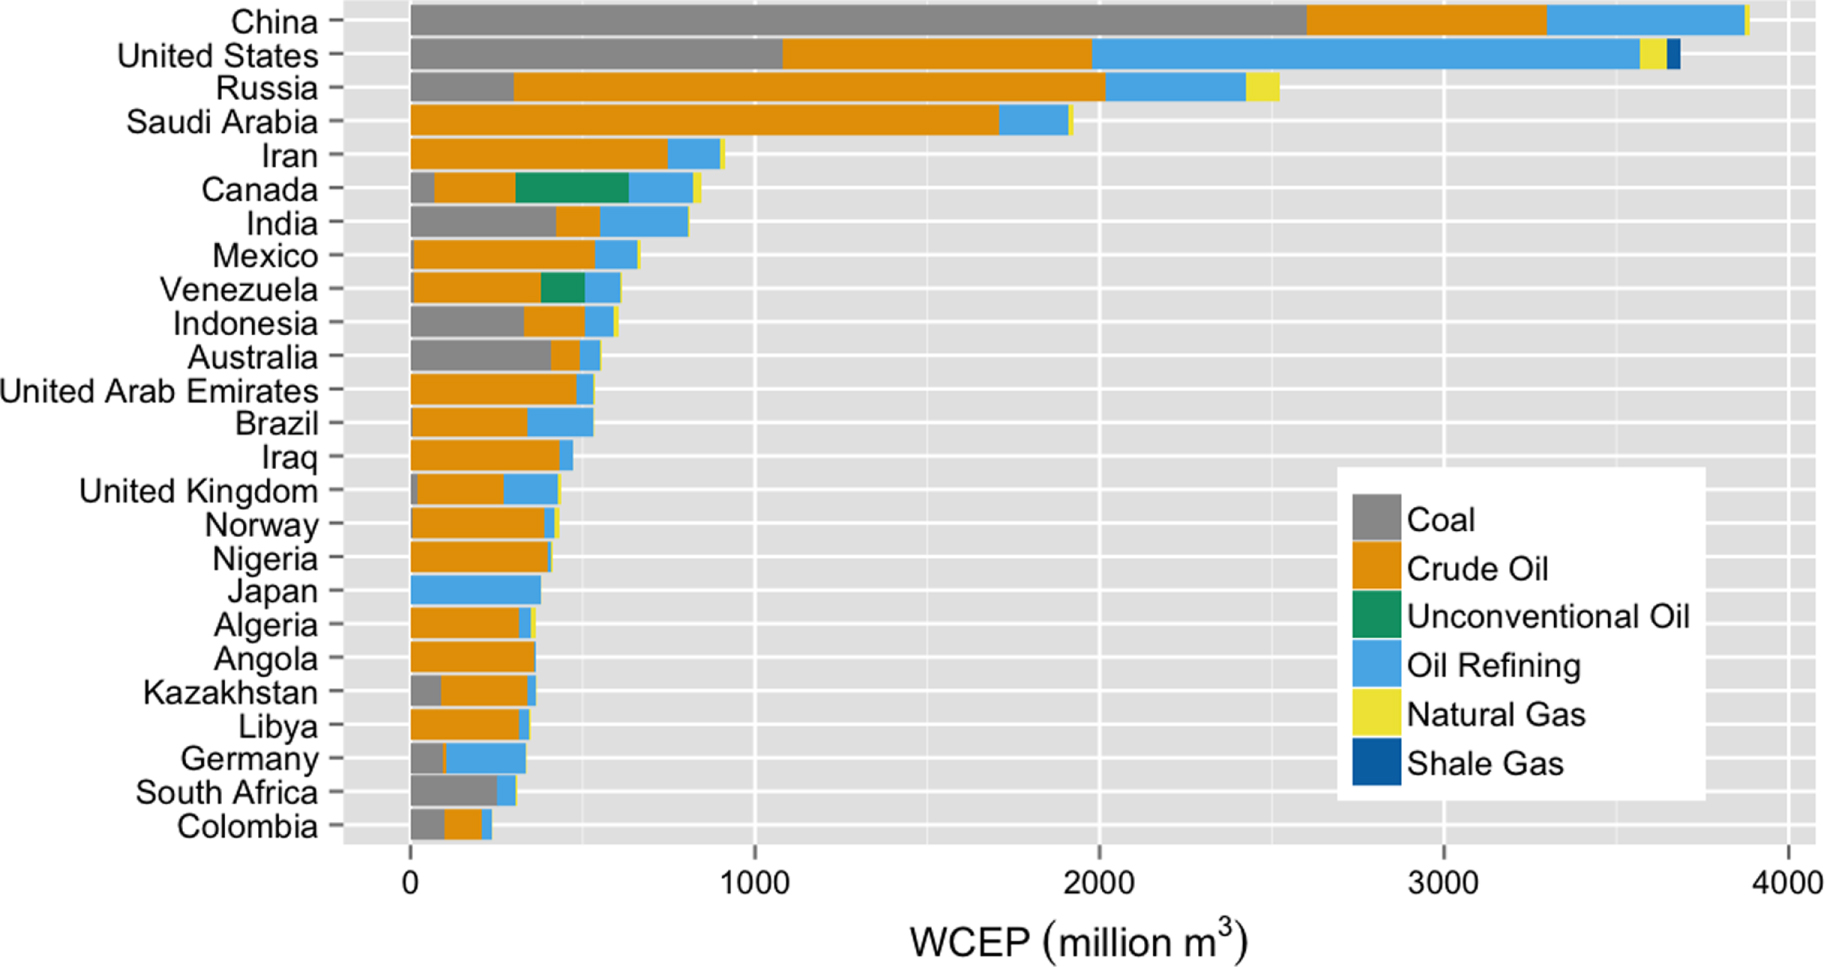
Global fossil fuel WCEP was estimated at 26 727 million m3. National level estimates of fossil fuel WCEP by sub-category are provided in figure 6 (for the top 25 countries). The results show that total consumption of water for fossil fuel production is dominated by countries that are large in physical size and population (BRIC countries: Russia, China, Brazil, and India), economically productive (Organisation for Economic Co-operation and Development [OECD] countries: United States, Canada, Mexico, Norway, and the United Kingdom, among others) and major petroleum producers (Organization of the Petroleum Exporting Countries [OPEC] countries: Saudi Arabia, Iran, Venezuela, the United Arab Emirates, Iraq, among others).

Figure 6. WCEP for fossil fuel extraction and processing, 2008.
Download figure:
Standard image High-resolution imageThe production and refining of crude oil dominates the portfolio of every country in the ranking, except for China, India, and Indonesia, and Australia, where coal production consumes the most water. Several countries with no significant indigenous oil resources, such as Japan, Germany, South Korea, and Italy, nonetheless have refineries, with attendant water impacts. Natural gas barely contributes to the overall fossil fuel WCEP within any country, though it shows up in the greatest magnitude in the United States and Russia.
While the analysis does include unconventional fossil fuel production (oil sands, heavy oil, shale oil, and shale gas), the commercial production of these fuels was only taking place in a few countries in 2008. Hence, the overall scale of unconventional fossil fuel WCEP is not significant at the global scale. WCEP for shale oil contributes noticeably to the fossil portfolio in Canada, while heavy oil contributes to the WCEP in Venezuela. Further, while WCEP for shale gas production visibly contributes to the overall portfolio within this 2008 data set, it is likely this technology is contributing to a much greater portion of the United States WCEP given the recent years of growth in the use of this technology (EIA 2014).
3.3. Nuclear fuel WCEP
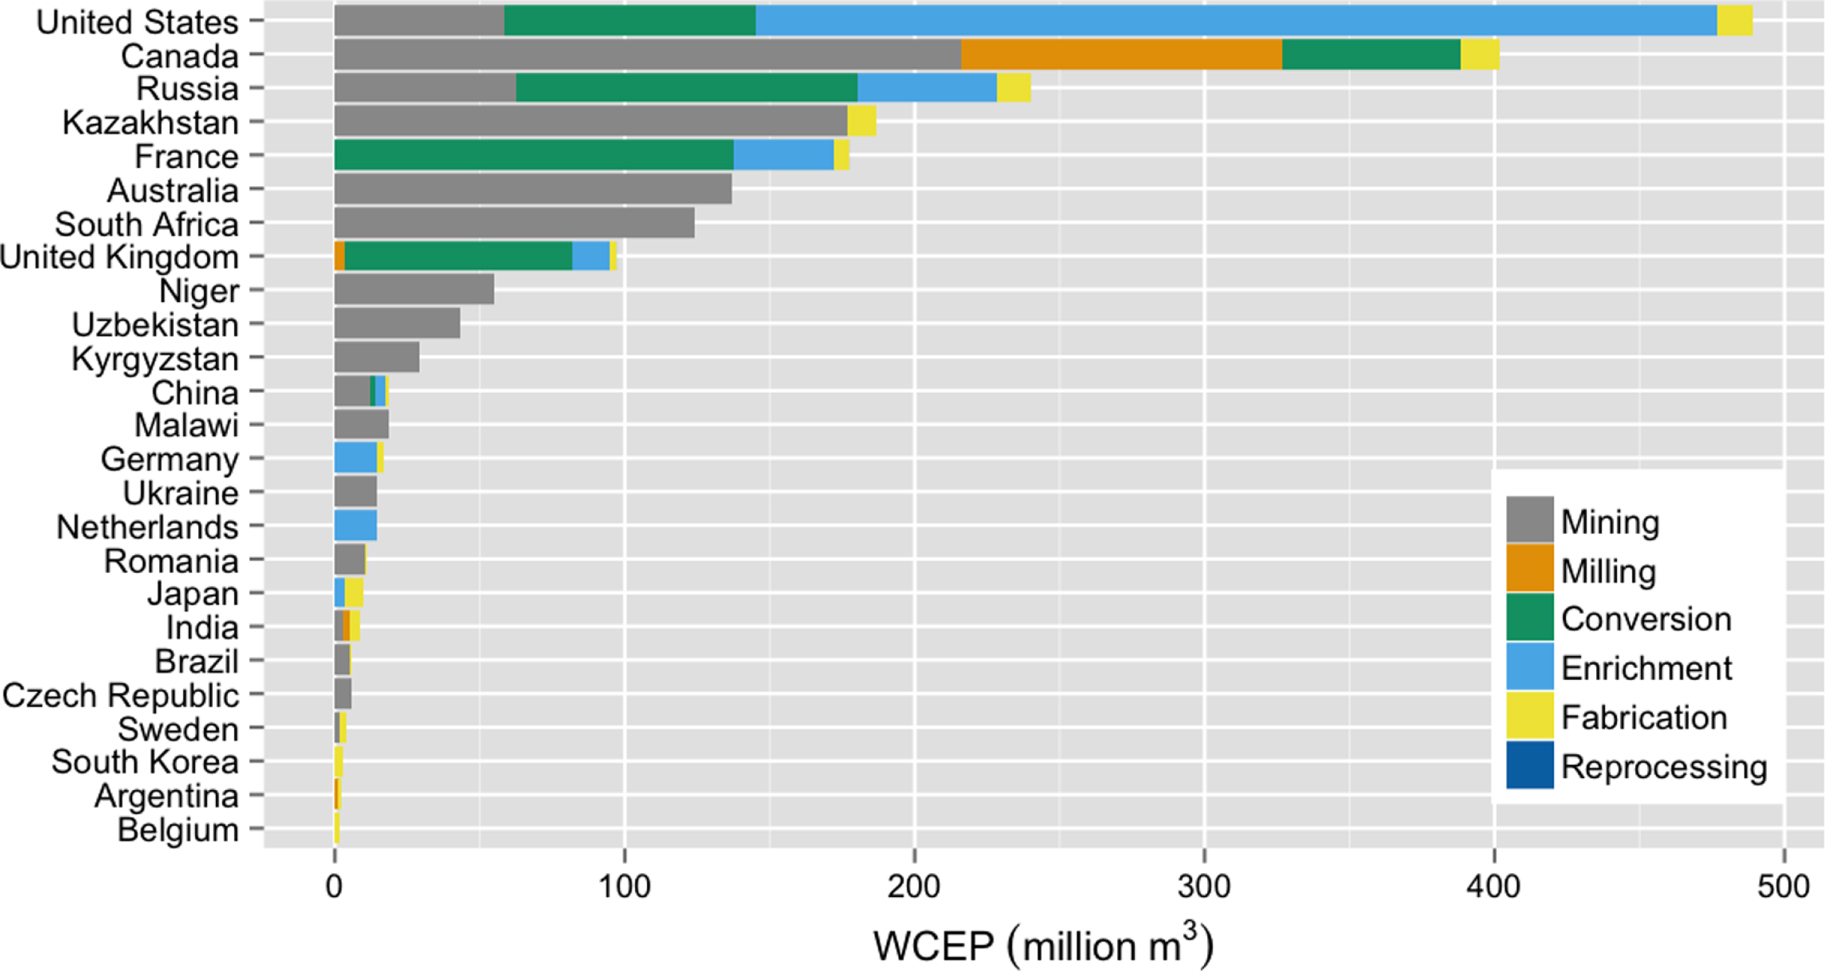
The scale of nuclear fuel production at the global level is significantly more limited than fossil fuel production in terms of both available uranium deposits as well as nuclear fuel production. Consequently, the total consumption of water for nuclear fuel production worldwide (2117 million m3) is a full order of magnitude less than that for fossil fuels (26 727 million m3). Water consumption coefficients were applied to each stage of the nuclear fuel cycle, including uranium ore mining and processing, milling, conversion, enrichment, fabrication, and reprocessing to produce the results shown in figure 7.

Figure 7. WCEP for nuclear fuel extraction and processing, 2008.
Download figure:
Standard image High-resolution imageMany top nuclear fuel producers process the fuel at multiple stages of the nuclear fuel cycle (Canada, United States, Russia, France, and the UK), but the operations of some countries (Kazakhstan, Australia, South Africa, Niger, Uzbekistan, and Kyrgyzstan) are more limited to ore mining and processing. The United States uses the most water for nuclear fuel WCEP, specifically for the relatively more water intensive process of diffusion enrichment (IAEA 2011). Meanwhile, Canada, with the second largest nuclear fuel WCEP, uses significantly more water for uranium milling than any other country, yet hardly uses any water for enrichment. This highlights the role of trade in balancing the cycle of uranium production across multiple countries and, therefore, the differentiated water consumption impacts across these participating countries.
3.4. Biofuel WCEP
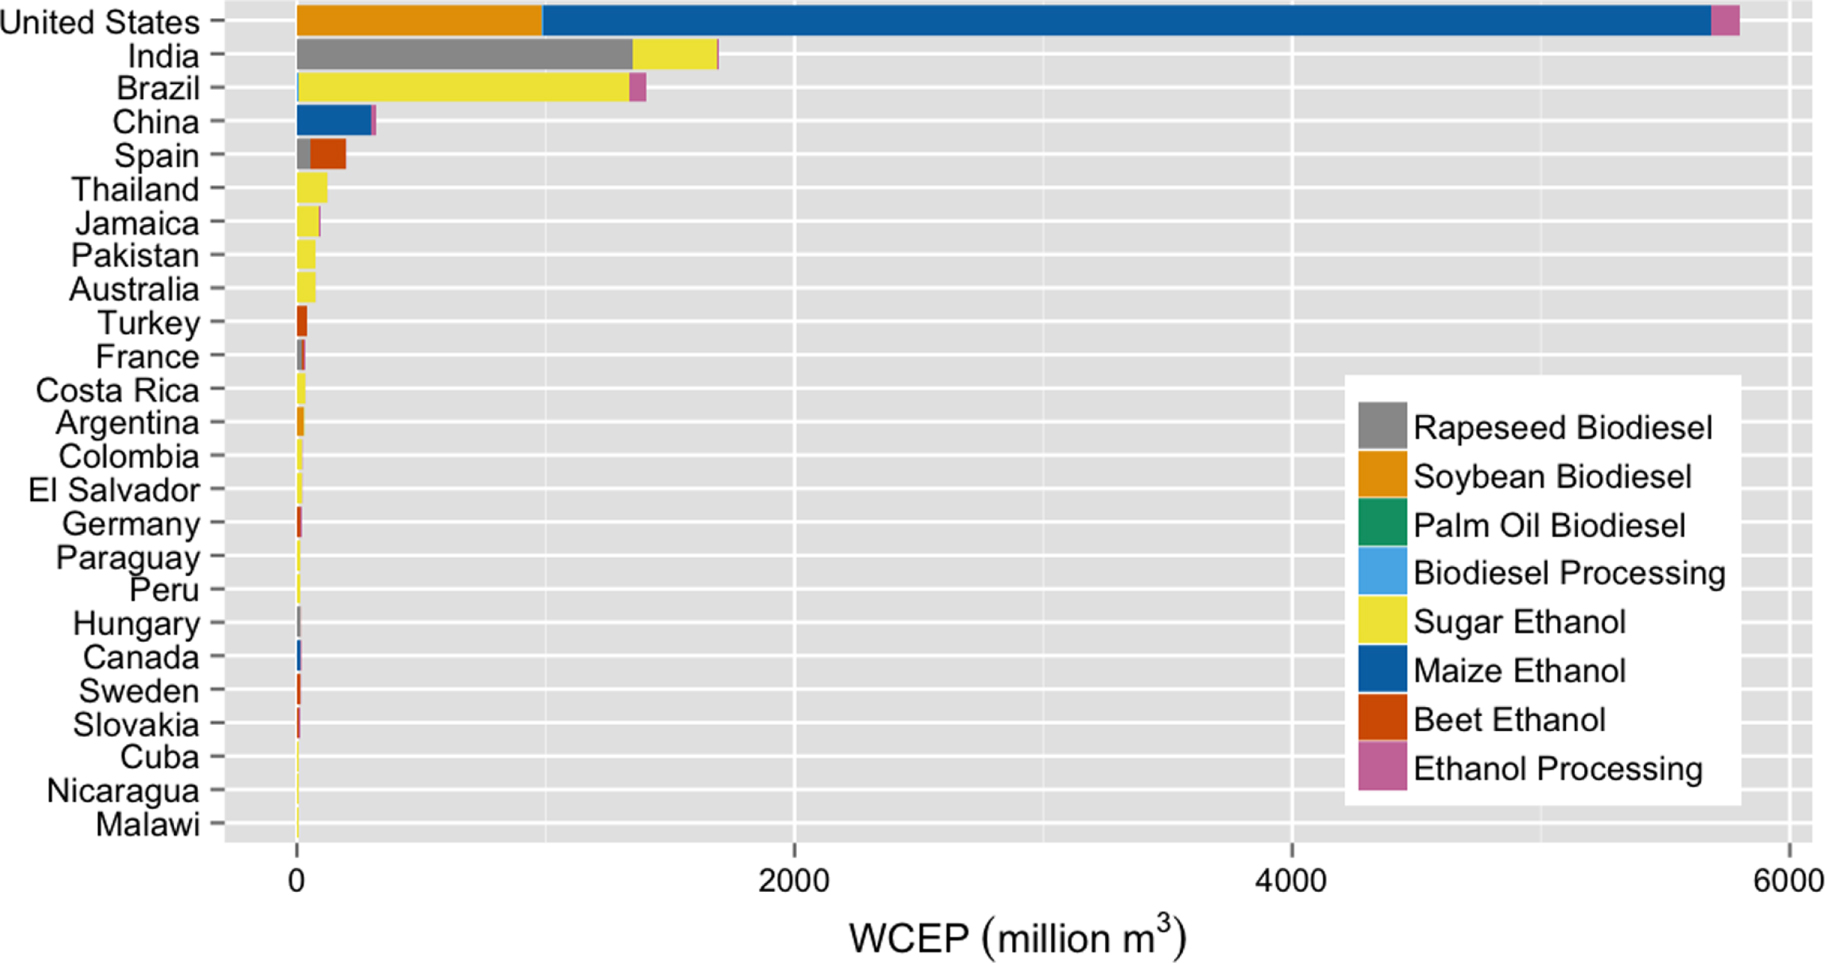
Global biofuel WCEP was estimated as approximately 10 119 million m3 (with roughly 25% of biofuel WCEP for biodiesel and 75% for ethanol). Figure 8 shows that the United States, India, Brazil, and China have the highest aggregate levels of water consumption for biofuel cultivation and processing. The United States leads all other countries in water consumption for biofuels, consuming vast amounts of irrigation water to produce maize-based ethanol. Significantly, the top five water-consuming countries for biofuels have quite different biofuel feedstock portfolios. India mostly uses rapeseed to produce biodiesel; Brazil relies heavily on sugarcane to produce ethanol; China, like the United States, produces mostly maize-based ethanol; and Spain consumes water mostly for sugarbeet ethanol and rapeseed biodiesel. The remaining countries are mostly warmer climate countries producing limited quantities of sugarcane ethanol, or EU countries experimenting with rapeseed biodiesel or sugarbeet ethanol.

Figure 8. WCEP for biofuel cultivation and processing, 2008.
Download figure:
Standard image High-resolution imageAs discussed in the methodology section, the international data were limited, and could not provide a detailed composition of feedstock crops for biofuels. Hence, an improved database of biofuel production by feedstock would be highly valuable to future water–energy research, especially since the cultivation of biofuel feedstocks is by far the most water-intensive energy production pathway. Further, advancements in second-generation biofuels that rely on crop residues and/or cellulosic feedstocks have the potential to change the biofuel WCEP equation significantly and should be incorporated in future research as they become more prevalent. In sum, while biofuels remain a potentially important low-carbon alternative to fossil fuels, better data should be made available to track the water impacts of these resources, and further development of biofuels should be managed carefully within the context of regional water management.
3.5. Electricity WCEP
WCEP for electricity generation at the global scale represents about 12 895 million m3 of water. Water consumption for electricity includes the most diverse portfolio of technology options (31 combinations of fuel, generator type, and cooling type) for producing energy (see table 2). To aid the visualization of electricity WCEP rankings (figure 9), these multiple sub-categories were aggregated into eight major categories, including: coal-based steam turbine (ST), gas- and oil-powered ST, nuclear ST, biomass and waste heat ST, geothermal ST, solar ST, combined cycle, and gas turbine. Wind and solar PV were not included in the graphic because their WCEP are so low relative to the other technologies that they do not appear at this scale of presentation, but the country-by-country WCEP values for these technologies are provided in table SI-2.

Figure 9. WCEP for electricity generation (non-hydro), 2008.
Download figure:
Standard image High-resolution imageThe United States and China are the largest water consumers in this energy category, with these two countries accounting for approximately 56% of total global water consumption for electricity production. Both countries depend mostly on coal-based power plants, and as a result, water consumption for coal power plants represents 59% of total electricity WCEP in the United States and 98% in China. France and Germany follow next with high levels of water consumption, with significant consumption for both countries coming from nuclear electricity (87% and 36%, respectively).
Across the remaining countries, the composition of electricity generation technologies varies significantly based on the different electricity portfolios. Coal is a consistent contributor to electricity WCEP across the top 15 countries, except where significantly displaced by nuclear power (France, Germany, Russia, Canada, and Spain). Gas- and oil-based steam turbines play a more prominent role in the lower ranked countries (Romania, Netherlands, Iran, and Egypt). Geothermal provides a significant contribution only within the United States and Mexico, while other renewable resources play only a minimal role in scale (biomass, waste heat, and solar thermal) of water impact.
3.6. Comparing WCEP results to existing studies
Given the scale of the global WCEP analysis and the heterogeneity of the data sets that informed the analysis, comparing the estimates to related studies is useful for benchmarking the WCEP results. Unfortunately, the vast majority of these estimates are for the United States (Gleick 1994, DOE 2006, USGS 2009, Elcock 2010), so it is difficult to compare the numbers from this study to international figures. Nevertheless, figure 10 compares the WCEP estimates from this study (red values) to a number of other estimates from related literature (blue values.) All estimates relate to the United States across a range of years as identified in the x-axis values.

Figure 10. Comparing WCEP results to existing estimates of water consumption for energy. Notes [1]: (Elcock 2010) [2] (DOE 2006) [3] (USGS 2009) [4] (Orcutt 2011) [*] author's results.
Download figure:
Standard image High-resolution image
The results provided in figure 10 show that the estimates from this study correlate well to the estimates from the literature, and if anything, tend to be lightly lower than estimates from other studies. The conservative trend in the WCEP values of this research in comparison to the other papers is likely a result of using more recent water consumption factors in this study (Wu et al 2009, Mielke et al 2010, Mekonnen and Hoekstra 2010, Macknick et al 2011, Meldrum et al 2013) as compared to the other studies. The latest estimates of water consumption by technology tend to be lower than the earlier estimates provided by Gleick (1994) that are applied in many other studies (DOE 2006, Elcock 2010). Many of the energy technologies assessed by Gleick have become more water-efficient, so newer numbers would suggest less water consumption per unit energy.
The one exception is coal, where the WCEP estimate is significantly higher (roughly four times higher than the average estimate by DOE (2006). However, as we saw in figure 1, estimates of water consumption for coal mining and processing fall across a wide range and the values selected for the DOE study (0.004–0.024 m3 GJ−1) fall far below the median value selected for this study (Meldrum 2013). Further, the DOE estimate was for EIA data for 2003, and the data for this study were for 2008 (over which time coal production increased by 9.3%, EIA 2011).
In sum, while there is a lack of detailed estimates from around the world for testing the methodology and results of this global WCEP assessment, the estimates match well to existing studies of water consumption across multiple energy categories in the United States.
4. Conclusion
The purpose of this research was to estimate water consumption by national-level energy production portfolios from a global perspective. By synthesizing existing estimates of water consumption for specific energy technologies with detailed data on national energy technology portfolios, this study provides a new global perspective on the water impacts of energy systems. This empirical approach included calculating WCEP by individual energy technologies as well as for complete national energy portfolios for 158 countries. At the global scale, we determined that the processes and technologies that produce energy consume approximately 52 billion cubic meters of water on an annual basis.
Since this study estimated absolute consumption of water by energy portfolios, many of the largest countries (in terms of both physical and economic size) consistently ranked highly in the WCEP results, as would be expected. However, some smaller countries that are biased toward particular energy categories were highlighted as consuming large amounts of water as well, e.g., many of the Middle Eastern nations in relation to fossil fuel production and processing. The results from this study allow for endless permutations of comparisons across technologies, countries and regions, and to encourage these efforts by other researchers the full WCEP results for each energy category are provided in the SI section.
One clear opportunity for advancing this work is the collection and dissemination of higher-quality data. The currently available data for assessing the global water consumption of energy systems vary in both quality and accessibility. Higher-resolution data on energy technologies and the local context of operation will lead to more accurate results. Improving the quality of the metrics would be highly relevant for regional policy making as well as for designing more comprehensive assessments, including grid-based spatial mapping of WCEP values, time series trends of WCEP estimates, inclusion of source water-quality data, and estimating the potential for water reuse technologies, among other potential projects.
While improving the data is certainly an important suggested follow-up to this work, it represents a longer-term goal in the water-energy field. In the meantime, this study makes a foundational contribution by establishing a consistent indicator and an initial global baseline estimate of WCEP that can continue to be refined with improved data applied to future studies. The existing results from this investigation provide a high-level view of the consumption of water for energy at the macro-scale, and it is hoped that these results will serve as a reference for decision-makers and future researchers interested in understanding and expanding the field of water consumption by energy systems at the global scale.
Footnotes
- 5
Regional aggregation in the WEPP database as follows: Africa; Australia, New Zealand, & Oceania; Asia; Commonwealth of Independent States (CIS); Europe; Latin America; Middle East, and North America.