
Abstract
The use of reflective surfaces offers one low-cost solution for reducing solar loading to urban environments and the Earth that should be considered as part of sustainable urban design. Here, we characterize the radiative benefits, i.e. the additional shortwave radiation leaving the atmosphere, from the installation of highly reflective 'cool' roofs in urban areas in India that face relatively large local aerosol burdens. We use a previously tested column radiative transfer model to estimate the energy per unit area reflected to space from increasing the surface albedo at six cities within India. The model is used to characterize radiative transfer each day over five years (2008–2012) based on mid-day satellite retrievals of MODIS aerosol depth, cloud water path, and average surface albedo and MERRA atmospheric profiles of temperature and composition. Compared against ten months of field observations in two cities, the model derived incoming surface shortwave radiation estimates relative to observations show small biases (0.5% and −2.6%, at Pantnagar and Nainital, respectively). Despite the high levels of local aerosols we found cool roofs provided significant radiative benefits at all locations. Averaged over the five year period we found that increasing the albedo of 1 m2 of roof area by 0.5 would reflect to space 0.9–1.2 kWh daily from 08:30–15:30 LST, depending on location. This is equivalent to a constant forcing of 37–50 W m−2 (equivalent to reducing CO2 emissions by 74 to 101 kg CO2 m−2 roof area). Last, we identify a co-benefit of improving air quality, in that removing aerosols from the atmosphere could increase the radiative benefits from cool roofs by 23–74%, with the largest potential increase found at Delhi and the smallest change found at Nainital.
Export citation and abstract BibTeX RIS

Content from this work may be used under the terms of the Creative Commons Attribution 3.0 licence. Any further distribution of this work must maintain attribution to the author(s) and the title of the work, journal citation and DOI.
1. Introduction
More than 2% of global land area is urbanized (Millennium Ecosystem Assessment 2005) with a significant portion comprised of structures covered by roofs (up to 25% of the area in a typical city in California is covered by roofs, Ban-Weiss et al 2014). Many common roofing materials absorb most of the incoming solar radiation, heating both the underlying building and the nearby air. 'Cool' roofs reflect more solar energy than standard roofs and have been suggested as an adaptive strategy for warm-climate human environments. Cool roofs can improve human comfort for un-conditioned buildings, reduce energy consumption for conditioned buildings, and potentially reduce ambient urban temperatures and the net radiation absorbed by the Earth. The benefits of cool roofs could be realized with little cost as roofs are replaced periodically, and the cost of replacing a roof with reflective materials is often equal or only marginally different from using standard materials.
Cool roof benefits have been demonstrated for a variety of individual buildings in different locations globally. Multiple experiments (see a partial list below) have demonstrated reduced energy-use or surface temperatures associated with increased roof reflectance in buildings in the United States, India, and elsewhere (Akbari et al 1997, Parker and Barkaszi 1997, Akbari 2003, Akbari et al 2005, Jo et al 2010, Bhatia et al 2011, Gaffin et al 2012, Synnefa et al 2012, Xu et al 2012, Ban-Weiss et al 2013, Kolokotroni et al 2013, Romeo and Zinzi 2013). Building level energy savings motivate the development of policies to support the wider adoption of cool roofs (Levinson et al 2005). Particularly relevant to building retrofits and zero energy building design, Arumugam et al (2014) demonstrated that cool roofs reduced indoor temperatures and increased indoor comfort in a building without active air conditioning.
At the scale of an individual city, meteorological modeling studies indicate potential radiative benefits and reductions to ambient temperatures from citywide installation of cool roofs. For example, Taha (2008), Lynn et al (2009), Zhou and Shepherd (2010), Synnefa et al (2008), Millstein and Menon (2011), and Georgescu et al (2012) report a wide range, generally between 0–2 °C, of local temperature reductions due to installation of reflective urban surfaces in cities in the United States and Greece. Additionally, Santamouris (2014) reviews studies of the potential for reflective and green roofs to mitigate urban heat islands.
In perhaps the only example of real world deployment of reflective roofs across a city-sized area, Campra et al (2008) studied historical temperature records and net surface radiation in Almeria, Spain. Campra et al (2008) found observed average surface air temperatures were 0.5–1 °C less in areas with highly reflective greenhouses compared to similar near-by areas without highly reflective greenhouses. A related modeling study designed to emulate the installation of the highly reflective greenhouses in the region indicated that while observed and modeled annual radiative benefits (∼20 W m−2) matched, only ∼0.1 °C of the local cooling may be attributed to the increase in local albedo with the reminder being associated with general circulation patterns (Campra and Millstein 2013).
The variation in the radiative and temperature benefits at the city-level, described in the papers listed above, is due not only to choice of meteorological models but to local characteristics, such as the local meteorology and the surface area available for albedo enhancement. One important local characteristic not previously studied in the context of radiative benefits from cool roofs is local aerosol burdens. Many of the modeling studies described above did not account for local aerosol gradients in the radiative transfer calculations; however, the locations studied have relatively low aerosol burdens so the aerosol effects could be mostly ignored. In comparison, the cities modeled in this work have significantly higher aerosol burdens, for example, see work by Brauer et al 2012 describing global aerosol burdens and work related to aerosols and radiative transfer in India (Singh et al 2005, Ganguly et al 2006) and China (Xia et al 2007). In this paper we address the question: How effective are cool roofs at reflecting solar radiation to space when installed in locations with relatively high aerosol burdens?
In India, work by Salamanca et al (2012) showed that reflective roofs increased the fraction of solar radiation returned to space by an amount that was predictable using a radiative transfer model. Here, we expand on work by Salamanca et al (2012) by evaluating the potential radiative benefits of cool roofs across selected Indian cities, fully accounting for annual cycles of variations in insolation, clouds, and aerosols. Five years of MODIS satellite and MERRA data were used to characterize daily atmospheric, aerosol and land-surface optical properties in order to simulate radiation transfer through the atmosphere and estimate the additional radiation reflected out of the atmosphere per unit area of cool roof. The methods section describes the transfer model and the remote sensing data used to drive it. The results section describes the ground level validation of the radiative transfer model and the modeled radiative benefit across cities selected from different geographic areas across India.
2. Methods
The approach follows those described in Salamanca et al (2012). Briefly, at each location and day radiative transfer modeling was conducted to find the downward and upward transmittance (the fraction of the top-of-the-atmosphere incoming sunlight reaching the surface or the fraction of the reflected sunlight reaching the top of the atmosphere, respectively) given atmospheric composition such as cloud and aerosol optical properties as well as molecular absorbers, such as ozone, water vapor, carbon dioxide, methane and oxygen. The upward transmittance was used in combination with the modeled incoming shortwave radiative flux at the surface to derive the instantaneous potential increase to outgoing top-of-the-atmosphere shortwave radiative flux given an increase in roof albedo. We note that although the optical properties of the atmospheric gases, clouds and aerosols are the same for the upward and downward transmission of radiation through the atmosphere, the direct incoming radiation has a different spectral weighting than the light reflected from the surface, and thus there are small differences between the downward and upward transmittance values. The increase to outgoing radiation associated with increased roof albedo can be considered a potential radiative benefit, or cooling effect, as the increase to outgoing radiation represents radiation that was reflected due to an increase in roof albedo but not absorbed in transit through the atmosphere. These cool roof benefits are calculated each day but then averaged and evaluated over an annual time frame to minimize errors associated with data from single satellite passes.
Cloud and aerosol optical properties were quantified daily at six urban areas across India, from 1 January 2008–31 December 2012, using a combination of satellite products from the Moderate Resolution Imaging Spectroradiometer (MODIS) (Remer et al 2005) and reanalysis products from the Modern-Era Retrospective Analysis For Research And Applications (MERRA) (Rienecker et al 2011). Optical properties were input into a column shortwave radiative transfer model (Rapid Radiative Transfer Model, RRTMG v.3.8, Mlawer et al 1997) in order to simulate the radiation reaching a roof and the radiation reflected back to space from a cool roof in each city. The radiative transfer model was run multiple times at each time step and location in order to determine the effects of clouds and aerosols on the total shortwave radiation reflected from cool roofs that is transmitted out of the atmosphere.
2.1. Radiative transfer model and satellite data
Multiple inputs were provided at each location and time step to the RRTMG. Column aerosol optical depth (AOD) and surface albedo were set in the RRTMG to match the MODIS Aqua data product MYD04_L2 (C051), based on the 'Corrected Optical Depth Land' at 0.55 μm and the average of the 'Mean Reflectance Land All' at 0.47 and 0.66 μm. Cloud water path, cloud fraction, cloud phase (liquid or ice), and effective droplet or ice-crystal radius were set in the RRTMG to match the MODIS Aqua product MYD06_L2 (C051) based on the 'Cloud Water Path,' 'Cloud Fraction Day,' 'Cloud Phase Infrared,' and 'Cloud Effective Radius.' The MODIS level 2 products used here are produced at 10 km resolution. MODIS Aqua follows a sun-synchronous, near polar orbit, crossing the equator at roughly 1330 local time.
Atmospheric composition vertical profiles, including water vapor, ozone, temperature and pressure, were set in RRTMG to match data from the inst6_3d_ana_Nv MERRA product. Additionally, surface level atmospheric characteristics such as temperature and pressure were matched to data from the Tavg1_2d_slv_Nx MERRA product. The MERRA product has global coverage at a resolution of roughly 50 km and contains multiple outputs per day for the products used here.
RRTMG was run with the single scattering albedo (SSA) set to 0.90, matching the value described for a 'moderately absorbing' aerosol type assigned to all of India in the MODIS aerosol algorithms (Levy et al 2009). Although employing a constant SSA value of 0.90 is a simplification, variation in aerosol properties have been found across India, as well as by seasons, meteorological conditions, and over decades (for example see Ganguly et al 2006, Bollasina et al 2008, Kambezidis et al 2012 and Sanap and Pandithurai 2014), we must replicate the assumptions contained in the MODIS algorithms, as the MODIS AOD product is dependent on those assumptions. We note that because the MODIS AOD is dependent on the SSA assumption, uncertainty related to the SSA is already incorporated into the uncertainty associated with the MODIS AOD product. Additionally, the sensitivity to SSA of modeled incoming radiative flux at the surface was tested. Supplemental table 1, available at stacks.iop.org/ERL/9/104014/mmedia, shows the bias, relative to surface observations, of modeled incoming radiative flux remains small, smaller than ±5%, across a wide range of SSAs. Section 3.1 below presents detailed comparisons of modeled to observed surface radiative flux.
The atmosphere was divided into 72 layers following the MERRA profiles. Aerosols were distributed evenly across the first 10 layers of the atmosphere. Cloud water was distributed across layers 15 and 16, above the aerosols. The Monte–Carlo Independent Column Approximation of sub-grid cloud fraction and overlap was applied (flag 3). Ice clouds were parameterized based on spherical particles (flag 2).
2.2. Calculation of radiative benefits from cool roofs
Building on work by Salamanca et al (2012), equations (1) and (2) are used to calculate ΔSWuptoa, the instantaneous increase to outgoing top-of-the-atmosphere shortwave radiation due to increasing surface albedo of a single roof at the surface (units of W m−2).


where:
 is the total global shortwave radiative flux reaching the surface, (units of W m−2). Note that 'bottom-of-the-atmosphere' is abbreviated as BOA and 'top-of-the-atmosphere' is abbreviated as TOA.
 is the increase in an individual roof albedo (unitless).
 is the percentage of shortwave radiation reflected from the surface that escapes to space, or the upward atmospheric transmittance (unitless).
 is the total outgoing shortwave radiative flux at the top of the atmosphere (units of W m−2).
 is the total outgoing shortwave radiative flux at the top of the atmosphere calculated with the surface albedo set to zero, in other words, the radiation reflected to space by the atmosphere but not the surface (units of W m−2).
Albedo is the surface albedo as measured by MODIS (unitless).
We note that linear sensitivity to ΔAlbedo in equation (1) and also note equations (1) and (2) can be combined to form equation (3).
Downward transmittance is presented in supplemental table 2, and is calculated as in equation (4).

Where:
 = the downward atmospheric transmittance (unitless).
 = the total incoming shortwave radiative flux reaching the surface calculated with the surface albedo set to zero (units of W m−2).
 = is the total incoming shortwave radiation at the top of the atmosphere (units of W m−2).
The radiative transfer model (RRTMG) was run for two primary scenarios for each time-step, a base case scenario forced by satellite data and a 'zero-albedo' scenario, with the only difference from the base case being that surface albedo was set to zero. The zero-albedo scenario is necessary to develop the estimates of downward transmittance in order to remove the effects of light that reaches the surface, is reflected first to the atmosphere and then back to the surface (similar logic follows for the calculation of upward transmittance).
Two additional RRTMG scenarios were run to estimate how much radiation would be reflected to space by a cool roof if aerosols were removed from the atmosphere. The two additional 'zero-aerosol' scenarios matched the two primary scenarios but with the aerosol optical depth set to zero. Equations (1) and (2) above were recalculated under the zero aerosol scenarios.
All four of the above mentioned scenarios were run at 900, 1000, 1100, and 1200 local solar time holding the satellite inputs constant but adjusting the solar zenith angle. Results from each hour were assumed to represent the average radiative characteristics for ±30 min from the top of the hour. As the only modeled change between the hours was the solar zenith angle, the day was assumed to be symmetrical around solar noon. Thus, to find total energy reaching the surface and total energy reflected to space the hourly average values centered at 09:00, 10:00, and 11:00 were doubled and added to the value at noon providing total energy in kWh m−2 day−1. We note the MODIS satellite pass occurs close to the center of each day, thus, we limit our modeling to a within a few hours on each side of the satellite pass.
3. Results and discussion
3.1. Model validation
Modeled downwelling global shortwave radiative flux (the sum of direct and diffuse radiation) at the surface was validated against measurements obtained from urban rooftops during the 9-month (June, 2011–March, 2012) joint Indian-US Ganges Valley Aerosol Experiment (GVAX) campaign described by Salamanca et al (2012). Results show that while instantaneous errors may be large (ranging from 0.4 to an outlier of 647 W m−2, see figure 1) the annual model bias at two Indian cities, Nainital (−13 W m−2 or −2.6% average midday bias) and Pantnagar (2.9 W m−2 or 0.5% average midday bias) was small compared to the radiative benefit obtained from a typical increase in surface reflectance (e.g. 0.3–0.6).
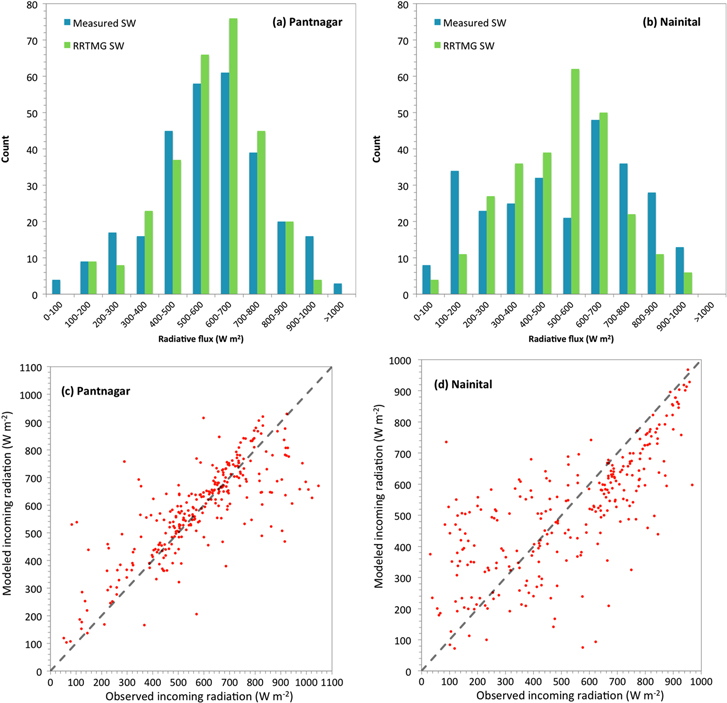
Figure 1. Observed and modeled incoming midday shortwave radiative flux at the surface over the time period of 06/2011–03/2012 at Pantnagar (a) and (c) and Nainital (b) and (d).
Download figure:
Standard image High-resolution imageFigure 1 shows histograms and scatter-plots of observed and modeled incoming surface radiation at Pantnagar and Nainital. The shape of the modeled histogram at Pantnagar closely follows the observed values. However, at Nainital, the modeled incoming radiation is more narrowly distributed around the central value, perhaps reflecting variations in cloudiness or aerosols that are not captured in MERRA or MODIS. In addition, we expect some differences between the modeled and observed values, as the simple treatment of single scattering albedo does not reflect the variability observed in highly polluted urban regions (Singh et al 2005, Ganguly et al 2006, Xia et al 2007) and as the modeled values are based on an instantaneous satellite pass that characterized cloud and aerosol properties over 100 km2 area while the measured values were taken at a single point and averaged over ½ h.
Although both cities are located in the north Indian state of Uttarakhand (see supplemental figure 1), differences in terrain type, pollution burdens and cloudiness allow for validation of the model across a wide range of conditions. For example, Nainital is located in complex terrain at an altitude of ∼2000 meters near the Himalayan Mountains while Pantnagar is located in a flat plain at an altitude of ∼300 meters. The complex terrain at Nainital adds to the difficulty of comparing point observations to modeled values based on satellite observations averaged over a larger area. Pantnagar had a larger aerosol burden than Nainital as the average aerosol optical depth (observed at 0.55 μm) at Pantnagar (0.47) was larger than Nainital (0.26). Nainital was cloudier, with clouds observed on 62% of the days during the validation period while clouds were observed in Pantnagar on only 47% of the days. The increased cloudiness at Nainital likely introduced more bias and errors between the modeled and observed radiation values. Differences between observations and modeled values were less on clear days than cloudy days at both locations.
Zhao et al (2013) found that on an annual average basis, surface incoming shortwave radiation from the MERRA reanalysis product was systematically biased high by 3–20% compared to measurements across North America; these are larger than the annual average bias we find for the Indian sites above. Furthermore, Zhao et al (2013) found this to be of concern for global estimates of incoming surface radiation. We depend on a limited set of MERRA products to describe the gas composition of the vertical column in our radiative transfer modeling. Thus we ask: Could the biases (in the MERRA reanalysis product) discussed by Zhao et al (2013) affect our results? Our analysis suggest not. Zhao et al (2013) indicate that the use of cloud microphysics packages in the MERRA reanalysis product is a potential cause of the biases. Our methodology includes direct retrievals of cloud properties from MODIS satellite products, thus preventing any biases deriving from microphysics packages used by MERRA. A second potential cause of the biases in the MERRA reanalysis may be tracked to estimates of cloud liquid water path (LWP), however, our estimates of LWP are derived directly from MODIS, which does not involve LWP bias as with the MERRA products. Finally, Zhao et al (2013) find a correlation between bias and elevation in the MERRA reanalysis product but again suggest these biases are created by specific treatment of clouds (orographic cloud resolution or LWP biases). There is no indication that our methods have elevation related biases, noting that Naintial was at an altitude above 1 km, which is considered a high elevation site by Zhao et al (2013).
3.2. Radiative benefits at the time of the MODIS aqua pass
We analyzed the radiative benefit of cool roofs, based on a 0.5 albedo enhancement, at six cities, Bangalore, Mumbai, Kolkata, Delhi, Nainital, and Pantnagar, across India for five full calendar years (2008–2012). A ∼0.5 albedo enhancement is typically associated with replacing a flat dark roof with a flat white roof. Supplemental figure 1 shows the wide geographic range covered by the selected cities. The cities selected for this research were chosen to encompass the wide range of atmospheric conditions (primarily AOD and cloudiness) found across India. The cool roof benefits reported here are not necessarily representative of other nearby cities. Future research is planned to replicate this work to cover more cities across India and elsewhere.
Table 1 shows modeled incoming shortwave radiative flux, cool roof radiative benefit at the top of the atmosphere, the additional cool roof radiative benefits without aerosols, background surface albedo, aerosol optical depth, and the upward transmittance of shortwave radiation with and without aerosols for the six cities averaged over the full analysis period from 2008 through 2012. The values shown in table 1 reflect averaged values developed from daily model runs at the time of the MODIS Aqua satellite pass over each location (midday). By modeling radiative benefits at the exact time of the satellite pass we can represent the instantaneous benefits (in power units: W m−2) based on the observed state of aerosols and clouds. In contrast, to estimate radiative benefits in energy units (see section 3.2) we make the assumption that the cloud and aerosol conditions at the time of the satellite pass are representative from 08:30–15:30 LST.
Table 1. Radiative characteristics of each city including shortwave radiative flux at the surface (incoming BOA), cool roof radiative benefit at the top of the atmosphere upon increasing roof albedo by 0.5 (Δ Outgoing TOA), the additional cool roof radiative benefits without aerosols, the surface albedo, the aerosol optical depth, and the upward transmittance with and without aerosols. The mean (μ) and standard deviation (σ) is calculated across five annual values spanning 2008–2012. Albedo and AOD are the surface albedo and column aerosol optical depth, respectively, as measured by MODIS.
| City | Incoming BOA (W m−2) | Δ Outgoing TOA (W m−2) | Additional Δ outgoing TOA without aerosols (W m−2) | Surface albedo | AOD | Transmittance upward (with aerosols) | Transmittance upward (without aerosols) |
|---|---|---|---|---|---|---|---|
| Bangalore | 643 ± 10.2 | 178 ± 5.2 | 60 ± 5.2 | 0.14 ± 0.004 | 0.45 ± 0.04 | 0.51 ± 0.01 | 0.61 ± 0.01 |
| Mumbai | 614 ± 7.0 | 170 ± 4.8 | 90 ± 2.2 | 0.16 ± 0.002 | 0.66 ± 0.02 | 0.51 ± 0.01 | 0.65 ± 0.01 |
| Kolkata | 548 ± 14.6 | 139 ± 5.5 | 85 ± 5.3 | 0.16 ± 0.007 | 0.73 ± 0.03 | 0.47 ± 0.01 | 0.61 ± 0.01 |
| Delhi | 573 ± 13.2 | 153 ± 5.2 | 109 ± 2.8 | 0.17 ± 0.002 | 0.82 ± 0.02 | 0.50 ± 0.01 | 0.68 ± 0.01 |
| Nainital | 569 ± 29.9 | 167 ± 12.6 | 37 ± 5.2 | 0.11 ± 0.003 | 0.30 ± 0.04 | 0.52 ± 0.02 | 0.58 ± 0.02 |
| Pantnagar | 631 ± 21.9 | 191 ± 10.4 | 67 ± 3.9 | 0.14 ± 0.002 | 0.47 ± 0.03 | 0.57 ± 0.02 | 0.67 ± 0.02 |
There are significant differences by city in both the amount of sunlight reaching the surface and how much energy cool roofs can reflect to space. Average midday radiation reaching the surface in Kolkata was 548 W m−2, 95 W m−2 less than the 643 W m−2 reaching the surface in Bangalore (the city with the highest average incoming surface radiation). The largest radiative benefits from installation of cool roofs were found at Pantnagar and Bangalore, where installation of cool roofs increased midday outgoing radiation by 191 and 178 W m−2, respectively. We note that the reason for the larger radiative benefit at Pantnagar, despite higher incoming radiation at Bangalore, is due to the higher average transmittance at Pantnagar. The smallest radiative benefits from cool roofs were found at Kolkata and Delhi, where midday cool roof radiative benefits were found to be 139 and 153 W m−2 respectively. These results indicate that a cool roof installed in Pantnagar would reflect 37% more energy to space than a cool roof installed in Kolkata.
In addition to differences in latitude, each city has varying amounts of cloud cover and aerosol burden that drive the average levels of incoming surface radiation and cool roof radiative benefit. For example, of the six selected cities, Kolkata and Delhi had the highest aerosol burdens. By rerunning the RRTMG model we calculate the cool roof radiative benefit in each location in the absence of aerosols. The purpose of the aerosol free calculation is to estimate the increase to cool roof radiative benefit after pollution controls are implemented. Without aerosols the transmittance (see table 1) of reflected sunlight through the atmosphere increases in all locations, especially in Delhi, Kolkata, and Mumbai, where upward transmittance increased by 36, 30, and 27% respectively. Removing aerosols has a similar affect on downwards transmittance as on upward transmittance (see supplemental table 2). Thus, in a clean atmosphere, compared with a polluted atmosphere, more radiation reaches the surface, and a higher percentage of that radiation escapes to space after being reflected by cool roofs. Without aerosols, the radiative benefit of cool roofs in Delhi, Kolkata, and Mumbai were 262, 225 and 260 W m−2, respectively, or 71, 61, 53% larger than the radiative benefits found under the current pollution burdens. In contrast, removing aerosols increased the cool roof radiative benefit by 22% at Nainital (the city with the lowest aerosol burden).
We note three caveats to the above pollution control analysis. The pollution itself is both reflecting and absorbing sunlight, thus removing pollution may decrease earths overall albedo (a subject outside the scope of this work). Second, a portion of the total aerosol burden is from natural sources, such as windblown dust, and pollution controls could not remove aerosols completely and thus the analysis represents an upper bound estimate of the benefit of pollution control to cool roof radiative forcing. Finally, we only estimate the direct change to radiation from pollution control but major pollution control may also affect cloud formation, cloud thickness and meteorological patterns. These meteorological changes are uncertain, and not accounted for by the single column radiation transfer model applied here.
3.2.1. Inter-annual variation
Figure 2 shows the annual average midday incoming shortwave radiative flux at the surface, cool roof radiative benefit, and aerosol optical depth by year and location. Most cities displayed little inter-annual variation, however, incoming radiation and cool roof radiative benefits were noticeably higher at Nainital and Pantnagar for the years 2009 and 2010. Some of the increased incoming surface radiation at Nainital and Pantnagar may be attributed to lower aerosol optical depth in 2009. However, in 2010, aerosol optical depth at both locations is higher than in 2008, yet the total incoming surface radiation is also higher at both locations, indicating that changing cloud cover as opposed to changing aerosol optical depth is the dominant cause of the annual variation seen in these locations.
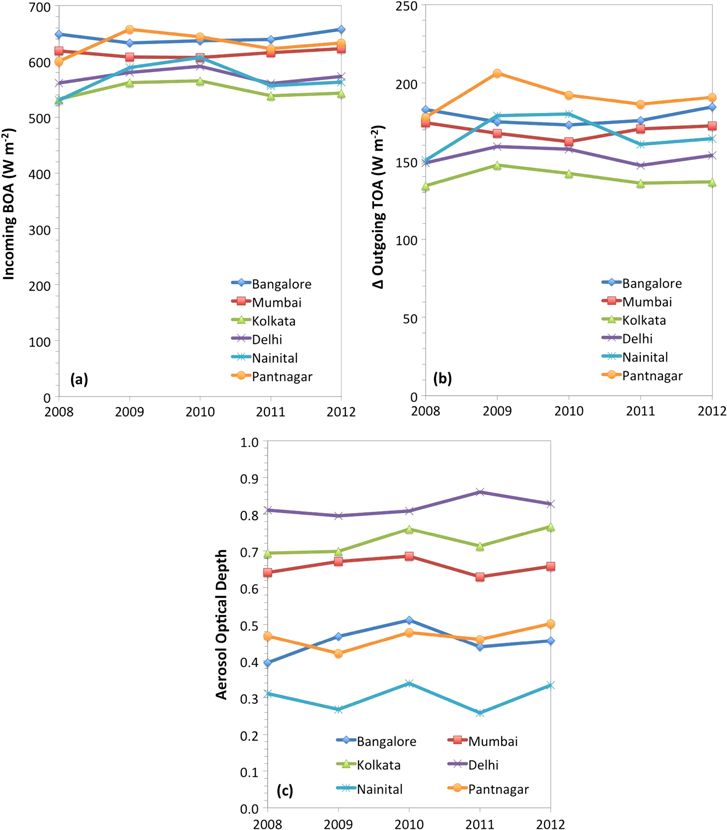
Figure 2. (a) Incoming shortwave radiative flux at the surface (incoming BOA), (b) cool roof radiative benefit at the top of the atmosphere upon increasing roof albedo by 0.5 (Δ Outgoing TOA), and (c) aerosol optical depth (dimensionless) at 0.55 μm. Note: all values shown are the midday annual average.
Download figure:
Standard image High-resolution image3.2.2. Intra-city variation
In order to ensure that the locations picked within each city were representative of the larger metropolitan areas we picked multiple points throughout each selected city and analyzed results over the year 2009. We found the average intra-city standard deviation of the annual incoming shortwave radiative flux at the surface and the cool roof radiative benefit to be: 5.9 and 3.5 W m−2, or about one-fifth and one-third of the inter-city standard deviations, respectively (see table 2). This indicates that meteorological and aerosol differences between cities dominate over the differences within cities and therefore picking a single point to represent each urban area does not significantly bias the results. We excluded Pantnagar and Nainital from the intra-city analysis, as those metropolitan areas are relatively small.
Table 2. Comparison of intra-city to inter-city midday incoming shortwave radiative flux at the surface and change to midday outgoing top-of-the-atmosphere radiative flux given a 0.5 increase to roof albedo. Intra-city μ and σ are calculated from annual, 2009, values from five locations within each metropolitan area (except three locations at Mumbai). Inter-city μ and σ are calculated from the annual, 2009, values at the four city centers.
| Intra-city (μ ± σ) | Incoming solar radiative flux (W m−2) | Δ Outgoing solar radiative flux (W m−2) |
|---|---|---|
| Bangalore | 644 ± 7.2 | 183 ± 4.4 |
| Delhi | 583 ± 5.4 | 160 ± 2.8 |
| Kolkata | 568 ± 6.2 | 151 ± 3.0 |
| Mumbai | 612 ± 4.6 | 172 ± 3.7 |
| Inter-city (μ ± σ) | 602 ± 33.6 | 167 ± 14 |
3.3. Radiative benefits integrated over 0830–1530 (solar time)
To estimate how cool roof radiative benefits change through the day we assume the observed cloud and aerosol properties are representative from 08:30–15:30. The MODIS Aqua satellite crosses the equator, traveling north, at roughly 13:30 local time. Thus, we are assuming that averaged over the five year time period, atmospheric conditions stay relatively constant for ∼2 h after the pass and ∼5 h before the pass. While we have limited our analysis to times near the satellite pass, it is possible that systematic diurnal cloud patterns could bias the results, for example heavy morning fog. However, the analysis of local weather patterns is out of scope of this work and left for future research.
Figure 3 shows daytime profiles of incoming radiative flux and outgoing radiative flux from increasing roof albedo at Delhi and Nainital. By integrating over time we can estimate the daily solar radiation that reaches the surface and the daily solar radiation that could be reflected to space from albedo enhancements (see figure 4). Two scenarios, with and without aerosols are shown in figure 3. The effects of aerosols on both incoming and outgoing radiation stay relatively constant throughout the day, however, in the hypothetical aerosol free scenario the percent of direct (as opposed to scattered) radiation reaching the surface stayed relatively constant in the morning and afternoon hours compared to the reduction to percent of direct radiation during those hours when including aerosols.
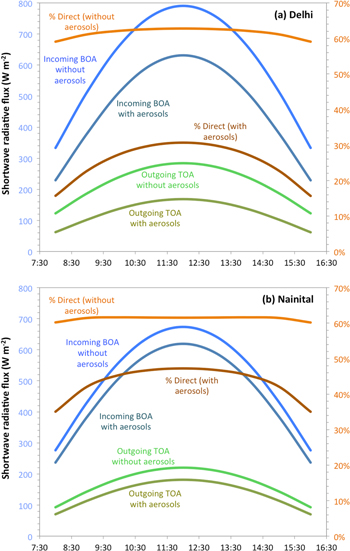
Figure 3. (a) Delhi and (b) Nainital average (2008–2012) diurnal profiles of incoming shortwave radiative flux at the surface (incoming BOA) and cool roof radiative benefit at the top of the atmosphere upon increasing roof albedo by 0.5 (outgoing TOA) modeled with and without aerosols. The right vertical axis indicates the percent of radiation reaching the surface directly.
Download figure:
Standard image High-resolution image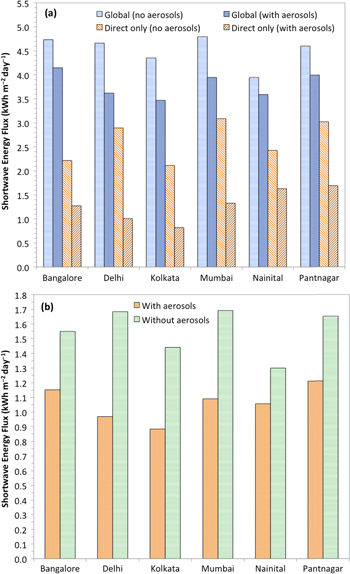
Figure 4. (a) Daily average (08:30–15:30 LST) global (direct + diffuse) and direct solar radiation reaching the surface. (b) The increase in outgoing daily average (08:30–15:30 LST) total solar radiation at the top of the atmosphere given an increase to roof albedo of 0.5.
Download figure:
Standard image High-resolution image
The top panel of figure 4 shows the daily average solar energy (kWh m−2 day−1) reaching the surface between the hours of 8:30 and 15:30 local solar time from 1 January 2008 through 31 December 2012. Both the global and direct-only radiation are shown. Additionally, the radiative transfer model was run without aerosols to estimate the potential total radiation reaching the surface in a clean atmosphere. It is illustrative to compare incoming solar energy at Nainital to incoming solar energy at Delhi. In a hypothetical clean atmosphere, significantly more energy reaches the surface at Delhi than at Nainital because Nainital is cloudier than Delhi, but once aerosols are included solar energy input at both locations is equivalent. The effects of aerosols on direct radiation reaching the surface are larger than on global radiation, and in this case, about 1.6 times more direct solar energy reaches the surface in Nainital than Dehli, while in a clean atmosphere Dehli would receive 1.2 times the amount of direct solar energy than Nainital.
The bottom panel of figure 4 shows the daily average solar energy (kWh m−2 day−1) reflected back to space due to increasing the albedo of a roof by 0.5. Two scenarios are shown (with and without aerosols) and the averaging time period is the same as the top panel. Depending on location, we predict a cool roof would reflect an additional 0.9–1.2 kWh m−2 to space over the 0830–1530 time frame compared to a standard roof. This is equivalent to constant forcing of 37–50 W m−2 or to reducing CO2 emissions by 74 to 101 kg CO2 m−2 if we approximate the radiative forcing of CO2 as 0.9 kW t−1 and assume only 55% of emitted CO2 is retained in the atmosphere, following Akbari et al (2009). In a hypothetical clean atmosphere, albedo enhancements would reflect 1.3–1.7 kWh m−2 to space daily, leading to carbon offsets of 108–141 kg CO2 m−2. Removing aerosols had the largest impact at Dehli increasing total energy reflected to space by 74%.
Depending on the methods used, estimates of carbon offsets from increasing roof albedo range from 130 and 175 kg CO2 m−2 (Menon et al 2010, Millstein and Menon 2011) to a more general low-latitude global sensitivity calculation of roughly 7 kg CO2 m2 per 0.01 surface albedo increase (Akbari et al 2012) to effectively zero (Jacobson and Ten Hoeve 2012). These studies are not directly comparable due to differences in the choice of domain and modeling techniques. It is worth noting the finding from Jacobson and Ten Hoeve (2012) was based on a global scenario in which the albedo of all urban areas was increased and subsequent changes to meteorological patterns caused a small amount of surface warming. In contrast, our analysis assumes no changes to meteorological patterns and therefore estimates the effects of enhancing the albedo of a single roof at a time. If, over a number of years, a city adopted cool roofs across a large portion of its building stock, our analysis would need to be rerun to capture any changes to meteorological patterns caused by the change to average citywide albedo.
Finally, the issue of roof soiling through particle deposition is not addressed in this work. The issue of soiling is complicated as the effective albedo of a reflective roof in a region with high aerosol load may change over time, potentially decreasing with particle deposition and potentially increasing after rainfall. The opposite effect might be seen for a roof that is initially dark. The properties (SSA for example) of the aerosols may also influence roof soiling along with any type of biogenic activity. The comprehensive testing of roof aging and surface properties requires testing periods longer than 10 months (the length of the field studies in Pantnagar and Nainital) and thus we are unable to adequately investigate roof soiling. For example, the US Cool Roof Rating Council exposes products for three years to determine their long-term radiative properties (ANSI/CRRC 2012). Similar natural exposure trials are planned for India and China (R Levinson, personal communication, 17 February). Cool roof benefits reported here are linearly related to the change to roof albedo, so a ten percent reduction to albedo change would lead to an equal reduction to the radiative benefits at that location.
4. Conclusion
We used an atmospheric radiative transfer model forced with atmospheric properties, including aerosol optical depth, cloud water path, vertical profiles of atmospheric gasses, temperatures, and pressure, from satellite and reanalysis products to estimate the radiative benefits of cool roofs across multiple Indian cities and over five full annual cycles. We found the annual average radiative benefit of a 0.5 increase in roof albedo to range from 0.9–1.2 kWh m−2 day−1 (equivalent to constant forcing of 37–50 W m−2). We showed the model produced annual biases that were much smaller than incoming solar radiation measured at rooftops in two cities. We have shown reducing the high aerosol burden observed by satellite across multiple Indian cities could increase the total energy reflected to space from enhancement of roof albedo by 23–74%. Despite these aerosol effects, we have shown that cool roofs provide significant radiative benefits in Indian cities.
Acknowledgments
We thank Ram Sagar, Rao Kotamarthi, Bipin Shah, Ken Reichl, Jyotirmay Mathur, Jaipur J Niranjan for assistance during and in support of the RAWEX-GVAEX campaign and subsequent analysis. We also thank Shaheen Tonse, Surabi Menon, Francisco Salamanca, Vishal Garg, Krishna P Singh and Manish Naja for assistance with field measurements at Pantnagar and Nainital, and RRTMG configuration. We thank Ronnen Levinson for helpful discussions. Computing resources were provided by the Lawrencium cluster at LBNL. This work is supported by the US DOE Office of Energy Efficiency and Renewable Energy, and the US DOE Office of Science, Atmospheric Radiation Measurement program, under contract DE-AC02-05CH11231.