

Abstract
This study presents a global analysis of urban water supply vulnerability in 71 surface-water supplied cities, with populations exceeding 750 000 and lacking source water diversity. Vulnerability represents the failure of an urban supply-basin to simultaneously meet demands from human, environmental and agricultural users. We assess a baseline (2010) condition and a future scenario (2040) that considers increased demand from urban population growth and projected agricultural demand. We do not account for climate change, which can potentially exacerbate or reduce urban supply vulnerability. In 2010, 35% of large cities are vulnerable as they compete with agricultural users. By 2040, without additional measures 45% of cities are vulnerable due to increased agricultural and urban demands. Of the vulnerable cities in 2040, the majority are river-supplied with mean flows so low (1200 liters per person per day, l/p/d) that the cities experience 'chronic water scarcity' (1370 l/p/d). Reservoirs supply the majority of cities facing individual future threats, revealing that constructed storage potentially provides tenuous water security. In 2040, of the 32 vulnerable cities, 14 would reduce their vulnerability via reallocating water by reducing environmental flows, and 16 would similarly benefit by transferring water from irrigated agriculture. Approximately half remain vulnerable under either potential remedy.
Export citation and abstract BibTeX RIS

Content from this work may be used under the terms of the Creative Commons Attribution 3.0 licence. Any further distribution of this work must maintain attribution to the author(s) and the title of the work, journal citation and DOI.
1. Introduction
Rapid population growth over the past 60 years has led to accelerated global urbanization. With more than half of the world's inhabitants now residing in cities, the human geography of the planet has shifted, condensing nearly 3.6 billion people into <1% of the total global land area (Schneider et al 2009, United Nations 2012). These urbanized areas represent hotspots of localized, concentrated development that place enormous pressure on natural resources, particularly freshwater supply. Globally, urban water use has increased five-fold since 1950, reflecting greater demands as more people move to urban centers and increase their per capita use, commensurate with higher standards of living (Richter et al 2013). Combined with water demands for agricultural irrigation, industrial production, and water to sustain environmental flows, water scarcity has become a global problem.
The impact of urban demands on freshwater resources not only alters the hydrologic balances in the basins that supply and receive water for urban areas, but can devastate the integrity of a watershed tapped for supply (Miltner et al 2004). An historical example is the city of Los Angeles, US, which in the early 1900s commandeered nearly the entire flow of the Owens Valley and Mono Lake basins, severely damaging the existing natural and human systems within each. More modern examples include the dramatic decline in the water quantity and quality of Lake Chapala through the early 2000s caused in part by the city of Guadalajara, Mexico drawing increasingly larger volumes of water for urban supply (Webster et al 2009). The Krishna basin in India suffers 'significant degradation of various ecosystems' due to widespread over-allocation across all sectors, including large withdrawals for the cities of Hyderbad, Pune, and water exports to Chennai (Venot 2009). On the other hand, places like New York City, US have instead promoted source watershed protection measures that leave supply basins with functional ecosystems, despite providing water to one of the largest cities in the world.
Freshwater vulnerability is only partially a reflection of growing urban demands. Although water for municipal use has become significantly more important over the past century, agricultural irrigation is by far the dominant user of water around the world (Gleick 1993). Since the 1950s, the volume of water used for irrigation purposes has nearly tripled (Molden 2007). However, historical trends suggest that as urbanization intensifies, a larger portion of available freshwater resources will be channeled to the urban sector (Oki and Kanae 2006). The options for closing the growing urban water deficit are building non-traditional, expensive sources (e.g., recycling, desalination), developing reallocation schemes, such as urban-rural partnerships (Gober 2010, Richter et al 2013), or by reducing water allocated for environmental flows (Rogers 1993).
Until recently, urban impacts on supply vulnerability were either performed for individual cities, regionally, e.g., in the US (Averyt et al 2013, Padowski and Jawitz 2012), or by assuming the basins within which urban areas reside are those supporting urban water demands (Jenerette and Larsen 2006, McDonald et al 2011). Currently, only the City Water Map Initiative has presented a global assessment of urban water stress that directly incorporates information about urban water sources (McDonald et al 2014).
The study presented here examines baseline and future vulnerability scenarios of cities under normal climate conditions and quantifies the magnitude of reallocation needed to reduce future vulnerability. To accomplish this, our global analysis evaluates the vulnerability of surface water supply basins serving large cities that lack source diversity, relying on either direct river withdrawals or releases from reservoir storage and asks: (1) which large urban areas are most vulnerable to demands for freshwater now and in the near future? (2) Of those vulnerable large cities, what is the magnitude of water reallocation needed to assure urban freshwater supplies?
2. Methodology
2.1. Criteria for inclusion and data sources
Water vulnerability assessments were performed for all basins supporting cities with populations in excess of 750 000 that obtain water supplies solely from either (a) river withdrawals or (b) reservoirs (natural or man-made) that are not shared with another large city. In total, 71 cities in 39 countries were identified that meet these criteria. Information on the type and location of urban water sources was obtained from the City Water Map Initiative (McDonald et al 2014). Hydrologic data, including mean annual reliable basin discharge (GWSP 2008a), environmental flow requirements (GWSP 2008b), mean annual reservoir storage capacity (Lehner et al 2011, NID 2009), global potential evapotranspiration rates (Zomer et al 2007, 2008) and urban demand (FAO 2013) were obtained from global databases (see supplemental material). Available environmental flow requirements and discharge statistics for all supply basins were based on time series of monthly climate variables over the climate normal period 1961–1990. Estimates of future vulnerability are based on urban growth projections developed in the UN World Urbanization Prospects (United Nations 2012). Basin boundaries for each urban water source were delineated using HydroSHEDS (Lehner et al 2008), yielding 107 surface-water basins, with 49 cities relying on a single supply basin and 22 cities relying on more than one basin. Where a city uses more than one supply basin, that city's supply basin refers to the combination of discharge from all of the supply basins used.
2.2. Objectives
The focus of this study is on large cities using surface water supplies that lack source diversity, relying on either direct river withdrawals or releases from reservoir storage. Three vulnerability metrics, discussed below, were used to identify those cities that fail to meet simultaneous thresholds of freshwater supplies for urban, agricultural, and environmental purposes. Urban water vulnerability was calculated for baseline conditions (2010) and for a future scenario (2040) in which increasing water demands are proportional to predicted population growth and projected irrigated agricultural demand. Although projected demand estimates account for population increases, surface water supply changes resulting from expanding urban boundaries and additional future supplies a city might tap by 2040 are not considered. These estimates also do not include any impacts of changes in land use or climate, which could potentially increase or decrease the amount of water available to an urban area (Velpuri and Senay 2013). Rather, this analysis establishes a baseline estimate of vulnerability assuming stationarity in urban hydrologic systems over the next 25 years. For the future scenario, the reduction in urban water vulnerability that could be achieved is examined in two end-member demand scenarios: (1) demands based on projected water-sharing allocations, and (2) demands where excess water from agriculture or the environment is redirected for the other sectoral uses.
2.3. Basin vulnerability metrics
2.3.1. Environmental water requirements ( )
)

Environmental flows are a critical water resources component (Poff et al 1997, Smakhtin et al 2004). Ideally, a supply basin should be capable of fostering urban well-being while supporting a viable ecosystem. The environmental water metric reflects the vulnerability of freshwater-dependent ecosystems to urban water use, and is defined as a ratio of critical environmental water demand to available basin flow. Environmental water demand ( ) is based on low-flow conditions derived from the WaterGap model in which global estimates of environmental water flow were determined at the watershed scale (Döll et al 2003, Smakhtin et al 2004).
This vulnerability metric compares the water required to meet environmental demands to the mean low-flow monthly water discharge within each basin ( ). Although it has been shown that urbanization can cause changes in runoff in some US urban watersheds (Velpuri and Senay 2013), global data of changes in runoff trends are currently not available and may not be applicable in cities that collect water from basins external to their urban footprint. Rather, within each basin, the
  value is used to represent the 'reliable monthly discharge,' which is equal to the minimum flow that is exceeded on average 90% of the time (based on monthly discharge data). We define the environmental water requirement (
 ) for each basin as the ratio of
  to the low-flow runoff
  after agricultural (
 ) and urban demands (
 ) are met (see 2.3.2 for agricultural and urban demand calculations) (equation (1)).

Any basins for which environmental water demands  are large relative to net reliable flow are considered threatened (
 > 0.4). The threshold of 0.4 adopted here builds on a similar scarcity threshold applied in other well-established contexts (Falkenmark et al 1989, Vörösmarty et al 2005).
2.3.2. Human uses: urban water and agricultural irrigation
Urban water requirements were assessed using an analogous metric to that used for environmental flow requirements. Specifically, the urban water requirement represents a ratio of urban demand during low-flow conditions to renewable surface water in basins when environmental needs are met first. Since urban water demand ( ) is not a commonly reported metric, estimates of demand for each city were computed by multiplying the population by the mean annual national municipal and industrial per capita demands, excluding withdrawals for thermoelectric cooling (GWSP 2008c). The discharge required to meet urban needs was calculated as the ratio of
  to the mean 'reliable monthly discharge' for a basin
  after agricultural (
 ) and environmental demands (
 ) are met (equation (2)).

As with  , a threshold is applied such that all basins for which urban demands DH are large relative to net available low flow are deemed threatened (
 > 0.4).
Agricultural demands ( ) were estimated from the most recent annual national water use statistics (FAO 2013) for urban supply basins with >1% of the total area occupied by land under irrigation (Siebert et al 2013). The relative percent of water withdrawn for agriculture was used as a proxy for the flow in each basin that is allocated for irrigation purposes. In equation (2), systems supported by river withdrawals, have
  subtracted directly from the
  while basins supporting urban supplies through reservoirs, versus directly from streamflows, have a
  . For these reservoir-supplied systems, values of
  are instead subtracted from reservoir storage (equation (3)). Projections of future agricultural demands for the 2040 scenario were made based on available national water use statistics from 1965–2010.
2.3.3. Storage requirements ()

The third measure of vulnerability provides insight into a basin's hydraulic capacity to supply water. This measure is based on the ratio of total annual urban demand volume to reservoir normal storage. Reservoir storage is a key component in many urban supply systems, increasing hydraulic system stability by helping to buffer variability in available supply (Padowski and Jawitz 2012). In this study, 28 of the 71 cities relied on releases from surface reservoirs. Here, urban supply basin reservoirs are assumed to be managed such that urban demands receive top priority. It is also assumed that no additional significant reservoir capacity will be added before 2040. Understanding that these assumptions likely provide just one assessment of water available for human consumption, storage threat is measured as the ratio of urban water demand ( ) to the reported reservoir annual storage capacity (
 ) minus evaporative losses estimated using potential evapotranspiration
  (Ward and Trimble 2003) and agricultural demands (
 ) for a year (equation (3)), where basins are considered threatened when
  (Lane et al 1999).

2.4. Cities supplied by direct river withdrawals versus reservoirs
Reservoir-supplied cities were evaluated using each of the three metrics described above, however river-supplied cities have no major storage infrastructure and were assessed using only the two flow-based metrics ( and
and  ).
).
2.5. Vulnerable versus threatened status
For both categories—reservoir and river supplied—cities were considered 'vulnerable' if all demand thresholds were violated. If a city had one or two but not all three metrics exceeding a threshold, then it was considered 'threatened,' as these supplies may no longer be able to support urban demand without causing damage to agriculture, the environment, or both. We refer to a city as 'susceptible' if it has either threatened or vulnerable status; the number of susceptible cities is the sum of those that are threatened or vulnerable. Finally, cities were considered 'non-threatened' if no demand thresholds were violated.
3. Results
3.1. Baseline vulnerability and threats (2010)
Each city was assessed according to the three vulnerability metrics defined in section 2. The status of each city, either vulnerable (red), threatened (yellow) or non-threatened (light blue) is shown on the global map in figure 1. The total number of cities in each category is given in table 1. Of the 71 cities included in this study, 25 are classified as vulnerable in 2010, of which 23 are cities supplied solely by direct river withdrawals. These vulnerable river-supplied cities have significantly lower mean per capita flows (2700 l/p/d) than those cities with sufficient water (196 100 l/p/d), and fall within the range of water availability that Falkenmark et al (1989) identify as having water management problems due to water stress (2700–4700 l/p/d).
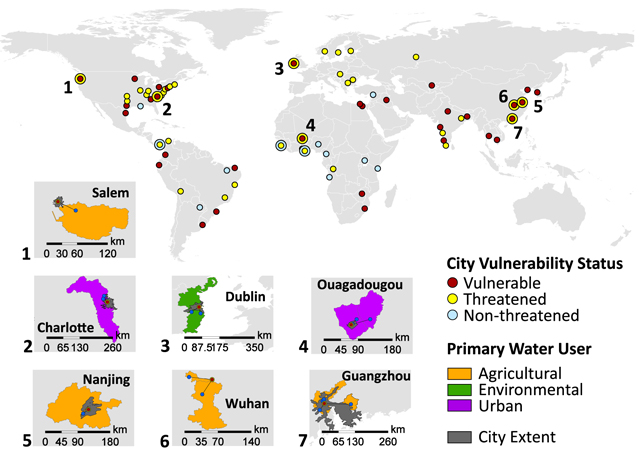
Figure 1. City supply system vulnerability. Cities are represented on the world map by circles where color indicates the degree to which each city faces water supply issues. Cities that change status over the time period studied are demarcated with a colored outer ring (2010) and inner circle (2040). Vulnerable cities (red) are those who suffer from both environmental and urban water scarcity. Threatened cities (yellow) are those that have either environmental or urban water scarcity issues. Cities with no water supply issues (non-threatened) are symbolized by a light blue filled circle. Numbered locations represent those cities-of-concern (see section 3.3) which become vulnerable by 2040. Insets of these particular cities accompany the world map. Dark blue circles represent the general location of urban supply sources in inset maps. Basin color denotes the primary sectoral water user in each system, whereas dark gray areas indicate city extents. City names may be found in the supplementary information.
Download figure:
Standard image High-resolution image
Table 1. Number of large cities either vulnerable or threatened.
| Number of cities by category | Percent of cities by category | ||||||
|---|---|---|---|---|---|---|---|
| Year | Type | All urban systems | Reservoir-supplied | River-supplied | All urban systems | Reservoir-supplied | River-supplied |
| Vulnerable | 25 | 2 | 23 | 35% | 7% | 53% | |
| Threatened | 34 | 20 | 14 | 48% | 71% | 33% | |
| 2010 | Non-threatened | 12 | 6 | 6 | 17% | 21% | 14% |
| Total | 71 | 28 | 43 | 100% | 100% | 100% | |
| Vulnerable | 32 | 5 | 27 | 45% | 18% | 63% | |
| 2040 | Threatened | 30 | 20 | 10 | 42% | 71% | 23% |
| Non-threatened | 9 | 3 | 6 | 13% | 11% | 14% | |
| Total | 71 | 28 | 43 | 100% | 100% | 100% | |
In addition to supporting urban demands, urban supply basins often provide water for agricultural and environmental needs as well. To better understand why vulnerability occurs, the primary source of water demand by sector was determined for each supply basin. Considering only the 25 vulnerable cities, demand from the agricultural sector is dominating for the supply basins of 16 cities (64%). There are five vulnerable cities for which environmental needs are most prominent within supply basins (20%), with demand from the urban sector dominating in the supply basins of four cities (16%) (table 2).
Table 2. Number and percent of vulnerable (upper) and threatened (lower) cities classified by dominant cause and supply type. Also identified are the number of threatened cities that face either single or dual threats to a city's water supply status.
| 2010 | 2040 | |||
|---|---|---|---|---|
| Dominant cause | Reservoir-supplied | River-supplied | Reservoir-supplied | River-supplied |
| Vulnerability dominated by demand from: | ||||
| Agriculture | 2 | 14 | 1 | 17 |
| Environment | 0 | 5 | 1 | 5 |
| Urban | 0 | 4 | 3 | 5 |
| Total vulnerable (% by supply type) | 2 (7%) | 23 (53%) | 5 (18%) | 27 (63%) |
| Threat dominated by stress from: | ||||
| Environment | 5 | 14 | 3.5 | 10 |
| Human | 1 | 0 | 1.5 | 0 |
| Storage | 14 | — | 15 | — |
| Total threatened (% by supply type) | 20 (71%) | 14 (33%) | 20 a (71%) | 10 (23%) |
| Sole threat (% by supply type) | 9 (45%) | 14 (100%) | 10 (50%) | 10 (100%) |
| Multiple threats (% by supply type) | 11 (55%) | 0 (0%) | 10 (50%) | 0 (0%) |
aThe total number of threatened reservoir-supplied cities in 2040 includes fraction values because the dominant threat in one city is tied—both environmental and human threat scores are equal.
Also examined were 'threatened' cities, where 'threatened' means that one or two of the three metrics exceed their demand threshold. Of the 71 cities considered, 34 are threatened and represent the majority of reservoir-supplied systems (71%), but only 33% of river-supplied cities are threatened (table 1). Environmental demand was the only stressor for river-supplied cities, however reservoir-supplied cities revealed more varied sources of stress, suffering from a variety of environmental, human and storage-related threats (table 2). The number of threatened reservoir-supplied cities is ten times greater than those considered vulnerable, whereas the number of threatened river-supplied cities is approximately half of those found to be vulnerable (table 1).
3.2. Future vulnerability and threats (2040)
In 2040, the number of vulnerable cities rises from 25 to 32, representing a 28% increase in urban areas facing serious water issues (table 1). Of these 32 cities, those that are river-supplied continue to make up the majority of those that are vulnerable. Our analysis provides a baseline estimate of vulnerability assuming near-term stationarity in urban surface water hydrologic systems. Even without accounting for potential changes in local hydrology due to climate change, as populations increase, mean per capita flows for vulnerable river-supplied cities drop over this 30 year period to 1200 l/p/d, beyond 'chronic water scarcity', 1370 l/p/d (Falkenmark et al 1989). During this same period, the total number of vulnerable reservoir-supplied cities more than doubles, from 7% to 18%, as storage infrastructure loses its advantage as a supply buffer. When considering only the 32 vulnerable cities in 2040 (table 2), 18 (56%) cities had supply basins dominated by demand from the agricultural sector. The number of cities with vulnerable supply basins dominated by demand from the urban sector increases from four out of 25 vulnerable cities (16%) in 2010 to eight out of 32 vulnerable cities (25%) in 2040.
Although more cities become vulnerable in 2040, the percent of 'threatened' cities decreases from 48% in 2010 to 42% in 2040 (table 1). Similar to 2010, the majority of reservoir-supplied cities are those considered threatened (71%), however the relative difference between the numbers considered threatened versus vulnerable decreases. Environmental demands continue to be the only stressor for river-supplied cities, however, stress from storage over-allocation becomes the leading threat in reservoir-supplied cities, occurring in 15 of the 28 cities depending on this supply type (table 2). Although the ratio of reservoir- to river-supplied threatened cities increases, by 2040 all but three reservoir-supplied and six river-supplied cities remain unthreatened. Access to large sources of water combined with relatively low urban demand and/or environmental demands keeps these nine cities protected from water-supply compromise.
3.3. 'Cities-of-concern'- locations threatened or vulnerable in the near future
Between 2010 and 2040, 10 'cities-of-concern' were identified as becoming more susceptible, with conditions worsening from a non-threatened to threatened status, or from threatened to vulnerable. In total, three of the cities identified as non-threatened in 2010 become threatened in 2040 (Accra, Ghana; Freetown, Sierra Leone; Panama City, Panama). Seven cities-of-concern change from threatened to vulnerable status (Dublin, Ireland; Salem and Charlotte, USA; Ouagadougou, Burkina Faso; Guangzhou, Wuhan, and Nanjing, China; figure 1 insets). Three of these cities-of-concern (Charlotte, Ouagadougou, and Panama City), each transition from a system dominated by the environmental sector demand to one dominated by the urban sector demand, as none of their supply basins support significant irrigated agriculture. Of these 10 total cities that show increased susceptibility by 2040, 6 are reservoir-supplied cities and 4 are river-supplied. This suggests that increased demand by 2040 puts at risk a significant number of both river-supplied and reservoir-supplied cities.
3.4. Water reallocation to reduce threats to cities in 2040
Two water reallocation strategies are examined to assess their potential usefulness of reducing the threat of failing to meet urban demands. In these alternative assessments, urban water threat predictions operate under the assumption that growing urban demands may either completely consume water required for environmental flows (reallocation through environmental neglect), or be tempered through an urban-rural partnership where water is reallocated from agriculture via a water market to urban uses within a supply basin (reallocation through agricultural transfers). In this scenario, surface reservoirs continue to provide irrigation water and a portion of that water is transferred to the urban sector sufficient to meet the urban water demand threshold. The remaining water is used for irrigation or to satisfy environmental needs. Similarly, irrigation water in excess of urban needs is also used to meet minimum environmental flows in river-supplied cities. This analysis represents an end-member strategy in which enough irrigation water is transferred to satisfy urban demands plus other sectoral demands to the degree possible.
Table 3 shows the number of cities for which reallocation provides sufficient water under three scenarios: (1) satisfying urban demands only, (2) satisfying both urban and environmental demands, and (3) securing adequate reservoir storage. Here, 'sufficient water' means that enough water exists within a city's supply basin to satisfy sectoral demands in each scenario.
Table 3. Number and percent of cities meeting demand and cities that are vulnerable under three reallocation strategies.
| Strategy | Demand met- no reallocation | Demand met- after reallocation | Remaining vulnerable |
|---|---|---|---|
| Reallocation through environmental neglect to satisfy | |||
| Urban demand only | 35 (49%) | 52 (73%) | 19 (27%) |
| Reallocation through agricultural transfers to satisfy | |||
| Urban demand only (% of all cities) | 35 (49%) | 51 (72%) | 20 (28%) |
| Urban and environmental demand (% of all cities) | 18 (25%) | 28 (39%) | 43 (61%) |
| Storage security (% of all cities)a | 10 (14%) | 13 (18%) | 15 (35%) |
| Reallocation through combined environmental neglect and agricultural transfers to satisfy | |||
| Urban demand only (% of all cities) | 35 (49%) | 58 (82%) | 13 (18%) |
aPercent totals for reallocation through agricultural transfers to satisfy storage security do not add to 100% since there are only 28 cities with reservoir storage.
Growing demand for freshwater will likely force human needs to be placed ahead of environmental requirements. As such, the first strategy is reallocation through environmental neglect in which cities divert all water available for maintaining minimum environmental flows to meet urban needs. Under this strategy agricultural demands are also met, such that neither the urban or agricultural sectors are threatened. Of the 71 cities included in this study, the number of cities that could support urban demands in 2040 increases from 35 to 52 when exercising environmental neglect reallocation (table 3). Urban sector threats alone are reduced in 14 otherwise vulnerable and 29 threatened cities, where 9 cities remain non-threatened. Those aided by reallocation through environmental neglect include 5 of the 7 cities-of-concern likely to become vulnerable by 2040, with only Ouagadougou and Charlotte failing to benefit.
The second strategy reallocates water from agriculture to urban use and shows similar benefits to reallocation by environmental neglect for 51 versus 52 cities. However, agricultural reallocation preserves environmental flows, and shows that roughly the same benefit can be gained without further damage to freshwater-dependent ecosystems. Under this strategy, urban sector threats are reduced in 16 otherwise vulnerable and 26 threatened cities, whereas 9 cities remain non-threatened. Reallocation from agriculture leaves 28% of the 71 cities (including the cities-of-concern Ouagadougou, Charlotte, and Dublin) unable to meet urban demands. Additionally, under reallocation of irrigation water, the number of cities for which both urban and environmental demands are met increases from 18 to 28, and the number able to achieve reservoir storage security increases from 10 to 13 cities (table 3). Water available only from agricultural transfers could only support both urban and environmental demands in 3 of the 10 cities-of-concern (Guangzhou, Nanjing, Wuhan) that become more vulnerable between 2010–2040. A combination of environmental neglect and agricultural transfers would leave only Ouagadougou vulnerable in 2040.
4. Conclusions
Cities here are considered 'vulnerable' when they exceed minimum thresholds for human, environmental, and storage requirements. Those cities exceeding some but not all three thresholds are considered 'threatened.' The nature of urban vulnerability discussed here is exclusively focused on large cities judged most at risk for water scarcity because they lack source water diversity. By 2040, 32 of 71 large cities relying on surface water are predicted to become vulnerable. This represents an increase from 35% vulnerable in 2010 to 45% in 2040. In the majority of cases, the number of cities unable to meet human-based demands is likely to outstrip the number of cities for which minimum flow requirements of freshwater-dependent ecosystems are not met. The number of vulnerable river-supplied cities greatly exceeds reservoir-supplied cities in 2010 (tenfold) and 2040 (fivefold). Of large surface-water dependent cities in 2010, 83% are either vulnerable or threatened. This increases to 87% in 2040.
Although the majority of threatened cities are reservoir-supplied, artificial storage currently offers far more security to cities using reservoirs. This is indicated by the substantially lower number of vulnerable reservoir-supplied (18%) versus river-supplied cities (63%) in 2040. In particular, reservoirs may have allowed some cities to delay vulnerability in the near future, but the high number of threatened cities suggest that the large financial investments made in the past to improve water security through reservoir storage may no longer be sufficient to prevent future vulnerability. It is surprising that reservoir-supplied cities account for 6 of the 10 cities-of-concern showing an increase in vulnerability or threat status (susceptible cities) by 2040. This suggests that the temporal buffering capacity alone will no longer be adequate to meet both increasing urban and agricultural demands as well as accommodate environmental needs.
Large cities can meet urban demand via reallocation by 2040. Reallocation through environmental neglect enables 52 of 71 cities to meet urban demand, and transfers of irrigation water enable 51 cities to meet urban demand. This compares favorably to just 35 cities meeting urban demand when no reallocation exists. Agricultural transfers have the benefit of lessening urban sector threats while reducing the number of cities experiencing environmental and storage threats. However, reallocation of irrigation water by 2040 can enable both urban and environmental demands to be met in only an additional 14% of cities. Of the ten cities-of-concern becoming vulnerable by 2040, only Ouagadougou, Burkina Faso, does not benefit from any reallocation method—even if both environmental and agricultural supplies are both transferred. Source diversification is essential in this and other regions.
These results offer much-needed insights into urban supply vulnerability, but are subject to limitations that accompany the majority of data mining studies. In using pre-existing databases from multiple sources, these analyses accommodate differences in data quality and coverage (e.g., little data on urban water supply and demand information at appropriate spatial and temporal resolutions), which undoubtedly introduce error and restrict quantification of uncertainty. As such, these analyses only provide insights into the likely trends in urban supply vulnerability. Further investigations of how adaptations to water scarcity and climate change will impact both river- and reservoir-supplied cities would greatly add to our understanding of urban water vulnerability, and are necessary for urban water managers pursuing policies aimed at long-term water supply sustainability.
Acknowledgments
This research was supported by the Global Freshwater Initiative through Stanford's Woods Institute for the Environment. The authors would like to thank Rob McDonald and the City Water Map Initiative team for access to their database. This work was supported in part by the National Science Foundation under grant GEO/OAD-1342869 to Stanford University. Any opinions, findings, and conclusions or recommendations expressed in this material are those of the authors and do not necessarily reflect the views of the National Science Foundation.