
Abstract
Changes in permafrost distribution in the southern discontinuous zone were evaluated by repeating a 1964 survey through part of the Alaska Highway corridor (56° N–61° N) in northwest Canada. A total of 55 sites from the original survey in northern British Columbia and southern Yukon were located using archival maps and photographs. Probing for frozen ground, manual excavations, air and ground temperature monitoring, borehole drilling and geophysical techniques were used to gather information on present-day permafrost and climatic conditions. Mean annual air temperatures have increased by 1.5–2.0 ° C since the mid-1970s and significant degradation of permafrost has occurred. Almost half of the permafrost sites along the entire transect which exhibited permafrost in 1964 do so no longer. This change is especially evident in the south where two-thirds of the formerly permafrost sites have thawed and the limit of permafrost appears to have shifted northward. The permafrost that persists is patchy, generally less than 15 m thick, has mean annual surface temperatures >0 ° C, mean ground temperatures between −0.5 and 0 ° C, is in peat or beneath a thick organic mat, and appears to have a thicker active layer than in 1964. Its persistence may relate to the latent heat requirements of thawing permafrost or to the large thermal offset of organic soils. The study demonstrates that degradation of permafrost has occurred in the margins of its distribution in the last few decades, a trend that is expected to continue as the climate warms.
Export citation and abstract BibTeX RIS

Content from this work may be used under the terms of the Creative Commons Attribution 3.0 licence. Any further distribution of this work must maintain attribution to the author(s) and the title of the work, journal citation and DOI.
1. Introduction
In 1964, the late Brown, a pioneer in Canadian permafrost science, conducted a survey of permafrost conditions at sites adjacent to the Alaska Highway in northern British Columbia and southern Yukon (Brown 1967). These baseline data come from permafrost zones classified as isolated patches (<10% of the area underlain by permafrost) or sporadic discontinuous (10–50%) (Heginbottom et al 1995) where permafrost bodies are scattered, thin, and vulnerable to climate warming impacts (e.g. Kwong and Gan 1994, Romanovsky et al 2010, Smith et al 2010). Furthermore, climate records from this region indicate a trend of rising temperatures beginning about ten years after the 1964 survey.
Our study focused on locating Brown's sites and evaluating their current permafrost condition. The first goal was to assess whether changes in permafrost had occurred, and if so, whether they could be linked to multi-decadal climate change. The demonstration of loss of permafrost would be significant field-based support of modelled predictions of future thaw (AMAP 2011, Anisimov and Nelson 1997, Bonnaventure and Lewkowicz 2013, IPCC 2007). A second objective was to examine the environmental conditions and characteristics of permafrost that had persisted in order to assess its vulnerability to future change. With this in mind, monitoring of air and ground temperatures was initiated at selected sites.
2. Study area
The study transect duplicates that of Brown (1967), extending 1330 km along the Alaska Highway from approximately 80 km north of Fort St John, BC (56° N 121° W) to Whitehorse, YT (61° N 135° W) (supplementary material figure S1, available at stacks.iop.org/ERL/8/045013/mmedia).
The climate of the region is subarctic and continental, with mean annual air temperatures (MAATs) at government climate stations of −3–+2 ° C and annual precipitation of 270–470 mm (table 1). Brown's 1964 survey was preceded by roughly 20 years of stable or declining MAATs (figure 1). A decade of cooling followed and then MAATs began to rise, with an increase of 1.5–2.0 ° C by 2007–2008 (figure 1).
Table 1. Climate normals (1971–2000) of main stations along the study transect. (Data source: Environment Canada (2012). 30-year periods shown are standard normals.)
| Station | Latitude (° N) | Longitude (° W) | Elevation (m asl) | Mean annualair temperature(° C) | Change inMAATbetween1961–1990 and1971–2000 (° C) | Mean annual precipitation (mm) | Mean annual snowfall (cm) |
|---|---|---|---|---|---|---|---|
| Fort St John, BC | 56° 14' | 120° 44' | 695 | +2.0 | +0.4 | 466 | 186 |
| Fort Nelson, BC | 58° 50' | 122° 36' | 382 | −0.7 | +0.4 | 452 | 178 |
| Watson Lake, YT | 60° 72' | 128° 49' | 687 | −2.9 | +0.3 | 404 | 197 |
| Whitehorse, YT | 60° 42' | 135° 04' | 706 | −0.7 | +0.2 | 267 | 145 |

Figure 1. Mean annual air temperature at Fort St John, BC (diamonds) and Whitehorse, YT (circles) from 1943 to 2008 (data source: Environment Canada 2012). The dashed lines are the long-term MAATs over the time period, and the solid black lines are 5-year running means.
Download figure:
Standard image High-resolution imageThe study area falls within the Boreal Cordillera, Taiga Plains and Boreal Plains ecoregions (Environment Canada 2005). All sites are below the altitudinal treeline of 1350–1500 m above sea level (asl), and the entire transect is forested except in human-made clearings, active alluvial fans, or areas of poor drainage. Brown (1967) appears to have preferentially selected sites beneath stands of black spruce (Picea mariana), commonly stunted and poorly drained, presumably because his goal was to locate permafrost. Other species present in the area include white spruce (Picea glauca), tamarack (Larix laricina), subalpine fir (Abies lasiocarpa), lodgepole pine (Pinus contorta), aspen (Populus tremuloides), balsam poplar (Populus balsamifera) and paper birch (Betula papyrifera) (Wahl et al 1987). Dwarf birch (Betula nana) and willow (Salix spp.) are commonly present in low-lying, poorly drained areas, as are various mosses, lichens, sedges and labrador tea (Ledum palustre), which are also present as an understorey in the forest.
3. Methods
A total of 55 of Brown's sites between Whitehorse and Fort St John were located during fieldwork in 2007 (8–29 August) and 2008 (4–27 August) (supplementary material figure S1). Archival photos (supplementary material figure S2, available at stacks.iop.org/ERL/8/045013/mmedia), site descriptions, archived maps and a hand-held GPS were used to locate the sites (see the supplementary material). At each study site, the presence or absence of frozen ground was determined to a depth of 2 m or to the frost table (whichever was shallower) and additional site characteristics were described (see the supplementary material).
Six permafrost sites distributed along the study transect (supplementary material figures S1 and S3, available at stacks.iop.org/ERL/8/045013/mmedia) were instrumented in August 2007 to examine air and ground surface temperatures where perennially frozen ground has persisted (see the supplementary material). Additional information on permafrost conditions was acquired from thermistors installed in three shallow boreholes to measure temperatures in the upper 4 m of the ground (details in the supplementary materials), through electromagnetic (EM) induction surveys, and electrical resistivity tomography (ERT) (see the supplementary material).
4. Results
Results focus on changes in the permafrost distribution, active layer thickness and climate between 1964 and 2007–2008, and on the present-day climate and characteristics of sites where permafrost has persisted.
4.1. Change in near-surface permafrost distribution
In 1964, Brown found a (perma)frost table at 57% of his 86 sites, and no evidence of permafrost at 43% (Brown 1967, table 2). Almost the same distribution applies to the sub-set of 55 sites that we located in 2007–2008: 56% had permafrost in 1964 and 44% had no permafrost in the same year (Brown 1967). The sub-set is therefore considered to be representative of the original survey.
None of Brown's non-permafrost sites exhibited a frost table within 2 m of the ground surface during 2007–2008. Therefore, permafrost did not develop at any non-permafrost site. In contrast, almost half of the sites where permafrost was observed in 1964, no longer exhibited it in 2007 (figure 2, table 2).
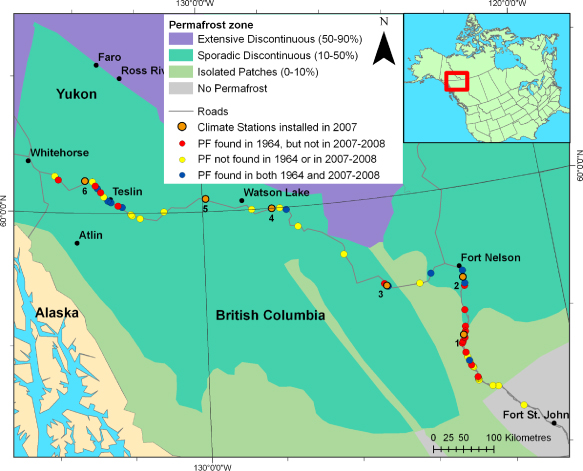
Figure 2. Changes in site permafrost (PF) conditions between 1964 and 2007–2008 in relation to permafrost zonation (after Heginbottom et al 1995). Note that some sites appear coincident at this scale.
Download figure:
Standard image High-resolution imageTable 2. Near-surface permafrost presence along the study transect. (Note: numbers of sites shown in parentheses.)
| Transect segment | Sites | 1964 | 2007–2008 | ||
|---|---|---|---|---|---|
| Permafrost present | Permafrost absent | Permafrost present | Permafrost absent | ||
| Fort St John to Fort Nelson (390 km) | 26 | 58% (15) | 42% (11) | 19% (5) | 81% (21) |
| Fort Nelson to Watson Lake (565 km) | 11 | 55% (6) | 45% (5) | 45% (5) | 55% (6) |
| Watson Lake to Whitehorse (450 km) | 18 | 56% (10) | 44% (8) | 33% (6) | 67% (12) |
| Complete transect examined in 2007–2008 | 55 | 56% (31) | 44% (24) | 29% (16) | 71% (39) |
| Complete transect examined in 1964 | 86 | 57% (49) | 43% (37) | ||
Sites along the 400 km of the transect south of Fort Nelson represent half of those where Brown found permafrost but two-thirds of those where permafrost appears to have thawed (figure 2, table 2). Only one of the six permafrost sites between Fort Nelson and Watson Lake changed to non-permafrost by 2007. Between Watson Lake and Whitehorse, 40% of the sites with permafrost in 1964 exhibited none in 2007.
The southernmost occurrence of permafrost found during 2007–2008 was at MP 178.0 (57° 25'N, 122° 51'W). Brown found a frost table at MP 154.7 (57° 10'N, 123° 18'W), but none was found in 2007–2008. He also observed frozen ground at MP 94.4 in 1964 but this site could not be definitively located in 2007–2008.
4.2. Active layer thickness
Frost probing and excavations in August 2007 and 2008 were conducted 4–6 weeks before maximum thaw (based on ground temperature measurements). Therefore, the measurements represent minimum permafrost table depths.
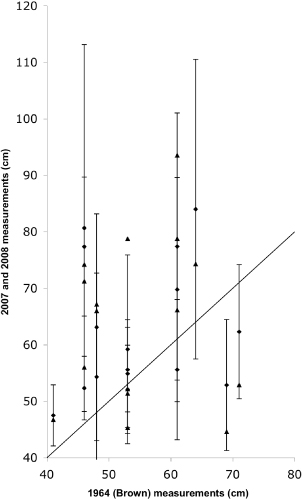
Frost table depths were highly variable, both within and between sites (figure 3). The mean active layer in 1964, calculated from Brown (1967), was 55 cm, whereas the mean measured depth to frozen ground for the same sites in 2007 and 2008 was 63 cm, which is significantly different statistically (p < 0.01). However, a lack of information about Brown's methods (number of samples, spacing and exact locations) makes it impossible to assess whether the active layer thickness at a given site had actually changed. Furthermore, it is possible that at some sites probing traversed not only the active layer but also a thin supra-permafrost talik. Due to these uncertainties, inferences drawn from the comparisons between the investigations in 1964 and those in 2007–2008 remain tentative.
Figure 3. Scattergram of frost table depths (where found) in September 1964 and August 2007 and 2008. Diamonds represent comparisons between 1964 and 2007; triangles represent those between 1964 and 2008. Bars represent standard deviations of the 2007 and 2008 data. The n for the 2007 and 2008 measurements ranges from 3 to 20. The 1:1 line is shown.
Download figure:
Standard image High-resolution image
4.3. Climatic change
Climate records from the four main government stations on the transect date from 1943 (with some gaps in the records at Watson Lake and Whitehorse in the late 1990s). Records were examined to determine if there were statistically significant (p < 0.05) trends in MAAT, freezing degree-days (FDD), thawing degree-days (TDD), annual rainfall, annual snowfall and total precipitation in the 1943–1964 period (prior to Brown's survey) and the 1965–2008 period (following Brown's survey).
The 1964 survey followed 22 years in which only total snowfall exhibited a significant linear trend at all climate stations, an increase of 24–68 cm/decade (table 3). The increase was particularly strong at Fort St John where the average annual snowfall nearly doubled over 22 years from 129 to 238 cm. This also resulted in a significant increase in total annual precipitation. At Fort Nelson a significant decrease in TDD (70 TDD per decade) indicates summer cooling but such a change was not observed elsewhere. It can therefore be concluded that the major pre-conditioning of ground temperatures in the two decades preceding Brown's survey was the increase in snowfall, particularly in the Fort St John area, which would have had a warming impact.
Table 3. Linear trends in climatic variables at the main stations along the study transect, 1943–1964 and 1965–2008. (Note: linear trends shown are significant at the 0.05 level or better. Slopes are in units at the top of each column per year. Data source: Environment Canada (2012).)
| Station | Number of years of record | MAAT (° C) | FDD (° C days) | TDD (° C days) | Annual rainfall (mm) | Annual snowfall (cm) | Annual precipitation (mm) | ||||||
|---|---|---|---|---|---|---|---|---|---|---|---|---|---|
| Slope | r2 | Slope | r2 | Slope | r2 | Slope | r2 | Slope | r2 | Slope | r2 | ||
| Fort St John 1943–1964 | 22 | Not significant | Not significant | Not significant | Not significant | 6.8 | 0.52 | 10.0 | 0.35 | ||||
| Fort Nelson 1943–1964 | 22 | Not significant | Not significant | −7.1 | 0.19 | Not significant | 2.8 | 0.18 | Not significant | ||||
| Watson Lake 1943–1964 | 22 | Not significant | Not significant | Not significant | Not significant | 3.7 | 0.26 | Not significant | |||||
| Whitehorse 1943–1964 | 22 | Not significant | Not significant | Not significant | Not significant | 2.4 | 0.21 | Not significant | |||||
| Fort St John 1965–2008 | 44 | 0.053 | 0.25 | −14.0 | 0.20 | Not significant | Not significant | Not significant | Not significant | ||||
| Fort Nelson 1965–2008 | 44 | 0.040 | 0.25 | −14.9 | 0.22 | Not significant | Not significant | Not significant | Not significant | ||||
| Watson Lake 1965–2008 | 39 | 0.051 | 0.37 | −15.6 | 0.25 | 4.4 | 0.24 | Not significant | Not significant | 1.8 | 0.12 | ||
| Whitehorse 1965–2008 | 42 | 0.051 | 0.28 | −15.9 | 0.20 | 3.7 | 0.10 | Not significant | Not significant | Not significant | |||
The 2007–2008 surveys followed three to four decades of warming, especially in winter (table 3). MAAT increased on average by 0.4–0.5 ° C/decade and FDD declined by 140–160/decade (i.e. winter warming). At Watson Lake and Whitehorse, TDD significantly increased but at a much lower rate (37–44/decade) than the contemporaneous decline in FDD. The only significant change in precipitation was an average increase of 18 mm/decade at Watson Lake.
4.4. Current climatic and active layer conditions at monitoring sites
MAATs recorded from 2007 to 2012 at the six monitoring sites along the transect ranged from −3.3 to −1.1 ° C while the mean annual ground surface temperatures (MAGSTs) varied from 0.3 to 2.5 ° C with the highest values at portions of the monitoring sites without permafrost (table 4). Mean ground temperatures close to or at the depth of the top of permafrost (TTOP) were higher than −0.5 ° C with a maximum value of +0.6 ° C at part of a monitoring site that was seasonally frozen.
Table 4. Air and ground temperatures at the Alaska Highway monitoring sites, 2007–2012. (Note: records run from mid-August 2007 to mid-August 2012 unless otherwise indicated. Missing months due to logger failure were either filled by cross-correlation with nearby stations or omitted from average 'blended year' calculation.)
| Site (see figures 2 and S1 available at stacks.iop.org/ERL/8/045013/mmedia) | Location | Elevation (m asl) | Mean annualairtemperature (° C) | Mean annual ground surface temperature (° C) | Mean annualtemperature near/atthe top of permafrostor near/at the base ofseasonal freezing (° C) | Mean surface offset (° C) | Meanthermaloffset (° C) | Mean nt | Mean nf | Rationf/nt |
|---|---|---|---|---|---|---|---|---|---|---|
| 1 | MP 208.5 | 771 | −1.5a | 1.4a | −0.3b(50 cm) | 2.9 | −1.7 | 0.88c | 0.36d | 0.41 |
| 2 | MP 286.0 | 417 | −1.1e | 0.9f–1.4f | −0.1a (100 cm) | 2.0–2.4 | −1.4 to −1.0 | 0.70g | 0.47h | 0.67 |
| 3 | MP 400.5 | 1043 | −1.9i | 1.0a–2.5j | 0.3f (100 cm) | 2.8–4.4 | −2.5 to −0.7 | 0.90g | 0.39e | 0.43 |
| 4 | MP 597.5 | 682 | −1.5g | 0.3k–1.5e | −0.3h to −0.1k (100 cm) | 1.7–3.0 | −1.6 to −0.5 | 0.87g | 0.31j | 0.36 |
| 5 | MP 681.1 | 849 | −3.3l | 0.8j–1.4j | −0.3m–0.6m (65 cm) | 4.2–4.8 | −1.1 to −0.8 | 0.87n | 0.39o | 0.45 |
| 6 | MP 844.1 | 813 | −2.3p | 0.7q–1.4r | −0.5s(100 cm) | 3.0–3.7 | −1.4 to −1.2 | NA | 0.35t | NA |
aSeptember 2007–July 2011. bSeptember 2007–July 2009. c2008. d2007–2009. eSeptember 2007–July 2012. fSeptember 2010–June 2012. g2008–2011. h2008–2011. iAugust 2007–April 2012. jSeptember 2010–July 2012. kSeptember 2010–April 2012. lSeptember 2007–July 2008, June 2009–April 2010, cross-correlation from September 2010–July 2012. mAugust 2010–August 2011. n2011. o2007–2009, 2010–2012. pAugust 2007–May 2009, October 2009–April 2010, cross-correlation August 2010–July 2011, cross-correlation September 2011–June 2012. qSeptember 2010–March 2012. rAugust 2007–May 2009, October 2009–July 2011, September 2011–July 2012. sAugust 2007–May 2009, October 2009–July 2011. t2007–2008, 2010–2012.
Freezing n-factors (nf), calculated as the ratio of the ground surface freezing to the air freezing index (Karunaratne and Burn 2004, Lunardini 1978), ranged from 0.31 to 0.47 (table 4). These values are similar to those measured at forested permafrost sites in the Takhini River valley 50 km to the west of Whitehorse (Karunaratne and Burn 2004) and elsewhere in the southern Yukon (median of 0.29: Lewkowicz et al 2012). Thawing n-factors (nt), calculated as the ratio of the ground surface thawing index to the air thawing index, ranged from 0.70 to 0.90 with the highest values for the most open sites. These are comparable to the median value of 0.83 obtained for forested sites in the southern Yukon (Lewkowicz et al 2012). Ratios of nf to nt ranged from 0.36 to 0.67 (table 4) indicating that the relative impact of a unit change in air FDD on ground surface temperature is smaller than an equivalent change in air TDD.
Surface offsets (MAGST–MAAT) ranged from 1.7 to 4.8 ° C and are associated with mean ground surface temperatures at all sites that exceed 0 ° C (table 4). Thermal offsets (TTOP–MAGST), which under equilibrium conditions are a function of the differing thermal conductivities of frozen and thawed active layer (Karunaratne and Burn 2004) and hence soil type and soil moisture, ranged from −2.5 to −0.5 ° C (table 4).
4.5. Ground temperatures at borehole sites
Average ground temperatures measured in the three boreholes were all very close to 0 ° C, and the difference from 0 ° C and the change in temperature through the year at depths below 1 m were often smaller than the nominal accuracy and resolution of the instrumentation (table 5). Temperatures at MP 788.5 and MP 825.2 indicate that the boreholes did not reach the base of permafrost and this was supported by the ERT surveys that indicate permafrost extends to depths of 10 m and 8 m, respectively (table 6). The depth of zero annual amplitude (annual range < 0.1 °C) at these sites is between 1.5 and 2.0 m, and reflects the rapid damping out of the annual temperature wave by changes in unfrozen moisture at temperatures within a few hundredths of a degree of 0 ° C.
Table 5. Mean ground temperatures in boreholes at Alaska Highway monitoring sites.
| MP 286.0 (2010–2011) | MP 788.5 (2010–2011) | MP 825.2 (2009–2011) | |||
|---|---|---|---|---|---|
| Depth (m) | Mean annual temperature (range) (° C) | Depth (m) | Meanannualtemperature(range) (° C) | Depth (m) | Mean annualtemperature(range) (° C) |
| 0.5 | NA | 0.5 | −0.2 (4.8) | 0.5 | 0.4 (5.8) |
| 1.0 | 0.2 (1.1) | 1.0 | −0.1 (1.0) | 1.0 | 0.0 (0.3) |
| 1.5 | 0.1 (0.1) | 1.5 | −0.1 (0.2) | 1.5 | 0.0 (0.0) |
| 2.0 | 0.2 (0.1) | 2.0 | −0.1 (0.1) | 2.0 | −0.1 (0.0) |
| 2.4 | 0.3 (0.1) | 2.5 | −0.1 (0.1) | 2.5 | NA |
| 3.0 | −0.1 (0.1) | 3.0 | NA | ||
| 3.75 | 0.0 (0.1) | 4.0 | −0.1 (0.0) | ||
Table 6. Results of geophysical surveys along the study transect.
| Site | 2007/2008 manual investigations | Frost table depths on EM31 transect (cm) | Inferred ground conditions from EM31 survey | Inferred ground freezing conditions from ERT surveys (2008 and 2010–2012) |
|---|---|---|---|---|
| MP 178.0 | Permafrost present | 86–>150 | Thin permafrost (three layered) | Permafrost 2–5 m thick |
| MP 208.5 | Permafrost present | 41–58 | Thin permafrost (three layered) | NA |
| MP 286.0 | Permafrost present | 52–133 | Thin permafrost (three layered) | Permafrost 2–5 m thick |
| MP 341.3 | Permafrost present | 51–>135 | Thin permafrost (three layered) | Seasonal frost, and permafrost 2–4 m thick |
| MP 400.5 | Permafrost present | 45–115 | Variable (two and three layered) | Permafrost 5–>25 m thick |
| MP 587.6 | No frost table to 182 cma | None | No permafrost (one layer) | NA |
| MP 597.5 | Permafrost present | 37–51 | Thin permafrost (three layered) | Permafrost 5–10 m thick |
| MP 681.1 | Permafrost present | 35–135 | Variable (one, two and three layered) | Seasonal frost, and permafrost 5–10 m thick |
| MP 771.6 | Undeterminedb | None | No permafrost (one layered) | NA |
| MP 774.0 | Undeterminedb | None | No permafrost (one layer) | NA |
| MP 788.5 | Permafrost present | NA | NA | Seasonal frost, and permafrost 2–15 m thick |
| MP 825.2 | Permafrost present | 36 to >135 | Variable (one, two and three layered) | Seasonal frost, and permafrost 5–12 m thick |
| MP 844.1 | Permafrost present | NA | NA | Permafrost 3–4 m thick |
aManually impenetrable below 182 cm due to highly cohesive clay. bManually impenetrable below 30 cm due to a gravel layer.
The borehole at MP 286.0 completely penetrated the frozen ground when it was drilled in 2008 but the 0.7 m of permafrost subsequently thawed around the borehole resulting in average temperatures exceeding 0 ° C to a depth of 2.4 m (table 5). However, this was a localized disturbance as the active layer temperature measurements and ERT profiles from the site indicate that permafrost persists elsewhere with its base at 4–5 m (supplementary material figure S5(A), available at stacks.iop.org/ERL/8/045013/mmedia).
The average active layer thickness at the three borehole sites appears to have increased between 1964 and 2007–2008, as is the case at other sites (figure 3). Active layers were 35, 70 and 34% thicker in 2007–2008 compared to those measured by Brown (1967) in 1964 at MP 825.2, MP 788.5 and MP 286.0, respectively.
4.6. Geophysical surveys
Thirteen sites were investigated using EM, ERT or both techniques (table 6). Of the eight permafrost sites investigated using EM, five were inferred to have thin permafrost at the sample points (three layered with a permafrost base shallower than the instrument's maximum depth of exploration of 4.6–6 m), and three were variable in their layering, with the transect having points with evidence of one layer (seasonally unfrozen ground), two layers (permafrost thicker than about 6 m overlain by an active layer), and three layers (table 6).
The ERT survey lines are longer than the EM transects and were not completely coincident. ERT results generally concur with the EM interpretations but provide better visualization of the variability of permafrost thickness and continuity (e.g. Lewkowicz et al 2011). They show that the thickness of the permafrost bodies generally varies between 5 and 10 m with a few up to 15 m and one site (MP 400.5) where permafrost extends below 25 m (table 6; supplementary material figure S5).
5. Discussion
5.1. Persistence of permafrost
Mean ground surface temperatures at all six monitoring sites are >0 °C (table 4). If ground temperatures at these sites are in equilibrium, permafrost is being maintained by the thermal offset. The surface organic layer plays an important role in affecting the size of the thermal offset and hence the presence of permafrost (see the supplementary material) and there is a noticeable association at many sites between rises in micro-topography of a few cm, a drier surface and the presence of permafrost. This is explained by the low thermal conductivity of the organic layer when it is dry and thawed in the summer months, and a higher thermal conductivity in the winter, when it is wetter and frozen (Smith and Riseborough 2002). The thermal offset is regarded as critical in determining the southernmost extent of discontinuous permafrost (Shur and Jorgenson 2007, Smith and Riseborough 1998, 2002) and as a result, permafrost most often exists in peatlands near its limit (Brown 1970, Brown and Péwé 1973, Shur and Jorgenson 2007, Zoltai 1971). A thick organic layer was virtually a prerequisite for permafrost to be present in at sites in 1964 but it did not guarantee that permafrost would persist until 2007–2008 (supplementary material figure S4, available at stacks.iop.org/ERL/8/045013/mmedia).
An alternate explanation for permafrost persistence is based on some sites being in thermal disequilibrium, which appears probable, given the recent warming in climate (see figure 1). In this case, the net positive heat flow into the ground is so small that it takes decades for the latent heat of the permafrost to be satisfied and for complete thaw to occur (Smith et al 2005, 2010). The apparent thermal offset is then an effect, not a cause, of permafrost persistence. It is also possible that supra-permafrost taliks have developed at some sites which we characterize as no longer having permafrost and that thawing is actually occurring at depth. However, we did not find evidence of this in any of the ERT surveys.
Given that our monitoring sites were selected solely to be relatively evenly spaced along the transect, mean ground temperatures at the intervening permafrost sites are also probably between −0.5 and 0 ° C with similarly thin bodies of permafrost. In terms of the conceptual model of Shur and Jorgenson (2007), most of the permafrost along the study transect is therefore ecosystem-protected and persists only because of the insulation provided by the surface buffer layer. Where MAAT > − 2 °C (i.e. four of the six sites in table 4) permafrost would likely degrade completely following future disturbance by fire or human activity (Shur and Jorgenson 2007). This permafrost may have been formed in the Little Ice Age or earlier (Beilman et al 2001, Camill and Clark 2000, Halsey et al 1995, Shur and Jorgenson 2007, Vitt et al 1994). Some sites which were probably fire-disturbed, nevertheless preserved permafrost between 1964 and 2007–2008 (see the supplementary material), but all of the suspected fires occurred prior to 1950 when conditions were colder than at present and there was less snow. These sites were therefore ecosystem-driven in the middle of the 20th century: pre-existing permafrost was cold enough that it could persist at depth following disturbance and eventually recover as vegetation succession occurred. Under the current warmer conditions, they are now considered to be ecosystem-protected.
A minority of sites, such as MP 681.1 (MAAT −3.3 ° C), may still be cold enough to be ecosystem-driven. There, permafrost might re-establish following a hypothetical disturbance providing there is no future climatic warming.
If the calculated increase in mean frost table depth between 1964 and 2007–2008 is real and not the product of sampling differences, the possibility that this change relates to air temperatures in the measurement thaw seasons themselves can be ruled out. An analysis of TDD accumulated prior to site visits (made later in the summer in 1964) shows that the totals at government climate stations in 1964 were 1–22% higher than in 2007 and 2008. Since thaw depths are proportional to the square root of TDD, providing soil conditions remain constant (e.g. Lewkowicz 1994, Smith et al 2009), they should have been 1–12% shallower in 2007–2008 compared to 1964, not deeper. The observed increase could relate to a variety of factors, including changes in soil moisture conditions, warmer active layer temperatures at the end of winter (IPCC 2007, Smith et al 2009), or progressive warming of the permafrost.
Long-term monitoring may reveal whether permafrost at our monitoring sites is in equilibrium with the current climate, but given the rise in MAAT over the past few decades and the loss of permafrost at many sites along the transect, it appears probable that it is slowly thawing internally as ground temperatures approach 0 ° C and unfrozen water contents gradually increase. One result is that the depths of zero annual amplitude, while similar to those at forested warm permafrost sites elsewhere in western North America, are much shallower than at cold permafrost sites (Romanovsky et al 2010, Throop et al 2012).
5.2. Change in permafrost distribution as an indicator of climate warming
Permafrost present in isolated patches at the southern fringe of discontinuous permafrost will eventually thaw with a warming climate (ACIA 2005, Camill 2005, Halsey et al 1995) and the southernmost limit of permafrost is expected to shift northward several hundred kilometres during the 21st century (ACIA 2005). Comparative permafrost distributions can therefore be used as a proxy indicator of climatic warming (Kwong and Gan 1994). However, caution must be exercised when extrapolating atmospheric temperature trends to ground temperatures in the shorter term, because other factors, such as changes in vegetation, precipitation (especially snow), the organic layer (due to fire), human activities, surface drainage and groundwater flow, can cause alterations to ground thermal conditions leading to permafrost thaw (e.g. Osterkamp 2007, Smith and Riseborough 1983). Degradation of permafrost at an individual site, therefore, does not automatically equate to evidence of climate warming (Burn 1998, Osterkamp 2007).
Some studies have concluded that climate warming affected permafrost distribution in Canada by the end of the 20th century. Kwong and Gan (1994), for example, found a 120 km shift northward in permafrost boundaries in northern Alberta and southern NWT that appeared to have occurred over the course of about 30 years (to 1994). Halsey et al (1995) concluded that permafrost zones were translocating northward, but that air temperature isotherms were shifting more rapidly, indicating that loss of permafrost extent is lagging behind climate change. French and Egorov (1998) interpreted changes in permafrost distribution in northern Manitoba as being due to climatic effects on marginal permafrost. Significant changes were also reported from the James Bay area in Québec where the southern boundary of permafrost in bogs has moved 130 km northward over the past 50 years (Thibault and Payette 2009).
Our results show that since Roger Brown's 1964 survey, permafrost has disappeared from many sites, particularly those in the southern parts of the transect and in the warmer section near Whitehorse. Consequently, the southern limit of permafrost appears to have shifted northward by at least 25 km and by 75 km if the permafrost present in 1964 at MP 94.4 (not definitively relocated in 2007–2008) has degraded, as seems likely. If the study sites are not in thermal equilibrium, it is probable that thawing will occur at more of them over the next few decades even if climate were to remain stable. However, given that further warming is expected (ACIA 2005), almost all of the sites adjacent to this part of the Alaska Highway will eventually thaw. Permafrost can be expected to be preserved only above treeline in adjacent mountains where it is currently extensive or continuous (Bonnaventure et al 2012, Bonnaventure and Lewkowicz 2013).
A rise of 1.5–2.0 ° C in MAAT provides an explanation for the loss of permafrost between 1964 and 2007–2008, in spite of the fact that this was mainly due to a reduction in FDD from which the ground is buffered by the snow layer. The measured n-factors indicate that a change of air freezing degree-days has only 36–67% of the impact on annual ground surface temperature of a numerically equal change in thawing degree-days (table 4). However, there were significant trends in TDD for only part of the transect. The increase in snowfall prior to the 1964 survey and to a lesser extent the effects of a presumed early 20th century warming prior to the start of records in 1943, may also have had an effect.
It is possible that our assumptions regarding Brown's selection of sites and our attempt to duplicate this choice in the field (i.e. to search for permafrost-probable sites) could have biased our results. In addition, the calculated percentage change could have been affected by our exclusions of sites from the dataset in the southern part of the transect because of a lack of confidence in their location due to land use change or because they are no longer accessible. The impact of these two factors would have been to reduce the estimated percentage loss of permafrost, so that if they played a role, our results regarding the degree of change are conservative.
6. Conclusions
Significant degradation of permafrost has occurred in terrain adjacent to 1300 km of the Alaska Highway in northern British Columbia and southern Yukon over the past four decades, especially in the southernmost part of the transect where 67% of the individual permafrost sites examined in 1964 no longer exhibit perennially frozen conditions. As a result, permafrost maps should be redrawn with the southern limit of permafrost displaced northward in this area.
Where permafrost has persisted, it is patchy, generally present in peat or beneath a thick organic mat, exists at mean ground temperatures between −0.5 and 0 ° C and is usually less than 15 m thick. Most of this permafrost is probably in thermal disequilibrium with the current climate and has persisted because the significant latent heat needed to complete thaw has not yet been satisfied. However, it is possible that some of the permafrost is in thermal equilibrium with mean surface temperatures exceeding 0 ° C, in which case the thermal offset is critical for its existence.
The changes in permafrost in the region are attributed to an increase in mean annual air temperature of 1.5–2.0 ° C, concentrated in the period from 1972 to 1987, and primarily through a reduction in freezing degree-days. Forest fire and increases in snowfall prior to 1964 may also have helped pre-condition loss of frozen ground at some sites. Given its temperature, almost all the remaining permafrost is ecosystem-protected and is sensitive to any further warming or surface disturbance. It will certainly thaw if the current predictions of climate change manifest over the next century, thereby affecting local hydrology, vegetation and carbon cycling in this part of the Alaska Highway corridor and elsewhere in the southern margins of the permafrost zone.
Acknowledgments
Financial support for this project was provided by the Federal Government of Canada's International Polar Year Program (Thermal State of Permafrost in Canada Project), the NSERC Northern Internship Program, the NSERC Postgraduate Scholarship program, the W Garfield Weston Foundation, the Northern Scientific Training Program, Indian and Northern Affairs Canada, the Yukon Geological Survey, Program for Energy Research and Development of Natural Resources Canada, the Royal Canadian Geographical Society Expedition of the Year Award and the Faculty of Arts, University of Ottawa. Able field assistance was given by Catherine Henry, Samantha Darling, Max Duguay and Alex Bevington. Professor Mike Sawada (Ottawa) kindly allowed the use of his research facilities and Professor Bernd Etzelmüller (Oslo) collaborated on fieldwork in 2008. The family of Roger Brown, including his wife Janet and his daughters, are thanked for giving access to his journal from 1964. We thank Dr Stephen Wolfe and the two anonymous reviewers for constructive comments on an earlier version of the letter.