
Abstract
To elucidate the potential role of vegetation to act as a memory source in the southwestern North America climate system, we explore correlation structures of remotely sensed vegetation dynamics with precipitation, temperature and teleconnection indices over 1982–2006 for six ecoregions. We found that lagged correlations between vegetation dynamics and climate variables are modulated by the dominance of monsoonal or Mediterranean regimes and ecosystem-specific physiological processes. Subtropical and tropical ecosystems exhibit a one month lag positive correlation with precipitation, a zero- to one-month lag negative correlation with temperature, and modest negative effects of sea surface temperature (SST). Mountain forests have a zero month lag negative correlation with precipitation, a zero–one month lag negative correlation with temperature, and no significant correlation with SSTs. Deserts show a strong one–four month lag positive correlation with precipitation, a low zero–two month lag negative correlation with temperature, and a high four–eight month lag positive correlation with SSTs. The ecoregion-specific biophysical memories identified offer an opportunity to improve the predictability of land–atmosphere interactions and vegetation feedbacks onto climate.
Export citation and abstract BibTeX RIS

Content from this work may be used under the terms of the Creative Commons Attribution 3.0 licence. Any further distribution of this work must maintain attribution to the author(s) and the title of the work, journal citation and DOI.
1. Introduction
Vegetation dynamics depend on and affect the energy, water and momentum balance at the land surface through a variety of processes (Delire et al 2011). Hence, climate strongly influences the distribution and functioning of ecosystems, which in turn impact climate. Understanding the vegetation response to climate variability is therefore crucial to improve the projections of potential impacts of climate change on natural ecosystems and biodiversity (Zeng et al 1999). This is particularly relevant in southwestern North America in light of the recent work of Park Williams et al (2012), which suggests a potential spatial reorganization of ecosystems resulting from the global warming-induced changes in precipitation and temperature. In this context, exploring the ecosystem dynamics in southwestern North America is of ecological and hydroclimatic interest given the wide range of diverse ecosystems experiencing different adaptation strategies to climate variability (Vivoni et al 2008, Peinado et al 2010). For example, vegetation greening in the region is closely linked to seasonal precipitation produced by the monsoonal or Mediterranean climate regimes that vary within the geographical area and its regional topography (Higgins and Shi 2000, Castro et al 2001). Precipitation during winter (Mediterranean) and summer (monsoonal) seasons also exhibits large variability on intra-annual to inter-decadal scales connected to remote forcings (e.g. Watts et al 2007, Tang et al 2012, Zhu et al 2007, Castro et al 2009).
Analysis of correlation structures has shown that sea surface temperature (SST) and sea pressure level (SPL) anomalies are related to land surface climate variability over specific areas in this region (e.g. Higgins and Shi 2000, Englehart and Douglas 2002, Brito-Castillo et al 2002). SST and SPL anomalies associated with El Niño-Southern oscillation (ENSO) have also been linked with anomalies of dry (wet) monsoons over the Mexican Pacific coast (Vera et al 2006). The predictability of precipitation arising from different teleconnection indices, however, depends on the sensitivity of each index to the ENSO phase (warm, El Niño or cold, La Niña) (Hanley et al 2003). Caso et al (2007) analyzed the relation between ENSO and seasonal rainfall in the region, suggesting a potential link to ecosystem conditions.
At the global scale, delayed feedbacks to ENSO cycles have been observed in the dominant component of the vegetation-forced precipitation variability by Alessandri and Navarra (2008). Other studies further corroborate the evidence of vegetation response to ENSO-related anomalous climatic conditions via remote forcing of the synoptic-scale circulation or teleconnections (e.g. Myneni et al 1996, Grant et al 2009, Lü et al 2012). Such studies suggest the potential role of vegetation to act as a memory source of both land surface state and large-scale climate forcings. As ENSO cycles are currently well predicted by dynamical seasonal forecasting systems, these results highlight the potential for an improved predictability of vegetation response to climate variability.
While the links between precipitation, temperature and vegetation activity have been explored at the global and regional scale (e.g. Liu et al 2006, Méndez-Barroso et al 2009, Cañon et al 2011), little is known about how remote oceanic forcings control vegetation dynamics indirectly by modulating the land surface climate in this region. Dominant patterns of spatiotemporal variability of satellite-derived vegetation and its covariability with precipitation have been associated to multi-year ENSO oscillations (Lotsch et al 2003, 2005, Castro et al 2009). The existence of ocean–atmosphere teleconnections affecting vegetation productivity—via the alteration of seasonal land surface climate—is further corroborated by the significant correlations between ENSO-induced changes in cold-/warm-season precipitation and annual tree-ring chronologies observed for conifers in the southwestern United States by Stahle et al (2009). Salinas-Zavala et al (2002) found different vegetation responses to SST anomalies, with a delay of four to six months in vegetation response due to drought conditions of a negative ENSO (La Niña) phase and higher production rates in the positive phase (El Niño). An important question remains how different vegetation types respond to climate fluctuations through ecosystem-specific abilities to retain climate information from past seasons (hereafter termed biophysical memory). Specifically, Forzieri et al (2011) identified how vegetation phenology in the region follows two general strategies—intensive (deciduous) and extensive (evergreen) seasonal greening—in response to local conditions in land surface climate.
In this study, we derive and analyze spatiotemporal relations between vegetation, precipitation, temperature and ENSO indices. We infer responses to climate for the diverse ecosystems by analyzing remotely sensed vegetation indices. Our analysis differs from previous work by: (1) providing a deeper inspection of regional ecosystems; (2) focusing on vegetation growing seasons based on a robust phenological characterization; (3) quantifying both land surface climate and oceanic effects on the vegetation response; and (4) applying stringent procedures for evaluating correlation significance over long time series. Although our study only partially addresses ecosystem dynamics, correlation structures as derived herein quantify possible biophysical memory sources and can reveal phenoclimatological mechanisms in the region. Understanding the interactions between remote forcings, local climate and vegetation dynamics may yield improved predictability of land–atmosphere interactions and their potential feedbacks onto climate in southwestern North America.
2. Methods
2.1. The southwestern North America climate system
The study region is a large domain whose extent (20–35°N, 105–115°W) was selected to match the North American Monsoon (NAM) Experiment Tier I domain (figure 1(A)), also referred to as the NAM region. It has complex terrain due to mountain ranges in the southern Basin and Range province, Madrean Archipelago and the Sierra Madre Occidental (SMO), which influence land surface climate (Gochis et al 2007b). The domain experiences two main climatic regimes (Caso et al 2007). A monsoonal climate with hot wet summers affects most of the area, including southeastern Arizona, New Mexico, Chihuahua, Sinaloa and eastern Sonora. Monsoonal regions show a strong seasonality with 60–80% of rainfall occurring during July–September (JAS), with average JAS precipitation and temperature ranging from ∼200 to 800 mm and ∼20 to 30 ° C, respectively (figure 1(B)). Note the increasing trend of JAS rainfall toward the southern, tropical areas of the NAM region and lower JAS temperatures toward interior mountains. A Mediterranean climate with wetter winters and drier summers is found in the outermost western parts of Sonora, southwestern Arizona and Baja California. The Mediterranean area experiences average winter precipitation (January–March, JFM) from ∼50 to 150 mm (about 30–50% of total annual precipitation) and summer temperature from ∼25 to 30 ° C (figure 1(C)).

Figure 1. Study domain showing ecoregion map, GSOD stations and elevation contours (A); percentage of seasonal precipitation over 1982–2006 for the summer (JAS) and winter (JFM) seasons with average annual temperature and precipitation ((B) and (C), respectively); average onset and end of the greenness period over 1982–2006 ((D) and (E), respectively).
Download figure:
Standard image High-resolution imageEcosystems in the region show diverse plant strategies to cope with seasonal water availability and present marked spatial variations in phenology closely related to the dominant climate regimes. In particular, growing seasons are mainly in summer and fall-winter for the monsoonal and Mediterranean regions, respectively (figures 1(D) and (E)). Additional details on the region can be found in Forzieri et al (2011).
2.2. Remote sensing, land surface and oceanic datasets
To quantify vegetation dynamics we used the GIMMS (Global Inventory Modeling and Mapping Studies) monthly NDVI dataset from 1982 to 2006 at 8-km resolution (Tucker et al 2005). NDVI observations are proportional to the amount of photosynthetically active radiation and are used here as surrogate of vegetation activity (e.g. Tucker et al 2005, Goetz et al 2005, Lotsch et al 2005). We examined the spatial distribution of different ecosystems by using the ecoregion map that has been derived by Forzieri et al (2011) through a k-mean unsupervised classification of the three principal components of the NDVI time series. The ecoregion distribution (figure 1(A)) distinguishes: tropical dry forests of the Pacific coastal plain, hills and canyons (TDF); SMO mountain woodlands composed of evergreen and deciduous forests (EDF); conifer forests in Arizona and New Mexico (CF); semiarid grasslands, shrublands and subtropical scrublands in the SMO piedmont (GSS); the Sonoran Desert (SD); and the Chihuahuan Desert (CD).
The CPC (Climate Prediction Center) monthly 0.5° gridded precipitation (P) and air temperature (T) datasets from 1982 to 2006 (Chen et al 2002, Fan and van den Dool 2008) are used to explore land surface climate. We assessed the reliability of the coarse climate datasets by analyzing correlations between the gridded fields and estimates derived from 43 stations of the Global Surface Summary of Day Database (GSOD) (yellow circles in figure 1(A)). Average correlations of 0.67 and 0.97 for precipitation and temperature confirm the suitability of the CPC gridded datasets for exploring vegetation–climate interactions at the regional scale. Figures 1(B) and (C) show the CPC-derived percentage of seasonal precipitation and the multi-year averaged isohyets and isotherms during summer (JAS) and winter (JFM).
Remote oceanic forcings are calculated based on the spatially averaged SST anomalies over different areas in the equatorial Pacific obtained from the CPC archive: El Niño 1 + 2 (0°–10°S, 80° W–90°W), El Niño 3 (5°N–5°S, 90° W–150°W), El Niño 3.4 (5°N–5°S, 120° W–170°W) and El Niño 4 (5°N–5°S, 150°W–160°E). In addition, monthly anomalies of the Southern oscillation Index (SOI) were obtained from differences between the Tahiti and Darwin SPLs. These indices represent a range of possible teleconnections that have been found to be correlated to local climate (Hanley et al 2003).
2.3. Phenoclimatological analysis
To explore vegetation–climate relations, we first standardized the NDVI, P and T time series by subtracting the monthly mean and dividing by the monthly standard deviation. The Durbin–Watson statistical test (0.05 significance level) showed no autocorrelation in the residuals for NDVI, P and T over more than 95% of the total area and supported the effectiveness of the deseasonalization process. Since the NDVI during the non-growing season does not allow for a clear phenological separation (e.g. Senay and Elliott 2000), only NDVI anomalies between the onset (TG) and end (TS) of the greenness periods were used. TG and TS are estimated for each year at the 8-km pixel scale from the NDVI observations following the threshold approach described in Forzieri et al (2011). Figures 1(D) and (E) show the multi-year averages of TG and TS, respectively.
We developed a phenoclimatological analysis based on the correlation structures between: (1) monthly NDVI anomalies (ANDVI) and monthly precipitation anomalies (AP), (2) ANDVI and monthly air temperature anomalies (AT), and (3) ANDVI and monthly teleconnection indices. Correlations are expressed in terms of Spearman rank and calculated using various lead periods preceding the onset of the growing season. Field significance tests based on the false discovery rate (FDR, q = 0.05%) were performed for evaluating the significance of the vegetation–climate correlation fields (e.g. Wilks 2006). We point out that such testing procedure has been demonstrated to be particularly effective for spatially correlated data, such as climatological fields, by reducing the number of false positive discoveries with respect to conventional significance tests (e.g. Ventura et al 2004).
Although the correlation coefficient does not necessarily imply a causal relation, we contend that it is a useful indicator of the link between vegetation dynamics and climatic conditions. In a preliminary analysis, ENSO indices, in particular El Niño 3 and 4, showed similar relations with NDVI anomalies in terms of spatial correlation patterns. Consequently, the El Niño 4 index, P and T were identified as the most important for investigating the vegetation–climatic correlations. This is supported by the number of significant pixels in the correlations between NDVI anomalies and climatic variables for all temporal lags (table 1).
Table 1. Number of significant pixels resulting from the FDR test applied on the correlations between NDVI anomalies and climatic variables across all the investigated temporal lags (total number of vegetated pixels for each temporal lag is 17 231, while the number of lags is 12).
| Correlation structure | # pixels |
|---|---|
| ANDVI–AP | 29 800 |
| ANDVI–AT | 13 574 |
| ANDVI–SOI | 35 605 |
| ANDVI–El Niño 1 + 2 | 31 787 |
| ANDVI–El Niño 3 | 44 218 |
| ANDVI–El Niño 3.4 | 39 290 |
| ANDVI–El Niño 4 | 44 499 |
3. Results and discussion
3.1. Spatiotemporal patterns of vegetation–climate correlations
Figure 2 shows the spatial distributions of the zero- to six-month lag correlations (ρk) passing the significance test between monthly NDVI anomalies (ANDVI) and monthly AP ((A1)–(A7)), monthly AT ((B1)–(B7)), and monthly El Niño 4 index ((C1)–(C7)). Given the prevalent monsoon-related growing season, the lead times refer to late spring and summer, with the exception of SD subject to a Mediterranean climate where the temporal lags refer to fall and winter. Vegetation dynamics show prevalent short-term responses to precipitation and temperature, with maximum correlations for the zero–three and zero–two month lag intervals, respectively, and no correlations for lead periods longer than five months. In general, vegetation greenness is positively linked to precipitation and negatively correlated with temperature. Increasing precipitation favors soil water availability that promotes photosynthetic activity (e.g. Vivoni et al 2008, Méndez-Barroso et al 2009, Peters et al 2010), while higher temperatures reduce soil moisture through evaporation causing a lower vegetation vigor (Hong et al 2007). Spatiotemporal patterns of vegetation response are also modulated by local factors. For instance, precipitation controls are influenced by topography and show opposite correlations over EDF (SMO) and CF (AZ mountains) for zero month lag as compared to lower areas, likely due to reductions in solar radiation from cloudiness. Further, temperature shows an increasing negative effect in the Chihuahuan Desert (CD), suggesting a higher sensitivity in the continental interior.
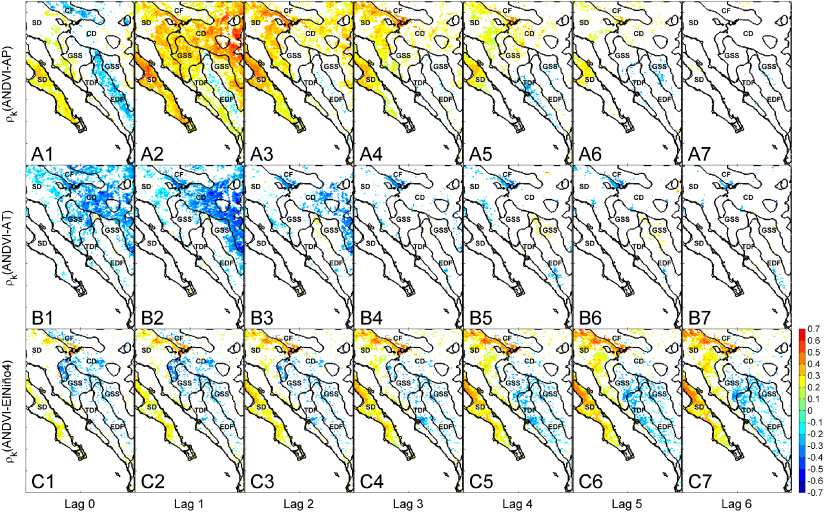
Figure 2. Spatial maps of the significant correlations between monthly NDVI anomalies (ANDVI) and ((A1)—(A7)) monthly P anomalies (AP); ((B1)–(B7)) monthly T anomalies (AT); ((C1)-(C7)) monthly El Niño 4 index. Ecoregion boundaries are displayed in labeled black polygons.
Download figure:
Standard image High-resolution imageRemote oceanic controls on vegetation dynamics show an opposite pattern for the two climate regimes. In the monsoon region, including TDF, GSS and to a certain extent EDF, vegetation productivity is negatively correlated with teleconnection indices, whereas in the Mediterranean parts of SD an opposite and more pronounced behavior can be observed. For both regions, vegetation shows a long-term biophysical memory of SSTs, with stronger correlations for lag intervals higher than four months. Based on a linear regression of the El Niño 4 index versus NDVI anomalies, we found that a +1 ° C anomaly in SST results in a decrease of 0.06 ± 0.02 and increase of 0.16 ± 0.05 in NDVI for the monsoon and Mediterranean regions, respectively (spatial averages calculated for TDF, EDF, GSS and SD, respectively, over all lead periods). Caso et al (2007) found similar ENSO-induced patterns of rainfall data north and south of the Tropic of Cancer and used this latitudinal gradient to make inferences about ecosystem responses to El Niño. Our robust spatiotemporal analyses corroborate the divergent ecological effects of SST anomalies and demonstrate that the opposite patterns are mainly due to the dominant monsoon or Mediterranean climate regime (figures 1(B), (C) and 2(C1)–(C7)).
Interestingly, the spatiotemporal correlation patterns between vegetation anomalies and the El Niño 4 index (figures 2(C1)–(C7)) reproduce better the spatial distribution of climatic zones (figures 1(B) and (C)) than those between vegetation and the single local precipitation and temperature variables (figures 2(A1)–(A7) and (B1)–(B7)). This suggests that oceanographic forcings exercise a synoptic control on vegetation dynamics by synthesizing the land surface climate components. Given the dominance of water-limited environments within the NAM domain, this likely reflects the teleconnection between soil moisture changes and SSTs. El Niño events tend to favor decreasing (increasing) water availability for plant growth in the monsoon (Mediterranean) region by promoting drier and warmer (wetter and colder) meteorological conditions during the fall-spring (spring–summer) period (e.g. Higgins and Shi 2000, Caso et al 2007). La Niña, on the other hand, induces opposite effects.
3.2. Ecosystem-specific biophysical memory
To evaluate the biophysical memory of different ecosystems, we depict the anomaly correlograms between NDVI and precipitation ((A1)–(A6)), temperature ((B1)–(B6)), and El Niño 4 index ((C1)–(C6)) in figure 3. Each correlogram is derived using bins of a fixed size (0.05) that span the sampled range of correlation and is shown using the left y-axis. Colors display the density normalized with respect to the total number of pixels in the ecoregion, while the gray lines indicate the significance level based on the FDR (pixels outside are significant). Changes in the significance levels between ecoregions and lags reflect the different sample sizes due to varying record lengths. Red circles and blue triangles represent the cumulative percentage of significant pixels (SP) related to positive and negative correlations, respectively, and are shown on the right y-axis.

Figure 3. Correlograms for each ecoregion between monthly NDVI anomalies (ANDVI) and ((A1)–(A6)) monthly P anomalies (AP); ((B1)–(B6)) monthly T anomalies (AT); ((C1)-(C6)) monthly El Niño 4 index. Each correlogram was derived using bins of fixed size (0.05) as shown on the left y-axis. Colors display the density normalized with respect to the total number of pixels in each ecoregion, while gray lines indicate significance levels. Red circles and blue triangles represent the cumulative percentage of significant pixels (SP) related to positive and negative correlations, respectively (right y-axis).
Download figure:
Standard image High-resolution image
Semiarid, subtropical and tropical ecosystems in TDF and GSS have a positive correlation peak between NDVI and precipitation at a lag of one month (57% and 72% SP, respectively), and lower values for current and higher lags, indicating a rapid utilization of available water (Forzieri et al 2011, Vivoni 2012). A secondary peak of significant negative correlation is found at a lag of four months. This could result from the coexistence of numerous species competing in water-controlled environments when vegetation response to winter–spring rainfall consumes soil moisture and depletes nutrient resources for the following monsoon phenological cycle (Rodriguez-Iturbe and Porporato 2004). Temperature shows a negligible control on TDF and zero–one month lagged negative effects on GSS (25% SP). These correlation features reinforce the notion that intensive water use strategies of deciduous ecosystems in TDF and GSS are highly dependent on precipitation occurring in the prior month. Correlation patterns for TDF and GSS also agree with prevalent tree growth during warm periods in northern Mexico, which showed a positive relation between latewood chronologies and summer rainfall (Therrell et al 2002). Modest, but statistically significant, negative correlations between ENSO and vegetation dynamics (28% and 18% SP for TDF and GSS, respectively) at four–eight month lags suggest that cooler than normal SSTs (La Niña) produce higher vegetation greening and warmer SSTs (El Niño) induce the opposite effect. These results agree with the correlation structures between ENSO and streamflows shown by Gochis et al (2007a), suggesting a consistent and in-phase response of land surface processes to remote forcing.
Interestingly, a significant negative zero month lag correlation between precipitation and vegetation dynamics is found for conifer, oak and mixed forests of EDF and CF. The negative correlation (43% and 31% SP for EDF and CF, respectively) could reflect the increased cloudiness at high elevation sites during rainfall events (Nemani et al 2003). The progressive rapid reduction of significant correlations for increasing lead periods also indicates that forest vegetation activity is relatively insensitive to seasonal precipitation variations, indicating a slow utilization of available water (Forzieri et al 2011, Vivoni 2012). Negative short-term (zero–one month lagged) correlations between vegetation and temperature are found for CF (17% SP). This supports the negative relation found by Adams and Kolb (2005) and Park Williams et al (2012) between tree growth and temperature in forests of Arizona, where high respiration rates and increased vapor pressure deficits resulting from above normal summer temperatures tends to limit plant growth. Interestingly, SST anomalies show a weak control on monthly vegetation dynamics in EDF and CF (about 10–15% SP), indicating that extensive (evergreen) ecosystems are largely insensitive to remote forcings. This is likely related to their deep-rooted plant morphologies. Due to their ability to reach deep soil water resources, extensive users are weakly influenced by SST-induced soil moisture variations, provided that a certain amount is guaranteed (Camberlin et al 2007).
Vegetation activity in the Sonoran (SD) and Chihuahuan (CD) Deserts is positively correlated with precipitation during prior periods, especially at one–four month lags (58% and 38% SP for SD and CD, respectively). This confirms that photosynthetic activity of water-limited ecosystems mainly depends on prior precipitation rather than current conditions (Weiss et al 2004, Méndez-Barroso et al 2009). For these ecoregions temperature considerably controls vegetation dynamics, as expressed by the zero–two month lagged negative correlations (14% and 45% SP for SD and CD, respectively), since low vegetation cover in deserts favors high evaporative rates and water losses for above normal temperatures. Ecosystems in the Sonoran Desert (SD) show high positive correlations between SSTs and NDVI anomalies, with peak values at four–eight month lags (51% SP). In contrast, negligible correlations are found for the Chihuahuan Desert (CD). Salinas-Zavala et al (2002) found comparable results and suggested that the four–six month delay of vegetation response to ENSO was due to the capacity of desert plants, such as cacti, to retain biophysical memory of prior conditions in seeds during long dehydrations. A prolonged memory of ENSO in desert, subtropical and tropical environments (TDF, GSS and SD) may also reflect an enhanced adaptation capability of intensive ecosystems. Such ecosystems usually develop a dense network of shallow roots to absorb moisture originating from light rainfall events (Rodriguez-Iturbe and Porporato 2004) and are therefore more prone to SST-induced variability of soil water resources.
4. Conclusions
We analyzed correlation structures between vegetation, precipitation, temperature and ENSO indices to quantify the biophysical memory of six distinct ecoregions spanning from desert grasslands to evergreen forests in southwestern North America. The impacts of land surface climate and remote oceanic forcing on vegetation dynamics appear to be consistently modulated by the dominance of monsoon or Mediterranean regimes across the entire domain and the physiological processes that vary among ecoregions. Biophysical memory ranged from short (zero–one month) to long (four–eight month) periods with precipitation, temperature and remote forcing. Desert, subtropical and tropical ecosystems with intensive greening exhibited a strong biophysical memory to ENSO, whereas mountain evergreen forests were largely insensitive. This may relate to differences in plant morphological structure of intensive and extensive users, typically shallow- and deep-rooted, respectively, that induce diverse adaptation strategies and delimit what water resources are exploited to cope with climate variability. The phenoclimatological analysis quantifies the ecoregion abilities to act as a source of short- and long-term memory in the climate system, and may offer improved predictability of the role of vegetation feedbacks during the North American monsoon.