
Abstract
The impact of the East Asian monsoon (EAM) on climatology and interannual variability of tropospheric ozone (O3) over the coastal South China was investigated by analyzing 11 years of ozonesonde data over Hong Kong with the aid of Lagrangian dispersion modeling of carbon monoxide and calculation of an EAM index. It was found that the seasonal cycle of O3 in the lower troposphere is highly related to the EAM over the study region. Ozone enhancements in the free troposphere are associated with the monsoon-induced transport of pollutants of continental anthropogenic and biomass burning origins. Lower tropospheric O3 levels showed high interannual variability, with an annual averaged amplitude up to 61% of averaged concentrations in the boundary layer (0–1 km altitudes) and 49% below 3 km altitude. In spring and autumn, the interannual variability in boundary layer O3 levels was predominately influenced by the EAM intensity, with high O3 mixing ratios associated with northeasterly circulation anomalies.
Export citation and abstract BibTeX RIS

Content from this work may be used under the terms of the Creative Commons Attribution 3.0 licence. Any further distribution of this work must maintain attribution to the author(s) and the title of the work, journal citation and DOI.
1. Introduction
Tropospheric ozone (O3) plays an important role in air quality, tropospheric chemistry, and climate change (Logan 1989, Chameides et al 1999). With a lifetime from several days to few weeks in the troposphere (Lelieveld and Crutzen 1994), O3 can be transported over a long distance via large-scale circulations such as that of a monsoon (Bey et al 2001, Liu et al 2003, Sudo and Akimoto 2007). Also, ozone precursors (e.g. carbon monoxide (CO), nitrogen oxides (NOx) and hydrocarbons) can be transported by multi-scale circulations and produce more O3 during the transport period (Wang et al 2003, Zhang et al 2009a, Ding et al 2009).
The subtropical East Asia is a region with an increasing trend in levels of tropospheric O3 and its precursors (Ding et al 2008, Xu et al 2008, Wang et al 2009) as well as a complex monsoon climate. The latter is manifested through strong seasonal and interannual variabilities of monsoon circulations (Ding 1994, Fu and Wen 1999, Wang 2006). Located in coastal South China, Hong Kong is influenced by distinct winter and summer monsoons. The relationship between O3 and the EAM in this region has been studied using O3 observations. For instance, Lam et al (2001) and Wang et al (2009) found that the seasonal variations in surface levels of O3 and carbon monoxide (CO) in Hong Kong were controlled by the EAM. Ding et al (2013) showed that the distinct seasonal variation of O3 was due to regional and subregional transport of anthropogenic pollutants under the influence of EAM. Using ozonesonde measurements, the seasonal cycle of O3 in the entire troposphere was identified in several studies and the influences of the EAM on tropospheric O3 were discussed (e.g. Chan et al 1998, Liu et al 2002, Liu et al 2003, Oltmans et al 2004, Zhang et al 2012).
Understanding the relationship between EAM and O3 on seasonal, interannual and even decadal scales is crucially important for the policy maker of air quality measures in the subtropical East Asia, and is also important for improving the understanding of the interactions between climate change and air pollution. Previous studies showed a strong interannual variability in surface O3 mixing ratios in this region. By comparing data collected during PEM-West B and Trace-P, Wang et al (2003) found that the chemical characteristics of O3 precursors in springtime continental outflow were influenced by year-to-year variation of weather. Using 12 years of ground based air quality data in Hong Kong, Zhang et al (2013) suggested that synoptic weather, which was influenced by the EAM, impacted significantly the interannual variations in mixing ratios of O3 and its precursors. However, because these previous studies mainly used surface measurements, there are knowledge gaps in the relationship between O3 levels and the EAM above the ground surface, especially the relationship between EAM and O3 from the perspective of interannual scales.
In this study, we utilize 11 years of ozonesonde data (453 profiles in total) recorded at the Hong Kong Observatory during 2000–2010. The main purposes of this study are to quantify the vertical distribution of tropospheric O3 in this region from a climatological perspective and to assess the impact of the EAM on the climatology and interannual variability of tropospheric O3 mixing ratios over coastal South China.
2. Data and methodology
2.1. Data
The ozonesonde data were acquired from the Hong Kong Observatory (HKO) during the time period of 2000–2010. The site is located along the coastline of South China (figure A.1). The data collecting method is similar to that used and described in Chan et al (2003) and Zhang et al (2012). Each sounding was launched on a weekly basis at local time 13:00–14:00 at the King's Park Meteorological Station (114.17° E, 22.31° N, 66 m above sea level) of the Hong Kong Observatory. There were more than 3 profiles in most months except a data gap during April–December 2001 and one profile per month during January 2001–March 2002.
We used MOPPIT CO retrievals during the 11-year study period to help interpret the possible causes for observed variability in O3 mixing ratios. We used the Level 3 monthly averaged MOPITT CO data (Version 5 product) (Deeter et al 2013). This dataset has a spatial resolution of 1° × 1° in latitude and longitude and 10 layers from the surface to the 100-hPa level.
2.2. Lagrangian dispersion modeling and calculation of EAM index
To gain insights into the origins of tropospheric O3, Lagrangian particle dispersion modeling (LPDM) simulations of CO were carried out for each ozonesonde profile based on a method developed and evaluated by Ding et al (2013) using the Hybrid Single-Particle Lagrangian Integrated Trajectory (HYSPLIT) model (Draxler and Hess 1998). For each profile, 3000 particles were released from layers with increments of 500 m from surface to 8 km altitude over the site and were traced backward for a 7-day period. The 'footprint' residence time (i.e. retroplumes) of each sample was calculated and multiplied by emission to estimate potential source contributions to CO levels (Guo et al 2009, Ding et al 2009, 2013). Since this study focuses on the lower troposphere, the domain of the LPDM simulation is 100° × 80° in longitude and latitude centered over Hong Kong. We used the 1.25° × 1.25° Japanese reanalysis Project reanalysis (JRA) data from the Japan Meteorological Agency to drive the model. Based on the calculated retroplumes and an emission inventory of anthropogenic CO in Asia prepared for INTEX-B (Zhang et al 2009b) and the GFEDv3 monthly CO emission inventory (Giglio et al 2010), the CO profiles attributed to anthropogenic and biomass burning emissions were calculated corresponding to each profile of O3. Retroplume at an altitude of 300 m was used to calculate CO mixing ratios to consider the plume rise effect of fires, while retroplume at an altitude of 100 m was used for anthropogenic emission.
The dynamical normalized seasonality monsoon index (DNSMI), defined by Li and Zeng (2002) and extensively used in many studies (e.g. He et al 2008, Zhu et al 2012), was applied here to investigate the variation of the EAM over South China. In this study, we used a revised DNSMI to investigate the relationship between O3 and EAM. The DNSMI is defined as:
where Vi is the monthly mean wind vector in i month,  is the climatological mean wind vector in January, and
  is climatological mean wind vector of January and July. According to this definition, the index give the monthly intensity of monsoon, with a reference to the wind climatology in January and July, i.e. summer monsoon and winter monsoon. We calculated the DNSMI using monthly NCEP/NCAR reanalysis data. To make the index represent a relatively large region, we used the data at five grids next to Hong Kong in each of the four directions.
3. Climatology of tropospheric O3 and its relationship with the EAM
Figure 1(a) displays the seasonal variation of the averaged vertical distribution of tropospheric O3 from ground surface to the altitude of 8 km during 2000–2010 as a function of months in a year (figure A.2. gives the same distribution but from surface to 16 km). The overall pattern is similar to the climatology in Oltmans et al (2004) that was based on 253 O3 profiles over Hong Kong during 1993–2001. A tongue-shaped O3 enhancement (>65 ppbv) extended from the lower stratosphere down to 6–7 km altitudes over April–June. A similarly shaped low O3 (<40 ppbv) band extended from the surface to the 6 km altitude from April to August. An isolated area of O3 enhancement appeared around 3 km altitude in March. In addition, two moderate O3 enhancements (50–65 ppbv) were observed in the mid- to upper-troposphere from June to October and in the upper planetary boundary layer (PBL) in September and October, isolated by an area of low O3 values at 2–3 km altitudes in October and November. In order to gain insight into the interannual variability of tropospheric ozone, we show the amplitude of interannual variability (defined as (maximum + 2nd maximum − minimum − 2nd minimum) ×0.5/monthly mean) of tropospheric O3 from surface to 8 km altitude over Hong Kong in figure 1(b) and give the statistics in table 1.

Figure 1. Annual climatology of vertical distributions of (a) O3 mixing ratios (ppbv) from ozonesonde measurements, (b) interannual variability amplitude (unit: %) in tropospheric O3, (c) CO mixing ratios (ppbv) from MOPITT retrievals, (d) LPDM simulated CO mixing ratios from a sum of biomass burning and anthropogenic emissions, and (e) DNSMI for the period of 2000–2010. Note: the amplitude in (b) is defined as (maximum + 2nd maximum − minimum − 2nd minimum) × 0.5/monthly mean during 2001–2010. Arrows on the right-hand side of (e) shows the averaged wind vectors at different vertical layers in January during 2000–2010, used as a reference in the DNSMI calculation.
Download figure:
Standard image High-resolution imageTable 1. Mean amplitude of interannual variability of tropospheric O3 over Hong Kong. (Note: the amplitude of each month is defined as (maximum + 2nd maximum − minimum − 2nd minimum) × 0.5/monthly mean during 2000–2010.)
| Altitudes (km) | Winter (%) | Spring (%) | Summer (%) | Autumn (%) | Annual (%) |
|---|---|---|---|---|---|
| 0–1 | 39 | 71 | 78 | 55 | 61 |
| 0–3 | 31 | 53 | 65 | 47 | 49 |
| 3–8 | 28 | 27 | 35 | 32 | 30 |
Figure 1(c) exhibits the vertical distribution of monthly averaged MOPITT CO retrievals. It was shown that 120–150 ppbv CO was observed from mid- to upper-troposphere throughout the whole year with the altitude changes from about 4 km in winter to over 8 km in spring, and to around ground surface in summer. A low CO center (with CO mixing ratio below 100 ppbv) appeared at altitudes between 1–6 km in July and August. The distinct seasonal variation of lower troposphere CO shows a linkage with the O3 seasonal pattern. An area of high PBL CO levels in winter (up to 400 ppbv around the surface in December) was corresponded to a low O3 layer in the PBL, where the O3 generally showed a negative correlation with CO in cold seasons (Ding et al 2013). The summertime CO valley between altitudes of 1–6 km is corresponded with the low O3 air in low troposphere in summer.
The CO vertical distribution was further simulated using LPDM. Figure 1(d) shows the simulated CO mixing ratios using a sum of emission from anthropogenic and biomass burning sources. Figures A.3(a) and (b) further manifest the contribution from anthropogenic and biomass burning emissions, respectively. These results shed new insights into mechanisms controlling the distribution of CO in the lower- and mid-troposphere. In these simulations, only the emissions during a 7-day backward period were accounted for, and the model results in these figures are based on simulations for the 453 ozonesonde profiles. Higher values aside, simulated anthropogenic CO concentrations showed a pattern somewhat similar to that of the MOPITT retrievals. The lofted springtime CO plumes in March and the middle tropospheric CO enhancements during May–June and August–September were also well characterized by the model. With biomass burning emissions, the simulations did suggest a notable enhancement (up to 15 ppbv) at 2–4 km altitudes in March, although the total amount was much smaller than that from continental fossil fuel pollution (20–50 ppbv). These results further confirmed that the frontal lifting in spring, which is generally associated with a strong winter monsoon, is very important for lower and middle tropospheric CO and O3 (Bey et al 2001, Liu et al 2003).
To identify the influence of the EAM on tropospheric O3 in the region, the distribution of DNSMI was examined for the period of 2000–2010 (figure 1(e)). Because the DNSMI relies on the wind in reference month (i.e. January), we also give the climatological mean wind vectors around Hong Kong for different vertical layers in the right-hand side of figure 1(e). It shows a northeasterly wind in the PBL and westerlies over 2 km altitude. The winter and summer EAMs were clearly distinguished by negative and positive values, respectively. In the PBL, the high positive DNSMI value (>1) represents strong northeasterly winter wind. The summer monsoon extended to 3 km altitude with a negative DNSMI at 1.5 km altitude (∼850 hPa), which matched with the summertime low O3 and CO centers suggested in figures 1(a) and (c), respectively. Another low DNSMI center at 2–3 km altitudes existed in autumn (figure 1(e)), corresponded to a low O3 center. These results further corroborated that the seasonal variation in lower tropospheric O3 mixing ratios in this region were linked intimately to the winter and summer EAMs.
4. Control of interannual variability in the EAM on lower tropospheric O3
The times series of averaged PBL O3 mixing ratios from ozonesonde data were compared with that from surface measurements at Hok Tsui, a regional station about 15 km southeast to the King's Park station (Wang et al 2009), to examine whether weekly ozonesonde data could capture interannual variability of tropospheric O3. We found a very good agreement between the two datasets (see figure A.4). Although studies (e.g. Thouret et al 2006) showed that the upper tropospheric O3 might also have strong interannual variability, this study we mainly focus on lower troposphere to understand the impact of monsoon.
The amplitude of interannual variability of tropospheric O3 shown in table 1 and figure 1(b) suggested that O3 had a strong interannual variability in the lower troposphere, with an annual amplitude of ∼49% below 3 km altitude and 30% at 3–8 km altitudes. This pattern is consistent with the DNSMI distribution shown in figure 1(e). In the PBL (<1 km altitude), the interannual variability of O3 levels was particularly high, with an annual rate about 61% and over 70% in spring and summer. The high amplitude in summer might be related to relatively low mean O3 levels under the influence of summer monsoon but a strong year-to-year variability in frequency of occurrence of the Northwest Pacific Typhoon, which has been found to be the main synoptic pattern causing photochemical pollution in South China (Ding et al 2004, 2013, Zhang et al 2013). Because PBL O3 mixing ratios peaked in the spring and autumn (figure 1(a)), i.e. transition periods of the summer and winter EAMs (Ding 1994, Wang 2006), we focus on the O3-EAM relationships in the two seasons.
Ozone concentrations in figures 2(a)–(c) suggest a strong interannual variation with varying degree of correlation with the DNSMI. Good correlation was observed in the PBL, with r = 0.69 and −0.82 for spring and autumn, respectively. A weak correlation (r =− 0.35) existed at 2–4 km altitudes in March during the entire period because the correlation changes from negative to positive after 2005. According to the definition of DNSMI introduced in section 2, the DNSMI depends on the difference in mean wind vector with that in the reference month, i.e. January. In winter, a higher DNSMI means a stronger winter monsoon, while in summer a lower DNSMI represents a stronger summer monsoon. Here in South China, the mean wind autumn is same as that in January but is different in spring (southeasterly). This could be the main causes for the different PBL DNSMI-O3 correlation in the two seasons.

Figure 2. Time series of averaged PBL O3, 925-hPa DNSMI, and LPDM simulated CO from anthropogenic and biomass burning emissions (a) for March–April and (b) for September–November, and (c) same as (a) but for 2–4 km altitudes in March during 2000–2010.
Download figure:
Standard image High-resolution imageLPDM simulations showed clearly that O3 mixing ratios correlated positively with CO mixing ratios that were simulated using anthropogenic emissions. In the PBL, the contribution from biomass burning emissions was 1–2 orders of magnitude smaller than that from anthropogenic emissions (figures 2(a) and (b)). Because we used a constant anthropogenic emission rate for the entire 11-year period and monthly emission rates for biomass burning, a simulated strong interannual variability in the anthropogenic contribution suggested that the interannual variability in the EAM was a dominant factor controlling levels of O3 and its precursors in the lower troposphere over South China. In March, at 2–4 km altitudes, a positive correlation between O3 and DNSMI was found over 2005–2010 but not over 2000–2004, possibly due to more influence from the interannual variation in biomass burning and anthropogenic emissions (for instance, during 2001–2005, the monthly O3 showed similar variations with anthropogenic and biomass burning CO). To understand what may have shaped the PBL O3-DNSMI relationship in spring and autumn, we selected representative years of O3 peaks and valleys to examine the difference in circulation patterns on the 925-hPa level. In March–April, the Pacific High influenced Southeast China. In high O3 years, stronger northeasterly continental outflow occurred in the coastal region of South China, facilitating transport of more anthropogenic emissions from East China (figure 3(a)). In autumn, during high O3 years a counter-clockwise circulation anomaly was observed over costal Southeast China, causing transport of more air masses from northern and northeastern mainland to Hong Kong (figure 3(b)).
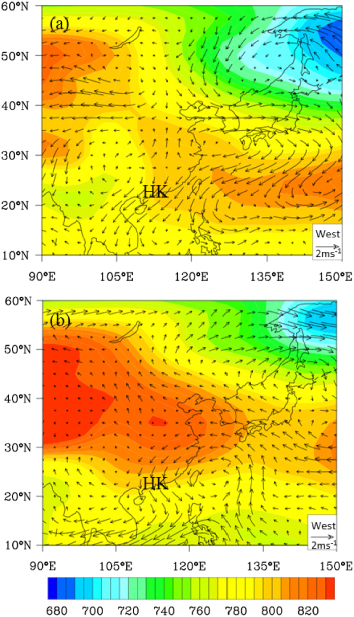
Figure 3. (a) 925-hPa wind vector difference between years of PBL O3 peaks (2005, 2007, and 2009) and valleys (2003, 2006 and 2010) in spring (March–April), plotted on averaged geopotential height (in color) at 925-hPa level during 2000–2010, (b) same as (a) but for difference between years of PBL O3 peaks (2004, 2007, and 2010) and O3 valleys (2002, 2005, and 2009) in autumn (September–November).
Download figure:
Standard image High-resolution imageThese results indicate that the DNSMI can potentially be a useful index for prediction of interannual variations in lower tropospheric O3 level in South China. In spring and autumn, the transition seasons when annual peaks of O3 occurred, changes of intensity, time of occurrence, and/or duration of large-scale monsoon circulation could significantly influence the interannual variation in mean O3 levels and frequency of O3 nonattainment in this region.
5. Implications
In this study, we examined the relationship between the EAM and tropospheric O3 over coastal South China using 11 years of ozonesonde data from Hong Kong during 2000–2010 and a monsoon index, DNSMI. A close link was found between lower tropospheric O3 mixing ratios and the EAM on seasonal to interannual scales, especially in spring and autumn, the transition seasons of the winter and summer EAMs. Because O3 is a key precursor of OH radial, one of the key atmospheric oxidants, significantly large interannual variability of the EAM and O3 levels suggests an important linkage between atmospheric chemical composition and the climate system. Meanwhile, since O3 is an air pollutant in the Pearl River Delta region in South China often exceeding the national air quality standard, especially in autumn, this study highlighted an important impact of monsoon climate on air quality.
Acknowledgments
This study was supported by National Natural Science Foundation Project (D0512/41075101) in China and National Key Basic Research Program ('973 project 2010CB950700), the ESA-MOST Dragon III Project (No. 10455) and the Jiangsu Provincial 2011 Program (Collaborative Innovation Center of Climate Change). The authors would like to thank the Hong Kong Observatory for making the long-term measurement data available at World Ozone and Ultraviolet Radiation Data Centre (WOUDC), and appreciate Dr Roland Draxler for releasing the HYSPLIT model and Professor Qiang Zhang at Tsinghua University for providing the CO emission inventory.
Appendix.: Map and data comparison
Figures A.1–A.3 show additional information to support this study. Figure A.1 exhibits the climatology of surface CO concentration obtained from MOPITT retrievals during the period of 2000–2010 and shows the location of Hong Kong. Figure A.2 shows same result with figure 1(a) but with the altitude from ground surface to upper troposphere (16 km). Figure A.3 gives the same figure with figure 1(d) but with the anthropogenic and biomass burning emissions separated. Figure A.4 exhibits the time series of monthly averaged PBL (0–1 km) O3 mixing ratios calculated from the ozonesonde and the monthly average of surface hourly O3 levels observed at Hok Tsui, a regional station about 15 km southeast to the King's Park station.
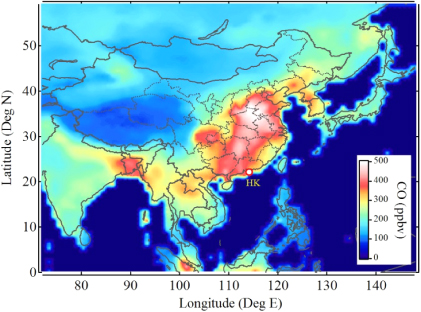
Figure A.1. The climatology of the surface MOPITT CO during 2000–2010 in East Asia and the location of Hong Kong (marked as HK).
Download figure:
Standard image High-resolution image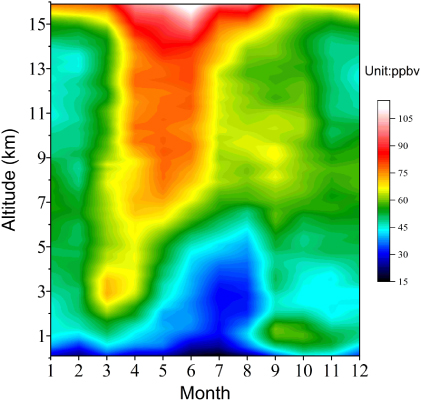
Figure A.2. Same as figure 1(a) but for the altitude from the surface to 16 km.
Download figure:
Standard image High-resolution image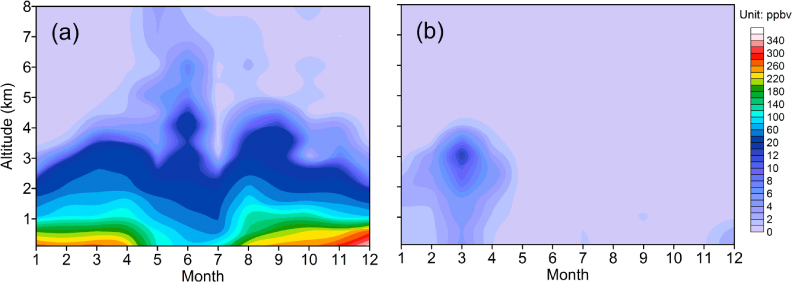
Figure A.3. Same as figure 1(d) but for simulation results from (a) anthropogenic and (b) biomass burning emissions, respectively.
Download figure:
Standard image High-resolution image
Figure A.4. Time series of monthly averaged surface O3 at Hok Tsui and averaged PBL (below 1 km) O3 concentration from the ozonesonde data.
Download figure:
Standard image High-resolution image