

Abstract
To better understand how urbanization affects the amount and timing of urban vegetation in drylands we investigated remotely sensed vegetation patterns across seven large metropolitan regions in the southwestern United States. We asked (1) how low density urban land cover differed from adjacent wildland grass, herb, and shrub land covers in both the amount of vegetation and the length of the growing season, (2) how neighborhood income affected patterns of vegetation within low density urban cover, and (3) how cities differed from one another in their vegetation patterns. We found that urbanization generally has a strong influence on vegetation compared to adjacent wildlands. In four of the metropolitan regions the cumulative enhanced vegetation index (EVI) and growing season length in low density developments were higher than grass, herb, and shrub land covers. Within all metropolitan regions, there was a significant socioeconomic effect where higher income areas had a higher cumulative EVI than lower income areas. The large differences in urban vegetation among cities were related to precipitation and total domestic water use. These findings help to identify how urbanization influences vegetation, with implications for the availability of ecosystem services and requirements for irrigation in hot dryland cities.
Export citation and abstract BibTeX RIS

Content from this work may be used under the terms of the Creative Commons Attribution 3.0 licence. Any further distribution of this work must maintain attribution to the author(s) and the title of the work, journal citation and DOI.
1. Introduction
Urbanization has altered vegetation patterns through changes in land cover, species, resources, climate, and pollutants (Grimm et al 2008a). While our understanding of urban ecosystems continues to expand (Pickett et al 2011), the factors regulating the dynamics of urban vegetation within and between cities, especially in dryland regions, are not well resolved. In drylands, urbanization may expand vegetation compared to undeveloped wildlands with increased amounts of vegetation and longer growing seasons at the land surface (Buyantuyev and Wu 2012, Imhoff et al 2010) and individual species scales (Neil et al 2010). While the changes to vegetation associated with urbanization may not result in atmospheric effects at scales of whole metropolitan regions (Georgescu et al 2011), they have been shown to substantially influence individual urban patches (Spronken-Smith et al 2000, Chow et al 2011). Expanding urban vegetation has been adopted as a component of strategies to adapt and mitigate the effects of climate changes with potential health and energy conservation benefits associated with vegetative cooling (Imhoff et al 2010, Wilhelmi and Hayden 2010, Jenerette et al 2011). However, sustaining urban vegetation requires substantial irrigation requirements that will likely increase with warmer climates (Jenerette et al 2011, Pataki et al 2011b, Vico et al 2013). A better understanding of how urbanization affects vegetation dynamics will improve projections of urban ecosystem functioning in response to global changes and provide information useful for balancing the services and costs of sustaining urban vegetation (Pataki et al 2011a).
The degree to which dryland cities influence local vegetation may vary among and within cities. Cities differ in the availability of irrigation water (Jenerette et al 2006, Padowski and Jawitz 2012), which can affect the capacity to alter vegetation. Similarly, desires for trees and their ecosystem services may differ among residents within and between cities (Heynen et al 2006). Alternatively, the 'urban homogenization hypothesis' has suggested that urbanization leads to similar ecological conditions across cities (McKinney 2006, Francis et al 2012). Among the few comparative urban studies conducted, both consistent (Pickett et al 2011, Wu et al 2011) and variable (Jenerette et al 2006, Imhoff et al 2010, Jenerette and Potere 2010, Kirkpatrick et al 2011) patterns of urban landscapes have been observed across environmental and social gradients suggesting that both urban divergence and homogenization occur depending upon variables and scales of interest. Systematic research using standardized methods across multiple cities is needed to understand variation and consistency in how urbanization affects vegetation (Grimm et al 2008b, Boone et al 2012).
Within individual cities, studies from a growing number of regions have found correlations between neighborhood income and the extent of vegetation greenness (Mennis 2006, Luck et al 2009, Kirkpatrick et al 2011, Lowry et al 2012, Clarke et al 2013). This socioeconomic effect, also termed the 'luxury hypothesis', suggests that residents with more wealth can afford the resources for planting and maintenance of more vegetated landscapes. They are also more likely to be homeowners, which is associated with investing in landscaping and its long-term maintenance. The association between income and vegetation is likely further related to patterns of education, culture, and individual histories, which may all correlate with patterns of income distribution. The increase in vegetation associated with income may be a consistent feature across cities or it may be sensitive to local factors including socioeconomic, local precipitation, or availability of irrigation water. To date, no research has quantified the potential variation across cities in relationships between socioeconomic segregation and vegetation.
To better understand how urbanization affects the amount and timing of urban vegetation in drylands, we investigated vegetation across seven large metropolitan regions in the southwestern United States distributed across a transect from the Pacific coastal metropolitan region of Los Angeles, CA to the interior metropolitan region of Austin, TX. Our analyses used consistent, remotely sensed vegetation and land cover classification data sources to evaluate patterns within and across different metropolitan regions. We selected two critical metrics of vegetation using NASA's Terra Moderate Resolution Imaging Spectroradiometer (MODIS) enhanced vegetation index (EVI): annual EVI sum and length of growing season. EVI sum provides a metric of total active vegetation (Archibald and Scholes 2007, Forzieri et al 2011, Campos et al 2013). The length of the growing season is an integrative phenological variable that combines information on growing season start and ending date (Reed et al 1994, Zhang et al 2004). Our first question asked how low density urban land cover differs from adjacent wildland cover in both the amount of vegetation and the length of growing season. We tested an urban vegetation effect hypothesis, which predicts that irrigation subsidies and planting non-native species in low density urban land cover increases the amount of vegetation, lengthens the growing season, and decouples vegetation from precipitation inputs. Our second question asked if vegetation within low density urban areas differs with respect to neighborhood income. We evaluated the luxury effect hypothesis, which predicts that residents with more income will be associated with more vegetation greenness. Our third question asked how low density urban areas in these selected metropolitan regions differ in their patterns of vegetation compared to wildland areas and between income classes. We hypothesized that the magnitude of differences between urban and wildland vegetation and between high and low income locations would reflect interactions among the magnitude of income disparity, residential water supply, and local precipitation. Alternatively, we considered the urban homogenization hypothesis as a null effect of no differences among these cities.
2. Methods
2.1. Data description
We selected seven metropolitan regions (figure 1) loosely following a transect from coastal to the interior of the southwestern United States including: Albuquerque, New Mexico (ABQ), Austin, Texas (AUS), Inland Empire region, California (IE), Las Vegas, Nevada (LAS), Los Angeles, California (LAX), and Phoenix, Arizona (PHX). These regions extended beyond the municipal boundary of the focal city and included adjacent cities and wildland areas. For each region, we combined a consistent land cover classification scheme, local precipitation data, census derived patterns of incomes, and 16-day repeating satellite imagery to quantify variation in the total amount and growing season length of vegetation (figure 2).
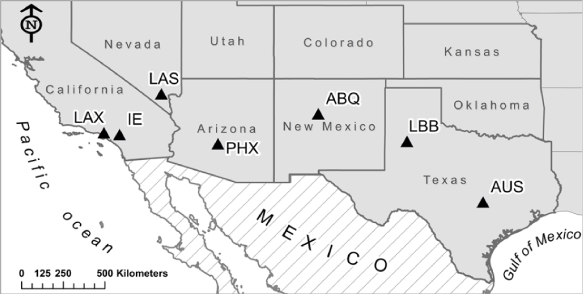
Figure 1. Location of study metropolitan regions. ABQ—Albuquerque; AUS—Austin; IE—Inland Empire; LAS—Las Vegas; LAX—Los Angeles; LBB—Lubbock; PHX—Phoenix. The weather stations (name and Global Historical Climatology Network code) used for each metropolitan region was: ABQ (Albuquerque International Airport USW00023050); AUS (Austin Bergstrom Airport, USW00013904); IE (Riverside Municipal Airport USW00003171); LAS (Las Vegas McCarran Airport USW00023169); LAX (Los Angeles International Airport USW00023174); LBB (Lubbock International Airport USW00023042); PHX (Phoenix Sky Harbor International Airport USW00023183).
Download figure:
Standard image High-resolution image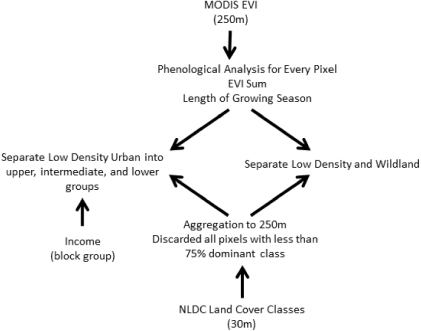
Figure 2. Data flow diagram showing how the enhanced vegetation index (EVI), land cover, and income data were combined to assess differences between wildland and low density urban phenology and differences between upper and lower income low density locations. This procedure was repeated in each of the metropolitan regions.
Download figure:
Standard image High-resolution imageLand cover data were acquired from the 2006 National Land Cover Database (NLCD) (Fry et al 2011). The NLCD database applies a 16 class land cover classification scheme throughout the United States at a 30 m resolution. The classification is based on a primarily unsupervised classification of Landsat Enhanced Thematic Mapper Plus and additional ancillary data. Initial validation suggested up to 78% overall accuracy (Wickham et al 2013). Earlier versions of the NLCD data have been widely used to study urban landscapes (Irwin and Bockstael 2007, Zhang et al 2012) and their primary benefit is the consistency in methodology across the United States. To represent urbanized areas associated with where people reside, we selected the developed, low intensity class, defined as areas with a mixture of constructed materials and vegetation with impervious surface ranging between 20 and 49% and most commonly including single-family housing units. These areas are generally managed by individual residents or local institutions. For wildland areas we included both the grassland/herbaceous cover and the shrub/scrub cover. Initial analyses evaluating differences between land covers in both vegetation density and growing season did not identify differences (ANOVA, p > 0.1) and therefore we combined these classes into a single wildland vegetation category. To combine land cover patterns with MODIS derived EVI, we aggregated the land cover classification to 250 m pixels using a majority-rule method. We excluded from all analyses resulting pixels with mixed land covers having less than 75% of the dominant class.
Annual precipitation data were obtained from long-term weather stations within each metropolitan region that are part of the NOAA Global Historical Climatology Network (version 3.11-por-2013080913; stations are identified in figure 1). We compared annual precipitation from the station with the overlay of 800 m resolution PRISM annual precipitation dataset (PRISM Climate Group, www.prism.oregonstate.edu) and land cover at the scales of the entire dataset, within each region across years, and within each region for each year. For these analyses, we resampled the 800 m pixels to the 250 m analysis grid and extracted the distribution of annual precipitation for the low density and wildland cover types for each region. Station precipitation totals and cover type means across all regions were highly correlated (0.96 for low density; 0.97 for wildland). Regressions were conducted between annual precipitation at the station and mean precipitation within each cover type for all regions; 95% confidence intervals of all slopes included 1.0. The coefficient of variation (standard deviation divided by the mean times 100) spatial variation within the two cover types for each region and year was on average 23% for the wildland and 21% for the low density developed. The difference between the mean and station precipitation for each year and region (total of 154 comparisons) was within two standard deviations of the cover variation for 82% of the low development and wildland annual precipitation and the remaining cases were within three standard deviations. At the annual scale, these tests showed the suitability of using the station as representative of each region although interpretations should still recognize variation in precipitation occurring within each metropolitan region.
Residential income was obtained from the 2000 US Census data. Census derived socioeconomic data have been extensively used in comparisons of urban residential and ecosystem patterns (Hope et al 2003, Huang et al 2011, Jenerette et al 2011). For each metropolitan region we separately classified the low density urban areas into individually determined upper, intermediate, and lower thirds of income classes.
Vegetation greenness was estimated using the EVI from MODIS Product MOD13Q1, 16-day composite data with 250 m resolution (Huete et al 2002) acquired from EOS Data Center. The EVI provides a measure of photosynthetic activity or greenness using the reflectivity and absorption by plants for specific bands, with higher values indicating more biomass or photosynthetic activity (Friedl et al 1995). We used complete annual data beginning in 2001 and extending until 2010. The data for each city were subset and projected onto UTM with locally appropriate parameters using MODISTOOL and then organized within ArcGIS (ESRI, Redlands CA) as a geodatabase. Los Angeles was unique in our study region in that nearly all low lying areas have effectively been developed and the remaining wildlands are primarily located at higher elevations, confounding the comparisons. We tested this by examining land cover overlays with 800 m PRISM data and found that wildland covers received on average 13% more precipitation and in the wettest year 29% more precipitation than the low density urban land cover. Thus, we did not evaluate wildlands for comparison with urbanized lands in Los Angeles and recognize finding appropriate comparisons for urban and wildland is a challenge in many urban studies. All other metropolitan regions included extensive areas suitable for comparison between low density urban and wildland.
All processed data are archived and available for download at the UCR Center for Conservation Biology (http://ccb.ucr.edu/).
2.2. Data processing
A robust effort has been directed towards identifying phenological signals from MODIS EVI data primarily in wildland systems (de Beurs and Henebry 2010) with more limited effort in urban areas (White et al 2002, Zhang et al 2004, Buyantuyev and Wu 2012). While there is debate about the best approach, there is broad consensus that many ecosystem-level phenological variables can be identified in the time series including our two focal metrics of EVI annual sum and growing season length. Extraction of phenological variables in drylands from repeating image data has been previously used for both urban and wildland vegetation within our study region (Jenerette et al 2010, Buyantuyev and Wu 2012). Processing for phenological variables were conducted using custom Python scripts calling functions from ArcGIS and the statistical language R (www.r-project.org). EVI sum and growing season length were determined independently for each pixel for each year in the analysis. EVI sum was determined as the annual sum of 16-day EVI. Growing season length was determined through the derivative approach for extracting growing season length (de Beurs and Henebry 2010). Raw EVI was first smoothed using a locally estimated sum of squares (R function LOESS) with a Gaussian distribution, degree 1, span of 5/24 (∼0.2) with a cubic weighting function. We compared span values and chose the smoothing that characterized the overall data through expert analysis. The start and end of season was determined from the date of maximum and minimum 16-day derivatives within each year (de Beurs and Henebry 2010).
All workflows for organizing, coupling, and processing data are archived and available for download at Github, an open source repository (https://github.com/GregoryCMiller?tab=repositories), and the UCR Center for Conservation Biology (http://ccb.ucr.edu).
2.3. Statistical analysis
For statistical analysis, including ANOVA and regression, we combined all pixels from each land cover class to generate a land cover specific annual mean. We did not detect autocorrelation for precipitation over the study period, allowing us to treat each year as an independent sample (Durbin–Watson; p > 0.1). We tested for an increase in low density urban EVI sum and growing season length compared to wildland (urban vegetation hypothesis) with a two-way ANOVA (city and land cover as independent factors) and post-hoc tests of differences using the Tukey-HSD criterion. We similarly tested for differences in EVI sum between high and low income areas (luxury effect hypothesis). We evaluated relationships between EVI sum and annual precipitation independently for urban and wildland covers within each metropolitan region through regression (urban vegetation hypothesis). An F-test was conducted to identify differences between regression slopes for urban and wildland EVI sum sensitivity to precipitation if both had significant regression models. To identify potential correlates with the effect of urbanization on vegetation across cities (urban gradients versus urban homogenization hypotheses), we computed the ratio of mean low density urban divided by wildland EVI sum as a dependent variable and then conducted regression analysis using a targeted selection of potential independent variables: total precipitation, per capita domestic water use (obtained from USGS 2005 survey— http://water.usgs.gov/watuse/data/2005/index.html), a combined index of per capita domestic water use/total precipitation, and income separation between high and low income classes. A similar analysis was conducted for the ratio of high income to low income area EVI sum.
3. Results
3.1. Urbanization effects on vegetation
Low density urbanization was strongly correlated with both the amount of vegetation and growing season length when compared to wildland vegetation communities with significant effects of cover, region, and their interaction (ANOVA, p < 0.01, figure 3). Post-hoc tests for each city showed that low density urban cover was associated with a higher EVI sum compared to the wildland cover in all metropolitan regions except Austin and Inland Empire (p < 0.05). Similarly post-hoc tests for each region showed a lengthening of the growing season in low density land covers for all regions except Austin and the Inland Empire (p < 0.05).
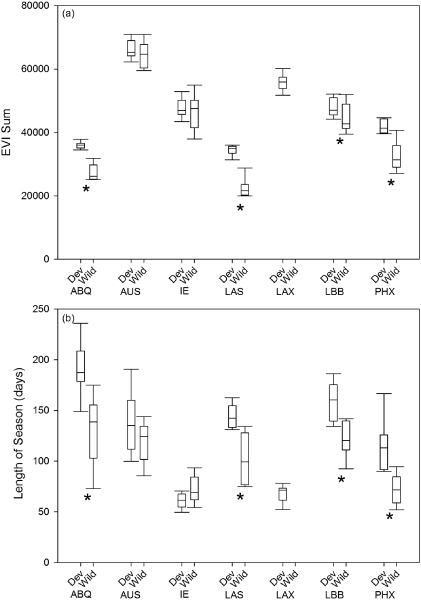
Figure 3. Enhanced vegetation index (EVI) sum (a) and length of growing season (b) box plots (mean, quartiles, range) over nine years for low density developed and wildland (grass, herb, and shrub) for seven southwestern metropolitan regions. Metropolitan region abbreviations are same as figure 1. * denotes pairs within a city significantly different (post-hoc; p < 0.05).
Download figure:
Standard image High-resolution imageUrbanization generally decoupled vegetation from precipitation (figure 4). Wildland cover EVI sum was strongly related to precipitation in all cities except Lubbock (p < 0.05). In Lubbock, one year was associated with unusually high vegetation; when this point, which had high leverage, was excluded, a positive vegetation–precipitation correlation was present. In contrast, no relationship (p > 0.1) was identified between EVI sum and precipitation within low density urban in all metropolitan regions except the two Mediterranean climate cities, Los Angeles and the Inland Empire (p > 0.05). For the Inland Empire region, the slopes between precipitation and EVI sum for both urban and wildland covers were not significantly different (F-test, p > 0.05).
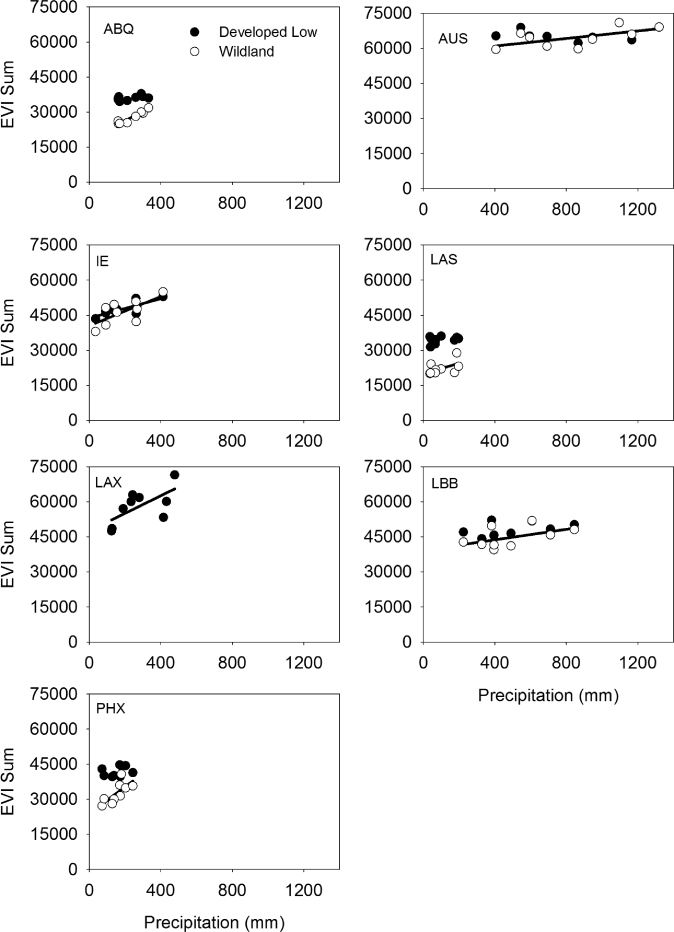
Figure 4. Sensitivity of enhanced vegetation index (EVI) sum to annual precipitation for low density developed and wildland (grass, herb, and shrub) land cover classes. Lines denote significant slopes (regression, p < 0.05). Metropolitan region abbreviations are same as figure 1.
Download figure:
Standard image High-resolution image3.2. Vegetation sensitivity to income distribution
In all cities, the distribution of vegetation was related to differences in neighborhood incomes (figure 5). Evaluating variation in EVI sum within low density urban land covers by using the top and bottom thirds of incomes identified both income and region as significant correlates (ANOVA p < 0.05). Post-hoc tests found all regions to have higher EVI sum in higher income land covers than lower income areas (p < 0.05). The absolute disparity differed among metropolitan regions with Los Angeles having the highest difference in EVI sum between income classes although the ratio of high to low income areas was highest in Phoenix. Lubbock had the lowest absolute and relative disparity. Corresponding differences in the growing season length were not observed among higher and lower income areas (ANOVA p > 0.05).
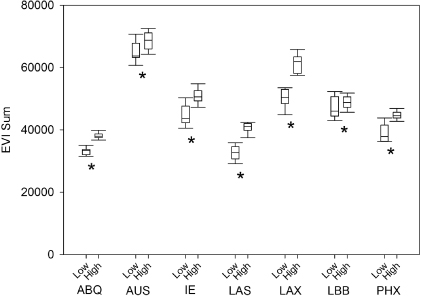
Figure 5. Box plots of differences in enhanced vegetation index (EVI) sum between the upper and lower thirds of neighborhood household income within the low density developed land cover class for seven cities. * denote significant differences (p < 0.01 for all) between income brackets within a single metropolitan region.
Download figure:
Standard image High-resolution image3.3. Variation among metropolitan regions
Of the potential independent variables evaluated only the per capita domestic water use scaled by precipitation was significantly related to the relative effect of urbanization on EVI sum (regression, p = 0.02, otherwise p > 0.1; figure 6). Cities using more water had a notably higher relative effect of urbanization on vegetation consistent with residents using more water for irrigation purposes. In contrast, the relative difference between high and low income EVI sum annual was only correlated with annual precipitation (regression, p = 0.04, otherwise p > 0.1; figure 6). As precipitation increased, high and low income areas became more similar across these metropolitan regions.

Figure 6. Correlates with the ratio of low density urban to wildland (grass, herb, and shrub) enhanced vegetation index (EVI) sum (left) and high to low income low density urban EVI sum (right). An index combining per capita water use and precipitation was the only significant predictor of urban vegetation enhancement (p = 0.02) while annual precipitation was the only correlate with the income effect across cities (p = 0.04).
Download figure:
Standard image High-resolution image
4. Discussion
In warm drylands of the southwestern United States we found urbanization has a strong but variable influence on vegetation greenness compared to adjacent wildland covers (figure 3). An urban vegetation effect hypothesis, which includes both changes to plant communities and irrigation, was supported in four metropolitan regions. In each region the cumulative EVI in low density urban was higher than wildland covers, cumulative EVI was decoupled from precipitation, and for four of the metropolitan regions the growing season was extended. Two metropolitan regions, Austin and the Inland Empire did not exhibit identifiable differences in vegetation patterns between land covers. In all regions except the two Mediterranean climate regions, urbanization decoupled vegetation from precipitation inputs (figure 4). Both of these regions also had no identifiable difference in growing season length between low density urban and wildland covers. These findings document strong effects of urbanization on vegetation and suggest future studies should look towards understanding whole metropolitan water fluxes directly. Our results suggest differences in dryland urban vegetation from more mesic regions where the amount of vegetation in cities is generally reduced (Imhoff et al 2010), primarily through replacement of continuous forests with impervious surfaces. For phenological timing, our results of expanded growing season are consistent with results from cooler and wetter northeastern metropolitan regions (White et al 2002, Zhang et al 2004, Elmore et al 2012)—although mechanisms likely differ from alleviating water limitation (drylands) to alleviating cold limitation to plant growth (temperate lands).
Across all regions in our southwestern US transect a clear difference in the amount of total vegetation was found between high and low socioeconomic areas with more vegetation occurring in higher income areas (figure 5). The socioeconomic effect was independent of overall differences between urban and wildland vegetation patterns—cities lacking such differences still showed socioeconomic effects. These findings reinforce a pattern of increased vegetation associated with more income (Mennis 2006, Luck et al 2009, Kirkpatrick et al 2011, Lowry et al 2012, Clarke et al 2013). The mechanisms behind the socioeconomic effect are complex and rely on combinations of direct effects by individuals, indirect effects of institutional resources, and potential feedbacks (Luck et al 2009, Lowry et al 2012, Clarke et al 2013). Disparities in access to vegetation have consequences for the availability of ecosystem services and vulnerability of individual residents to environmental hazards (Jenerette et al 2011).
Across the transect of dryland metropolitan regions, the difference between urban and adjacent wildland covers were variable for both the cumulative EVI and growing season length (figures 3 and 6). Further, we also observed differences in the magnitude of the disparity in vegetation between high and low income areas (figures 5 and 6). Variation in the urbanization effect on vegetation was related to a metric combining domestic water use and precipitation such that larger urban–wildland differences occurred in regions where domestic water use relative to precipitation was higher. This suggests an interactive effect between water management and climate influencing urban vegetation. The socioeconomic effect across these cities became more muted with higher precipitation—additional precipitation allows more vegetation with reduced requirements for irrigation. Across broader gradients the general increase in vegetation associated with dryland urbanization compared to decreases in more mesic environments (Imhoff et al 2010) suggests scale dependences in gradients of urban variation and homogenization. Similarly, while our data suggest a minimal socioeconomic effect on the amount of vegetation when annual precipitation is greater than 1000 mm, data from Baltimore, MD, a city in a mesic temperate region (1065 mm annual precipitation) show prominent socioeconomic effects on urban vegetation (Huang et al 2011). Further examination of vegetation patterns is needed from regional to continental and global scale gradients to better resolve variation in urban vegetation.
Changes in vegetation patterns will influence ecosystem functioning and in part determine the amount and timing of ecosystem services availability for urban inhabitants (Jenerette et al 2011, McCarthy et al 2011). Reconciling the dynamics of urban vegetation in drylands and the trade-offs with irrigation requirements is a key research challenge for understanding vegetation dynamics in highly managed environments and sustainable decision making in cities. This water–ecosystem service nexus is a critical tradeoff when using vegetation to enhance urban resilience and can lead to potential unintended consequences, particularly in hot climates where shading by trees cools the ambient environment (Jackson et al 2005, Jenerette et al 2011, Pataki et al 2011a, Georgescu et al 2012). Design choices associated with built landscapes, species selection, and management activities can all influence urban vegetation and associated water use (McCarthy et al 2011, Pataki et al 2011a, Georgescu et al 2012, Vico et al 2013). Future trajectories of vegetation dynamics, ecosystem service provisioning, and water requirements in urbanized regions will likely respond to several changing conditions including climate, desires, and water availability. Our findings of large changes to vegetation patterns in drylands and distinct differences within cities based on income segregation and among cities based on coupled climate and water use variation looks towards more synthetic urban ecology beyond individual city evaluations.
Acknowledgments
We thank the National Science Foundation (DEB 0919006, 0919381, 0918905, 0814692, 1049224) and Natural Science Foundation of China under (Grant Number 30970504) for their support of this research. Robert Johnson provided valuable assistance with database acquisition and organization.