
Abstract
Recent studies on the relationship between thermoelectric cooling and water resources have been made at coarse geographic resolution and do not adequately evaluate the localized water impacts on specific rivers and water bodies. We present the application of an integrated electricity generation–water resources planning model of the Apalachicola/Chattahoochee/Flint (ACF) and Alabama–Coosa–Tallapoosa (ACT) rivers based on the regional energy deployment system (ReEDS) and the water evaluation and planning (WEAP) system. A future scenario that includes a growing population and warmer, drier regional climate shows that benefits from a low-carbon, electricity fuel-mix could help maintain river temperatures below once-through coal-plants. These impacts are shown to be localized, as the cumulative impacts of different electric fuel-mix scenarios are muted in this relatively water-rich region, even in a warmer and drier future climate.
Export citation and abstract BibTeX RIS

Content from this work may be used under the terms of the Creative Commons Attribution 3.0 licence. Any further distribution of this work must maintain attribution to the author(s) and the title of the work, journal citation and DOI.
1. Introduction
In average years, the Apalachicola/Chattahoochee/Flint (ACF) and the Alabama–Coosa–Tallapoosa (ACT) river basins provide freshwater supplies that far exceed the anthropogenic demands for water in their region of the southeastern United States, which includes the states of Georgia, Alabama, and Florida. Despite being water-rich relative to many regions of the United States, a number of factors lead this area to be known for conflict among different water users and among the three states involved. Against a context of continued rapid population growth and changing climatic conditions, even relatively small changes in water demands could have substantial impacts.
In addition to municipal, industrial, environmental, and agricultural interests, a large portion of a region's water withdrawals often go to meeting the cooling water needs of thermoelectric power plants (Feeley et al 2008, Macknick et al 2012a). Depending on the type of cooling technology employed, thermoelectric generation leads to either much of that water being consumed through evaporation (as in recirculating cooling systems) or much of it being returned to the original source at a higher temperature (as in once-through cooling systems). Therefore, the impacts of thermoelectric generation on a river basin depend in large part, on the mix of electricity generation technologies used in that basin. Both cooling technologies are currently used in the power plants across the ACF/ACT region, thus the future water resource impacts of electricity generation in the region will be strongly influenced by the mix of electricity generation technologies employed.
Traditional coal and nuclear fuel-based thermoelectric cooling technologies are based on either recirculating cooling systems, where a large portion of the withdrawn water is consumed through evaporation or once-through cooling systems, where less water is evaporated but is returned to the original source at a higher temperature (Averyt et al 2013). Kenny et al (2009) estimate that more than 40% of all US freshwater withdrawals are for thermoelectric cooling, with the majority of this from once-through plants east of the Mississippi river. Newer cooling technologies for coal or nuclear fueled thermoelectric plants include dry and hybrid cooling, which use less water but are less efficient (Macknick et al 2012a, 2012b). Natural gas fueled, steam-based systems using recirculating cooling consume equivalent amounts of water when compared with their conventional fueled counter-parts, but are often configured as combustion turbine, non-steam based systems that use less water.
A growing literature examines the impacts of electricity generation choices on water resources in North America. Some of these studies consider electricity generation at coarse geographic levels reflecting region impacts (NETL 2010, Elcock 2010, Chandel et al 2011), while others offer more refined geographic resolution to evaluate the localized water impacts on specific rivers and water bodies (Kimmell and Veil 2009, Koch and Vögele 2009). Studies by EPRI (2011) and Roy et al (2012) disaggregate electricity demand according to existing generation and transmission to explore the regional impacts of the electricity sector's water withdrawals. Other studies focus on the hydrology side and do not isolate the implications of the electricity mix scenarios from other drivers, such as climate and population trends (Caldwell et al 2012), or they focus on the electricity mix scenarios but do not include the specific details of the water system (e.g. Tidwell et al 2012, Macknick et al 2012a). The study by Stewart et al (2013) applied a spatially distributed water temperature and thermoelectric power plant model to look at the contemporary period benefits and costs of thermoelectric cooling.
Macknick et al (2012a, 2012b) modeled changes in water use based on the spatially-aggregated, but continental US wide, output of electricity mix scenarios developed with the regional energy deployment system (ReEDS) model for alternative electricity build-out scenarios from 2008 to 2050. This paper offers a spatially-explicit analysis of electricity mix scenarios also using ReEDS results, but focusing on the impacts on the water resources of a portion of the southeastern United States as described in Flores-Lopez and Yates (2013). Our analysis links the changes in water use under different electricity mix scenarios with a detailed model of the ACF/ACT region's water system implemented through the water evaluation and planning system (WEAP) modeling platform (Yates et al 2005). While most cases of thermoelectric generation curtailment in the southeast are due to water temperature constraints, the fact is, this constraint is largely a result of the compounding effects of warm air temperatures, lower flows, and in some cases, warmer return flows.
This approach is an opportunity to investigate both regional changes and localized results, because it pairs a model of geographically specific projections of electricity generation with a detailed model of both the anthropogenic and natural aspects of the hydrologic systems of the ACF and ACT basins. Therefore, in addition to examining ACF/ACT region-wide impacts on water resources, we focus on relative changes in water volume and temperature at specific locations along the Chattahoochee and the Coosa Rivers as correlated with different region-wide electricity mix futures. The lessons of these case studies can be applied for understanding the possible impacts of different electricity mix futures on water systems similar in characteristics to the ACF and ACT basins, both across the southeastern United States and more generally.
2. Background: the ACF and ACT basins
The ACF/ACT basins cover more than 40 000 square miles of Georgia, Alabama, and Florida, reaching from the Blue Ridge Mountains to the Gulf of Mexico (figure 1). Among other uses, the system provides water to municipalities across the three states but primarily in Georgia, irrigation agriculture on the southern reaches of the Chattahoochee and Flint Rivers, hydropower through impoundment of major rivers, the Apalachicola Bay commercial fishing industry, and environmental demands across Georgia, Alabama, and Florida.
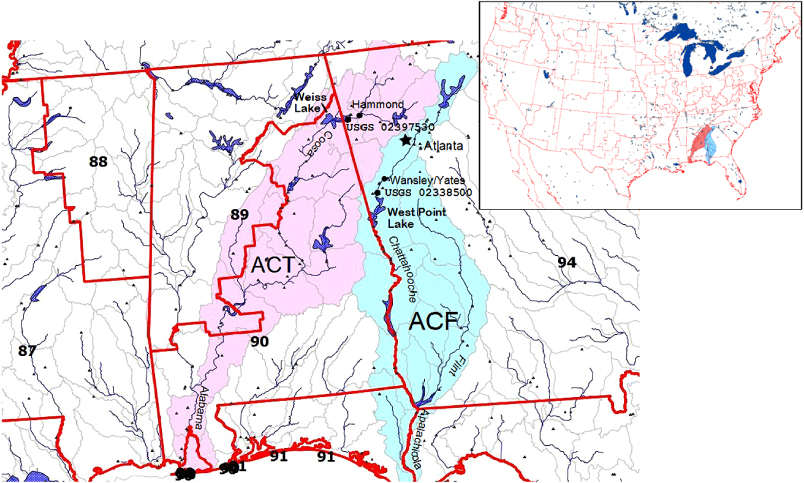
Figure 1. The region included in the WEAP-SE model and locations of interest. The small marks show the location of all power plants, including hydro-electric. The red boundaries show the Power Control Authority (PCA), with the ACF–ACT basins falling roughly within three of those regions (PCA 89, 90, and 94).
Download figure:
Standard image High-resolution imageDespite the relatively large volumes of water typically flowing in both the ACF and the ACT, water issues in these basins often make headlines, and the three states have a history of legal and political conflict over the use of the waters (Ruhl 2005, Thornley 2005, Water Policy Institute 2009). Much of the controversy surrounds the water demands of Atlanta, GA, that are driven by its large and rapidly growing population. After the US Supreme Court refused to hear an appeal by Alabama and Florida against the Eleventh Circuit Court's 2011 decision, the Army Corps of Engineers remains authorized to deliver up to 190 million gallons per day annually to Atlanta from Lake Sidney Lanier on the Chattahoochee River (USACE 2012).
The water demands for supporting municipal growth come into conflict against many other demands for the water of these basins, including not only agricultural and industrial but also environmental demands. Potential changes in reservoir water levels in the ACF/ACT, due to changing operating procedures, would produce 'immense economic impacts' on recreational, property, and nonuse values (Hanson et al 2002). The aquatic biodiversity of Alabama and its neighboring states, for example, includes numerous endangered species yet rivals that of high profile tropical ecosystems celebrated internationally (Lydeard and Mayden 1995). The Apalachicola Bay in Florida generates over $100 million per year from commercial oyster and other species fishing (Thornley 2005).
3. Methods
This paper describes the results of integrated water-energy modeling for the Alabama–Coosa–Tallapoosa (ACT) and Apalachicola–Chattahoochee–Flint (ACF) river basins in Georgia, Alabama, and Florida of the southeastern United States. The electric-generation analysis is based on Clemmer et al's (2012) future scenarios of the United States power sector from 2010 to 2050. These scenarios were generated with the National Renewable Energy Laboratory (NREL)'s long-term capacity expansion and dispatch model: the regional energy deployment system (ReEDS). ReEDS represents all major electricity generation technologies, including coal, natural gas combined-cycle, natural gas combustion turbines, fossil fuels with carbon capture and storage (CCS), nuclear, hydropower, wind, solar, geothermal, biopower, and storage (Short et al 2011). The model represents the US electricity generation and transmission systems at the scale of the Power Control Authority (PCA) area, given by the red boundaries in figure 1. Future prices, costs, electricity demand, and other relevant factors such as technology performance follow assumptions generated by the EIA's Annual Energy Outlook 2011 (USEIA 2011) reference case (EIA 2011), as well as from NREL analysis on actual power plant retirements (Short et al 2011) and publicly available information on plant retirements and planned additions.
To investigate the implications of different water uses in a regional context, Flores-Lopez and Yates (2013) incorporate spatially-explicit results of thermoelectric and other water uses into a detailed water resource simulation model of the ACF and ACT. This model, built on the Water Evaluation and Planning modeling platform (WEAP; Yates et al 2005), is referred to as WEAP-SE and represents both the natural and anthropogenic hydrology of the ACF and ACT river basins, including the physical infrastructure and historic and projected future demands for water.
The output of the ReEDS model is monthly thermoelectric water demand and is incorporated into the WEAP-SE model following the 'hand-shake' procedure described in detail by Sattler et al (2012). ReEDS geographies at the sub-state electricity PCA area shown in red in figure 1 are translated proportionally into WEAP geographies (i.e., water catchment objects defined by 8-digit HUCs and elevation bands). The projected electricity generation technology mixes are converted into water withdrawal requirements by ReEDS and WEAP-SE then estimates the consumption volumes based on the electricity generation technology water use coefficients reported by Macknick et al (2012a). Other competing water demands include municipal and industrial indoor use prescribed on a per-capita basis, outdoor municipal turf and amenity water, irrigated agriculture, environmental requirements, and hydropower generation. Crop water demand is simulated through estimates of potential evapotranspiration and soil moisture deficits. The regional population grows from five to nine million over the period 2010–2050. More details are reported in Clemmer et al (2012), Sattler et al (2012), Macknick et al (2012b) and Flores-Lopez and Yates (2013).
The analysis focused on two regions within each river basin. In the ACF basin, we present modeling results for a stretch of the Chattahoochee River west of Atlanta, just downstream from the Wansley Electric Generating Plant, a 3939 MW power plant fueled by coal (44%), natural gas combined-cycle (55%), and oil (1%), cooled with recirculating cooling. For the ACT basin, we present modeling results for the Coosa River above Weiss Lake, which was originally impounded for hydro-electric power generation but now also is a destination fishing lake that provides important tourism income for Cherokee County, AL (Glover 2012). Several power plants lie upstream on the GA side of the border, the nearest of which is Plant Hammond, an 800 MW coal plant with once-through cooling.
3.1. Electric-sector scenarios from ReEDS
Five different electricity mix scenarios are used in the analysis and are summarized in table 1 (Clemmer et al 2012). They include one 'business-as-usual' scenario (BAU); three carbon-constrained scenarios emphasizing different low-carbon technologies, and one fossil fuel intensive scenario. The three carbon-constrained scenarios include carbon budget (CB); a scenario that utilizes coal but with carbon capture and storage and has higher overall nuclear deployment (CCSNK); and a scenario of greater penetration of renewable energy technologies and improved energy efficiency (REE). A fifth scenario is based on the Annual Energy Outlook (AEO) and is an alternative reference case in which coal remains as a dominant electricity generation technology fuel instead of being phased out in the upcoming decades. Figure 2 shows the dominance of coal generation in the region, the growth of natural gas in some of the future scenarios, and the marginal role that new solar power generation is likely to play.
Table 1. Summary of key differences among electricity mix scenarios.
| Scenario number | Carbon budget? | Generation technology focus |
|---|---|---|
| 1. BAU | No | None (natural gas dominates) |
| 2. CB | Yes | Carbon budget with US electric-sector targets of 170 Gt-CO2eq. No technology targets. |
| 3. CCSNK | Yes | Carbon budget with coal generation that includes CCSa; and more nuclear |
| 4. REE | Yes | Carbon budget, with renewable energy; energy efficiency; reductions in energy use. |
| 5. AEO | No | Annual energy outlook, coal remains. Not carbon budget |
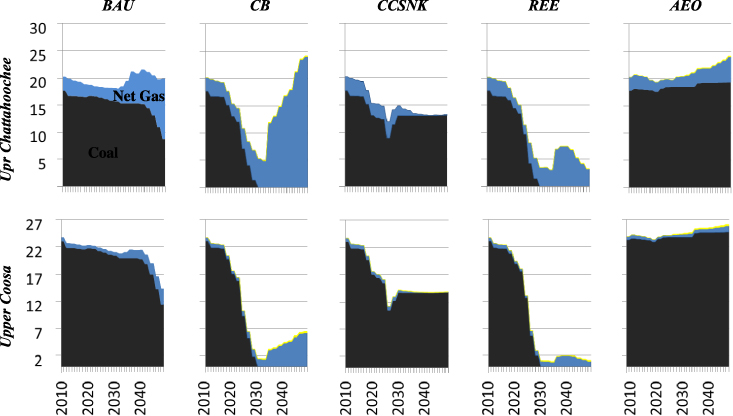
Figure 2. Thermoelectric generation in millions of MwH by fuel type in Upper Chattahoochee (upper) and the Upper Coosa (lower) for each of the electricity mix scenarios; including natural gas (blue), coal (dark), and solar (yellow).
Download figure:
Standard image High-resolution image3.2. WEAP-SE methods and assumptions
The WEAP-SE model is comprised of a collection of catchment objects that simulate the lateral runoff and thermal loading from the watershed, to the stream (Flores-Lopez and Yates 2013). The thermal contribution from catchment runoff assumes a recharge temperature equal to the monthly mean air temperature, which is volume-weight mixed with the flows at each WEAP-SE node. From ReEDS, we have the monthly cooling water requirements for a given thermoelectric generation mix that are passed directly to WEAP-SE nodes.
The temperature difference between the intake and discharge water for once-through plants is assumed to be 12 °C (Baile 2007; Madden et al 2013). Recirculating plants are assumed to only reduce the downstream flow volume, and so downstream equilibrium temperatures correspond to the mixed, volume-weighted condition. The WEAP-SE model accounts for natural and anthropogenic heat loading, discharge, and re-equilibration of the riverine system as flows propagate downstream.
While water volume is certainly an important performance metric for evaluating the relative merits of the different fuel-mix alternatives, most restrictions to thermoelectric generation are due to water temperature exceedance (Eaton 2012 and Sovacool and Sovacool 2009). In the United States, discharges of thermal effluent are managed by individual states but regulated through the Environmental Protection Agency's national pollution discharge elimination system (NPDES) permit program. Water quality standards vary by state, but typically require surface water to remain under 32 °C (Madden et al 2013). The WEAP-SE model was used to simulate river temperatures above and below important withdrawal and discharge points to explore the relative impact of the various thermoelectric fuel-mix alternatives. Note that ReEDS passes water withdrawal estimates to WEAP-SE under assumptions of a future generation portfolio, but does not have information on environmental constraints. Therefore, no generation restrictions or plant shut-downs occur during critical warm periods and so the results are indicative of worst-case conditions.
Upon successful calibration of the WEAP-SE model for the contemporary period 1949–2010 as detailed in Flores-Lopez and Yates (2013), the WEAP-SE model was configured to be forward projecting for the 42-year period 2008–2050. This was done by generating a future climate sequence based on the paleo-climate, Palmer drought severity index (PDSI) from Pederson et al (2012), which is shown in figure 3. This reconstruction suggests that there have been long periods of extended dryness throughout the southeast. We used this paleo-climate information to guide the resequencing of the observed, historic record that includes the years 1950–2008 from the monthly climate data of Maurer et al (2010). We extracted the PDSI values for the particularly dry period of 1715–1758, highlighted in gray in figure 3, which were then mapped to contemporary period PDSI values. For example, the PDSI value for the year 1715 was estimated by Pederson et al (2012) at −3.9, which we mapped to the PDSI of 2007, with a value of −2.9; the 1716 PDSI estimate is −1.45, which was mapped to the year 1955 with a PDSI value of −1.2, and so on.
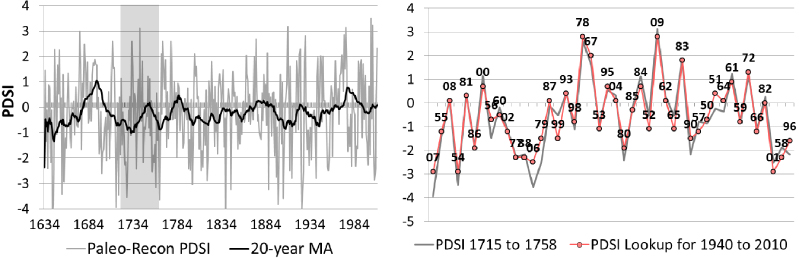
Figure 3. The left graph is the paleo-reconstructed, PDSI dating back to the 1600s for the ACF Basin from Pederson et al (2012) along with a 20-year moving average. The shaded area shows the portion of the time series that was used to inform the development of the future climate sequence. The right graph is the reconstructed PDSI for the period 1715–1758 (gray) and the 42-year future reconstructed PDSI and the corresponding two-digit year index (e.g. '07 is 2007, '55 is 1955, etc).
Download figure:
Standard image High-resolution imageThe monthly climate data (temperature, precipitation, humidity and wind speed) for each selected year from the contemporary period were then used for the future climate time series, and included a linearly increasing warming trend of 2 °C by mid-century (Tebaldi et al 2005). The total precipitation over the study domain for the 42-year, paleo-informed climate sequence is 5% less than the precipitation for the observed period 1950–1990. The resulting climate sequence is summarized in figure 4, and shows the strong warming trend and overall drier conditions for the future period.
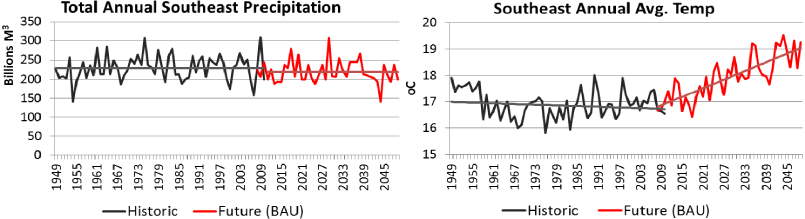
Figure 4. Climate summary for the ACF–ACT Basins with total annual precipitation (left) and annual average temperature (right) derived from the monthly values of all 44 catchment objects. The climate of the recent past (dark) is included before the future period (red) used for the WEAP-SE simulation.
Download figure:
Standard image High-resolution image3.3. Caveats and limitations
We present the results of this modeling exercise as the implications of electricity mix scenarios for future water resources in the southeastern United States, so the caveats and limitations of the component models extend to our findings. Notable among these, the use of down-scaled ReEDS model output means that we assume no optimization or dynamic adjustment for water vulnerabilities or impacts, either in terms of technology (such as the induced installation of new storage facilities, changes in cooling technology, or the addition of helper towers) or in terms of power plant operations. In other words, we describe likely water resource impacts of different electricity mix scenarios conditional on these issues being not addressed in the implementation of these scenarios. As such, the results can be interpreted either as a projection of expected future impacts, or, more fruitfully, as a warning of issues that may merit attention to avoid the potential negative impacts we present. In addition, although one of the main results below pertains to the impact of thermoelectric generation on water temperatures, we do not model the consequent effects of forced evaporation from surface water bodies, which research in progress (Diehl 2012) suggests may be quite substantial and would amplify the impacts we estimate. Although changes in power plant technology occur as discrete changes, our model 'hand-shake' procedure represents these as continuous (smooth) changes; projected water impacts therefore are smoothed over time.
In addition, we focus on two specific locations to demonstrate the water resource impacts for the two most common cooling technologies for thermoelectric generation (figure 1). The Chattahoochee River at and above Plant Wansley includes several coal and natural gas generating facilities as well as metropolitan Atlanta. Plant Wansley is a multi-fuel system that includes coal, gas, and oil with a total capacity of about 3939 MW using recirculating cooling technology. Just upstream of Wansley is Plant Yates that was a once-through coal fired plant with a capacity of 1200 MW, was converted to recirculating cooling, and will be converted to natural gas by 2015. Plant Hammond on the Coosa River is a classic, once-through plant with a total capacity of 800 MW. Upstream of Coosa are some large, recirculating coal-plants including Plant Bowen, the second largest generating plant in the Western Hemisphere at nearly 3200 MW using recirculating cooling. The analysis for the Coosa River corresponds to USGS Gage 02397530, which is about 25 km downstream of the Plant Hammond discharge and upstream of Weiss Lake; and for the Chattahoochee, USGS Gage 02338500 at Franklin, about 18 km downstream of the Plant Wansley discharge.
4. Results
The water resource impacts of the electricity mix scenarios at any location in the model represent the compounded results of many model components and do not necessarily pertain to any one specific (modeled) power plant. However, in this water-rich region, resource impacts from any one source tend to be localized rather than felt across the entire basin. So although numerous results come from this modeling exercise, after presenting general results on region-wide impacts, this paper focuses on the water resources implications of the different electricity mix scenarios at the points on the Chattahoochee River and the Coosa River that we have described above and are generically referred to as Wansley and Hammond, respectively, in figure 1.
4.1. Background trends driven by climate and population growth
All five electricity mix scenarios are modeled against a background of a growing population, increasing average air temperatures, and decreasing precipitation. In WEAP-SE, demand priorities are ranked from highest to lowest, as: environmental flows, urban indoor, urban outdoor, agriculture, and hydropower. Municipal water supplies are mainly from surface sources, while agriculture is primarily from groundwater (GDNR 1997). We have assumed that outdoor turf and amenity acreage remains constant, with the variability of delivered water driven by climate variability and water availability that serves a growing population.
The cumulative effect of these assumptions and trends can be observed in figure 5, which depicts the modeled freshwater deliveries for municipal and agricultural uses throughout the ACF Basin based on the BAU electricity mix scenario. The figure reflects the trend of increasing population growth throughout the region, with annual municipal withdrawals increasing from about 0.8 billion cubic meters or BCM (0.64 million-acre-feet or MAF) to greater than 1.0 BCM (0.81 MAF) over the 42-year future period. Agricultural withdrawals range from about 1.0 to 3.0 BCM over the simulation period, with groundwater the primary source of supply. Georgia Department of Water Resources estimates agriculture withdrawals ranging from 0.56 BCM (0.45 MAF) during wet years, to 2.1 BCM (1.8 MAF) in dry years at 2008 levels of production, with about 80% of those supplied by groundwater (Hook 2010).
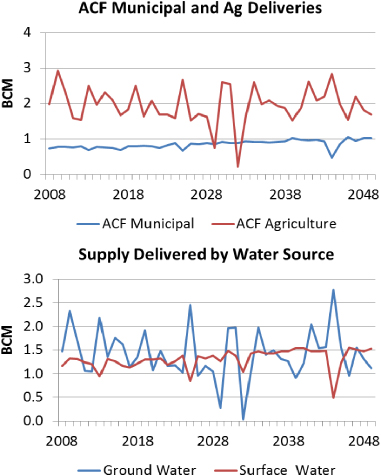
Figure 5. Modeled freshwater deliveries to the municipal and agricultural users of the ACF basin (left) and the surface and groundwater supplies used. Results are from the BAU electricity mix scenario.
Download figure:
Standard image High-resolution imageThe low water delivery in 2044 corresponds to severe drought conditions, with corresponding water shortages in the municipal sector, whose primary source is surface water. During this period, agriculture turns to groundwater with even greater intensity to make up for surface water shortages.
Figure 6 presents the annual total discharge to the Gulf of Mexico of the ACF on the Apalachicola River (red, lower lines) and the ACT on the Alabama River (blue, upper lines) for the BAU electricity mix scenario. Flows at these downstream locations demonstrate the overall impact of the decreased precipitation over the simulation period, with the 10-year end-of-period average annual discharge 15% and 19% less than the first 10-years of annual discharge for the ACF and ACT rivers, respectively. While the hydrologic simulation is forced by a drier, paleo-informed climate sequence, the flows are still in close proximity to the historic mean for the period 1950–2010. Note that the discharges leaving these basins are substantially greater than the water withdrawals from them. Figure 6 includes the annual flows of these rivers below two select analysis points—Plant Hammond and Plant Wansley.
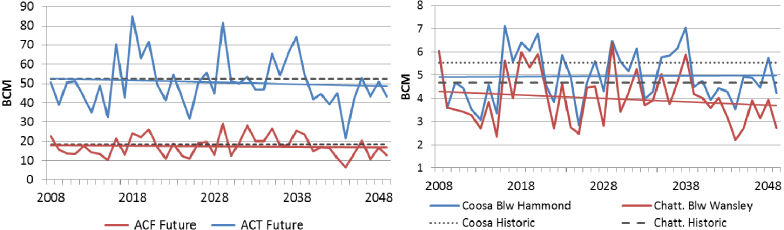
Figure 6. Simulated, future total annual discharge for the ACF and ACT rivers (left) and for the Coosa River below Plant Hammond and the Chattahoochee River below Plant Wansley. The dashed line is the historic average of the river flows for the period 1950–2010 and the solid, thin lines are the trend through the future simulated series.
Download figure:
Standard image High-resolution imageAs precipitation (and therefore discharge) decreases and air temperature increases over the modeled time period, water temperatures rise. Figure 7 shows the average annual (left) and August (right) river water temperatures at the key analysis points on the ACF (below Plant Wansley), the ACT (below Plant Hammond) and the mostly unregulated Flint River (Dyar and Alhadeff 1997). The annual average temperature increases by about 1.5 °C over the 42-year simulation period. The influence of the thermoelectric discharge below Plant Hammond on the Coosa River is evident, as both annual and August values are considerably higher when compared with the river temperatures on the analysis points of the Chattahoochee or Flint Rivers. River temperatures are considerably higher from around 2040 to 2045 corresponding to more extreme drought and lower flows. The warmer river water temperature trend is greater in the Chattahoochee and Flint rivers, as the influence of the thermoelectric discharge on the Coosa Rivers tends to mask the warming due to climate.
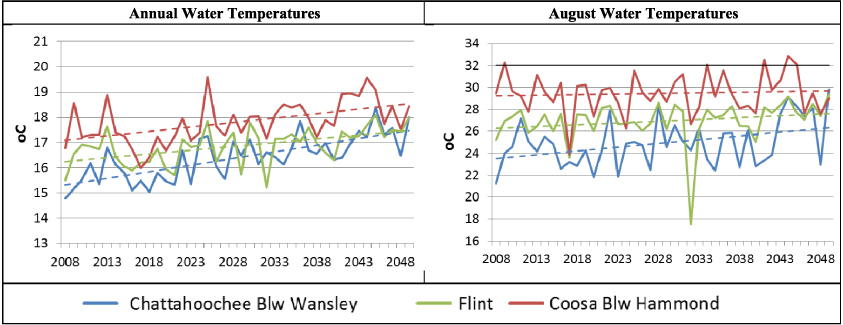
Figure 7. Average annual (left) and August (right) streamflow temperatures on the Chattahoochee River below Plant Wansley, the Coosa River below Plant Hammond, and the Flint River at the confluence for the future 42-year modeling period. The 32 °C thermal threshold is highlighted (right).
Download figure:
Standard image High-resolution image4.2. Relative impacts of electricity fuel-mix scenarios
The above results provide the context of general water resource trends over the modeled period, but they all pertain to the reference or business-as-usual (BAU). As our purpose is to investigate the differences in impacts to water resources of the different electricity mix scenarios, this section focuses on relative differences among the various electricity fuel-mix scenarios versus the BAU.
One point of general observation is that thermoelectric plants which sit higher up in their respective watershed, closer to the river's headwaters, are likely to be more susceptible to generating constraints, either in the form of thermal discharge limits or water volume limits. Anecdotally, most inland thermoelectric plants that are classified as 'once-through', in fact, reside on lakes and ponds, as their river flow rates can be too small to function as effective heat sinks.
4.3. Differences in seasonal river discharge volumes
Figure 8 shows the implied fuel-mix for each scenario through the annual water withdrawals for the three main fuel-mix and cooling technologies—coal with once-through coal, coal with recirculating cooling, and natural gas with recirculating technologies. Where there is once-through cooling in the Upper Coosa Basin, withdrawals are much larger. The Carbon Budget and Renewable Energy-Energy Efficiency scenarios show coal based thermoelectric generation disappearing before 2030. In the Upper Chattahoochee River coal generation declines, but where it remains, carbon capture technologies emerge.
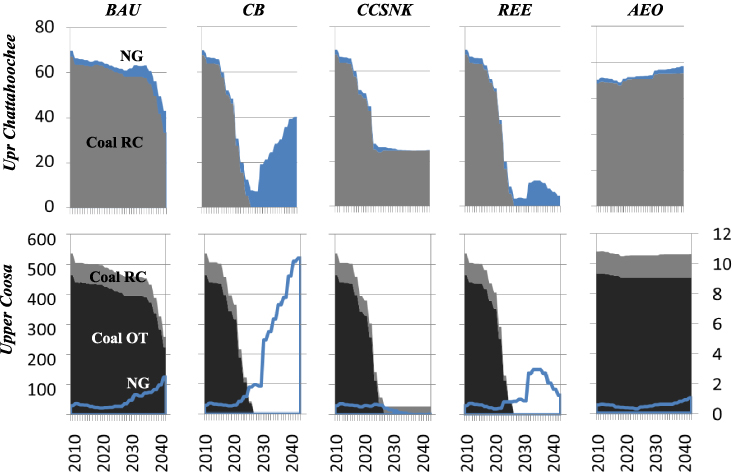
Figure 8. Annual water withdrawal in the Upper Chattahoochee River (MM3) and the Upper Coosa River for coal once-through (OT), coal recirculation (RC) and natural gas (NG). For the Upper Coosa River, natural gas is plotted against the secondary y-axis.
Download figure:
Standard image High-resolution imageFigure 9 shows the monthly change in water flows below Plant Wansley, just upstream of West Point Lake; and below Plant Hammond, just upstream of Lake Weiss for each of the alternative fuel-mix scenarios, relative to the BAU scenario. We've placed the changes on the same scale to highlight the larger percentage increase in flows on the Chattahoochee as compared to the Coosa River. The peak change in percentage terms typically occurs in late summer and fall, when the river discharges are lowest. The Chattahoochee and Coosa flows are comparable in terms of total volume at these two locations (see figure 6), but upstream on the Chattahoochee River, thermoelectric cooling is dominated by recirculating coal-fuel systems, whose consumption fraction is greater. Reduction in this fuel-mix technology leads to greater water savings and thus greater inflows to Lake Weiss. The difference among the various carbon budgeted scenarios (CB, REE and CCSNK) are modest, while the AEO scenario shows an overall decrease in streamflow due to greater consumption.
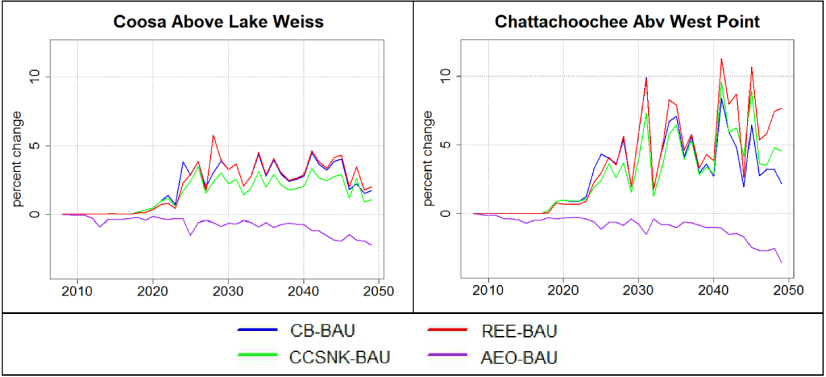
Figure 9. Maximum annual per cent change in flows for the different thermoelectric fuel-mix scenarios relative to the BAU scenario for the Coosa River below Plant Hammond (left) and the Chattahoochee River below Plant Wansley (right).
Download figure:
Standard image High-resolution image4.4. Differences in seasonal river temperatures
Figure 10 shows the change in temperature for the various fuel-mix scenarios relative to BAU scenario, showing the corresponding reduction in Coosa river temperatures as Plant Hammond's once-through generation is reduced. Peak summer water temperatures are nearly 8 °C cooler under the low-carbon fuel-mix scenarios when compared with the BAU scenario. By mid-century, the relative benefit of the low-carbon fuel-mix scenario declines, as the much drier and warmer conditions dominate all scenarios. Interestingly, the AEO scenario shows an increase in water temperatures corresponding to the lower flows and higher temperatures. On the Chattahoochee River, the various fuel-mix scenarios lead to a relatively modest increase in temperatures, as there is an intensification of water consumption, leading to reduced flows and slightly elevated temperatures, with a summer maximum increase of about 0.2 °C. The peak in the summer of 2044 corresponds to very low-flows due to drought. Chattahoochee River temperatures are much lower despite there being less water here and, most importantly, modest differentiation among the various low-carbon fuel-mix scenarios.
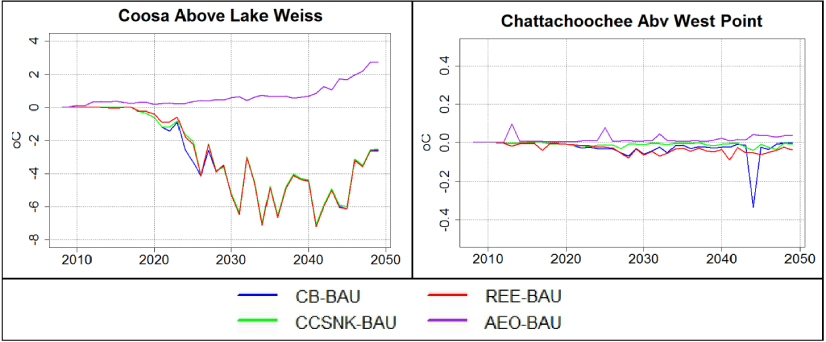
Figure 10. Maximum annual difference in river water temperatures for the Coosa River above Lake Weiss and below the once-through coal plant Hammond (left) and the Chattahoochee River above West Point Lake and below the discharge from Plant Wansley (right) in degrees Celsius.
Download figure:
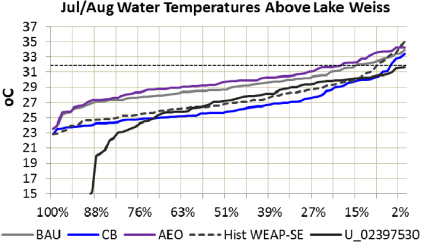
Standard image High-resolution imageFigure 11 shows the observed (USGS Gage 02397530) and simulated July and August water temperatures plotted as frequency distributions for the historic period of 1971–2010. The figure also includes simulated temperatures for July and August, for the future BAU, carbon budget (CB) and high-carbon AEO scenarios. Two modeling assumptions keep the historic simulated temperatures above the observation for the higher frequency temperatures (>75%) and lower frequency temperatures (<10%), as we have assumed constant plant operation and no power output reductions due to water temperature exceedences, respectively. Thus, reductions in power output at Hammond would result in lower water temperatures, while continued power output even during low-flow, high temperature events, would lead to elevated water temperatures. Under the assumed future warmer and drier conditions, the BAU and AEO scenarios show elevated river temperatures. Thermal temperature exceedences go from about 8% for the historic period to about 18% for the both the BAU and AEO scenarios, which generally maintain once-through cooling. The CB scenario, which eliminates once-through cooling by around 2028, suggests that river temperatures could generally be maintained near or below historic levels, despite warmer and drier conditions.
Figure 11. July and August observed (U_O2397530) and simulated river temperatures below Plant Hammond and above Lake Weiss given as frequency distribution. Plot includes th BAU, two alternative fuel-mix scenarios (CB and AEO) and the historic simulation for the period 1971–2010. The horizontal, dashed line is the 32 °C mark, where is often the regulated temperature threshold.
Download figure:
Standard image High-resolution image
5. Discussion and conclusions
Throughout the southeastern US, there is considerable carbon-based thermoelectric generation that is withdrawing and then consuming or changing the quality of the region's water resources. Most studies that have explored the implication of thermoelectric generation on the water resources of the region have not done so with sufficient geographic resolution to adequately evaluate localized water impacts. Under the premise that location matters, this analysis developed a regional water resources planning model based on the water evaluation and planning system (WEAP-SE) that simulates the hydrology and water resources of the region. The model begins from the source water, through the river and distribution system, and includes the many reservoirs, demands, and diversions of Apalachicola/Chattahoochee/Flint (ACF) and the Alabama–Coosa–Tallapoosa (ACT) Rivers (Flores-Lopez and Yates 2013).
While these basins are water-rich relative to many regions of the United States, the area is known for conflict among different water users and among the states that share its waters. The WEAP-SE model was used to explore the relative impact of alternative, low-carbon thermoelectric generation in the region within the context of continued population growth and warmer and drier climatic conditions. The analysis focused on the overall impact of these energy choices on the river system, noting that in the aggregate, both the water withdrawn and consumed for thermoelectric cooling is a small fraction of the total available. In addition, we have assumed that agricultural irrigators would make greater use of groundwater under severe drought conditions, which reduces stress on surface water supplies (GDNR 2011). Our future warm and dry scenario suggests that the system could be stressed if drought conditions persist, and choices will need to be made between competing water uses. In this case, all water use sectors would be impacted. Even at the margins, changes in the thermoelectric fuel-mix could benefit these rivers.
However, the real benefit from low-carbon, thermoelectric generation will manifest themselves locally. We generally observe that thermoelectric plants which sit higher up in their respective watershed, closer to the river's headwaters, are likely to be more susceptible to generating constraints, either in the form of thermal discharge limits or water volume limits (Stewart et al 2013). In our analysis, we focused on two places within the ACF–ACT rivers. One where once-through cooling is still prominent—the Coosa River below Plant Hammond; and another where changes are rapidly occurring in the way thermoelectric plants use water—the Chattahoochee River below Plant Wansley. Our analysis shows that any of the alternative, low-carbon technologies would improve the water quality of the Coosa River by lowering the river temperatures above Lake Weiss by as much as 8 °C in mid-summer. Modeling results suggest that on the Coosa River, thermal limits have historically reduced the plant's generation capacity by about 8% in July and August. Under future drier and warmer conditions, with once-through cooling still in place, this limit was estimated to increase to about 18%. Under pronounced warming and drying and thus persistent drought, the analysis shows that relative benefits of these fuel-mix changes would decline, as the overall water system becomes more stressed.
Acknowledgments
This work was supported by The Kresge Foundation, Wallace Research Foundation, and Roger and Vicki Sant. We greatly appreciate the support and insight of the Union of Concerned Scientists, the Energy and Water in a Warming World (EW3) contributors, the EW3 Scientific Advisory Committee (Peter Frumhoff, George Hornberger, Robert Jackson, Robin Newmark, Jonathan Overpeck, Brad Udall, and Michael Webber), and particularly Doug Kenney for insight into the regional context. Additional support was provided through the Western Water Assessment and the Cooperative Institute for Research in Environmental Sciences at the University of Colorado Boulder. This work was also supported through the Assessment Program at the National Center for Atmospheric Research and through a NOAA Societal Applications Research Program (SARP) grant (NA10OAR4310186).