
Abstract
A functional measuring, monitoring, reporting and verification (MRV) system is essential to assess the additionality and impact on forest carbon in REDD+ (reducing emissions from deforestation and degradation) projects. This study assesses the MRV capacity and readiness of project developers at 20 REDD+ projects in Brazil, Peru, Cameroon, Tanzania, Indonesia and Vietnam, using a questionnaire survey and field visits. Nineteen performance criteria with 76 indicators were formulated in three categories, and capacity was measured with respect to each category. Of the 20 projects, 11 were found to have very high or high overall MRV capacity and readiness. At the regional level, capacity and readiness tended to be highest in the projects in Brazil and Peru and somewhat lower in Cameroon, Tanzania, Indonesia and Vietnam. Although the MRV capacities of half the projects are high, there are capacity deficiencies in other projects that are a source of concern. These are not only due to limitations in technical expertise, but can also be attributed to the slowness of international REDD+ policy formulation and the unclear path of development of the forest carbon market. Based on the study results, priorities for MRV development and increased investment in readiness are proposed.
Export citation and abstract BibTeX RIS

Content from this work may be used under the terms of the Creative Commons Attribution 3.0 licence. Any further distribution of this work must maintain attribution to the author(s) and the title of the work, journal citation and DOI.
1. Introduction
Reducing emissions from deforestation and degradation and enhancing the carbon stock (REDD+) is a key strategy for mitigating climate change. The United Nations Framework Convention on Climate Change (UNFCCC) takes a lead role in formulating the strategy through consultation with a range of agencies including other international bodies, national and subnational governments, non-governmental organizations and the private sector. Formulated at the 13th Conference of the Parties (COPs), known as the Bali Action Plan, REDD+ comprises local, subnational, national and global actions whose primary aim is to reduce emissions from deforestation and forest degradation and enhance forest carbon stocks (increase removals) in developing countries (UNFCCC 2007, Angelsen et al 2012). UNFCCC (2011) has called for a three-phase approach to REDD+ implementation where 'Phase 1 is the REDD+ readiness to establish REDD+ strategies, policies and accounting frameworks; Phase 2 is implementation of REDD+ policies and measures, and possibly payments based on their implementation; and Phase 3 is the results-based payments for REDD+ (i.e. for emissions and removals)'.
REDD+ adopts several funding streams and models for its implementation that operate simultaneously at various levels (van der Eynden 2012, Lotsch 2012). The first model involves developed countries contributing to the Green Climate Fund or Forest Carbon Partnership Facility (FCPF), which are administered by the UNFCCC and the World Bank, respectively. These funds are allocated to national governments, which administer and distribute them to subnational governments and individual REDD+ projects. A second model involves international aid agencies supporting national governments and individual REDD+ projects through bilateral agreements. For example, Norway supports the Brazilian and Indonesian governments in the implementation of REDD+, and also independent REDD+ projects in Tanzania. A third model involves development of the voluntary carbon market (which could be later changed into a compliance market) for selling carbon credits generated by the REDD+ projects. This funding stream is exclusively for the REDD+ projects and therefore needs to follow strict guidelines issued by the certifiers such as the verified carbon standard (VCS) and Plan Vivo.
As of 2009, about 100 local REDD+ projects had been initiated in 40 developing countries (Cerbu et al 2011, Obersteiner et al 2009). A 2012 count of both REDD+ and non-REDD+ forest carbon projects found 340 sites in 52 countries (Kshatriya et al 2012). Unlike many other conservation initiatives, the key goal of REDD+ projects is to implement performance-based rewards for increase of forest carbon stocks (additionality) against a baseline, while also achieving social and environmental co-benefits. REDD+ aims to ensure that activities to generate additionality in one place should not cause emissions in neighbouring areas (leakage), and should also satisfy permanence criteria (i.e., no reversibility of sequestered carbon).
The economic and political dimensions of REDD+ and its performance-based criteria require highly precise measuring/monitoring, reporting and verification (MRV) of emissions and removals from forests (Herold and Skutsch 2011). Establishing an effective MRV system is a major step towards REDD+ readiness. UNFCCC has called for the development of 'modalities for measuring, reporting and verifying anthropogenic forest-related emissions by sources and removals by sinks, forest carbon stocks, and forest carbon stock and forest-area changes resulting from the implementation of the activities' (UNFCCC 2011). Key additional references refer to activity data and emission factors as the essential building blocks of an MRV system (IPCC 2003, 2006, Shoch et al 2011, GOFC-GOLD 2012). Activity data reflect the extent of the area in which carbon changes occur over time, while emission factors reflect the amount of carbon per unit area. The Intergovernmental Panel on Climate Change (IPCC) proposed a tiered approach for measurements: Tier 1, the simplest to use, is based on globally available activity data and default emissions values, Tier 2 is based on country- or region-specific data, and Tier 3 uses higher-order, spatially explicit data to obtain greater certainty (IPCC 2006).
Several studies have analysed MRV systems at the national scale using data from the Food and Agriculture Organization's Forest Resources Assessment, national communications to UNFCCC and other online compilations to review existing capacity and identify gap areas (Herold 2009, Romijn et al 2012, Hosonuma et al 2012). A number of concept papers on MRV requirements at different scales have primarily looked at data availability (Gibbs et al 2007, Joseph et al 2011, Goetz and Dubayah 2011, De Sy et al 2012) and the associated cost (Böttcher et al 2009). Fry (2011), Larrazábal et al (2012) and Pratihast et al (2013) highlighted the need to develop community MRV protocols to maximize community participation and reduce costs. None of the above publications focused on MRV systems per se or the operational design of MRV systems required for REDD+ projects. The only exception to this trend was baseline modelling and monitoring readiness with respect to internationally recognized carbon certification standards and methods (Estrada and Joseph 2012).
2. Data and methods
2.1. Data
Assessing MRV capacity and readiness at project sites requires a complete understanding of project developers' MRV systems, the drivers of deforestation at the sites, and the planned mitigation activity. After careful examination of the national context and subnational initiatives (for the full selection criteria, see Sunderlin et al 2010, pp 17–20), 20 REDD+ project developers were selected for this assessment: seven in Latin America (five in Brazil and two in Peru), seven in Africa (five in Tanzania and two in Cameroon) and six in Southeast Asia (five in Indonesia and one in Vietnam). Table 1 summarizes key project characteristics, and figure 1 shows their geographical distribution. The project developers have varied characteristics ranging from local and national NGOs (e.g.: MCDI—Tanzania, CED—Cameroon, IPAM—Brazil), international conservation organizations (FFI and TNC), government organizations (States of Acre—Brazil and Aceh—Indonesia), and private organizations (Mazars Starling Resources—Indonesia and Bosques Amazonicos—Peru). One key criterion for the selection of these projects in our sample was that they have sufficient funding to operate for several years. This was important because we are conducting a longitudinal survey, and we need to be assured we can collect a second round of data.
Table 1. Details of participating REDD+ project sites and project developers.
| Country | State/province | Project name | Principal project developer | Major deforestation and degradation drivers | Mitigation activity planneda | ||||
|---|---|---|---|---|---|---|---|---|---|
| 1 | 2 | 3 | 4 | 5 | |||||
| Brazil | Mato Grosso | Northwest Mato Grosso Pilot REDD+ Project | Instituto Centro de Vida (ICV) | Cattle ranching and beef production, subsistence farming, illegal logging | Y | Y | Y | Y | N |
| Pará | Avoided deforestation in small rural properties in the region of the Transamazon Highway | Amazon Environmental Research Institute (IPAM) | Cattle ranching and beef production, subsistence farming, illegal logging | Y | Y | Y | Y | Y | |
| Pará | REDD+ Pilot Program in São Felix do Xingu | The Nature Conservancy (TNC) Brazil | Cattle ranching and beef production, subsistence farming, illegal logging | Y | Y | Y | Y | N | |
| Amazonas | Blosa Floresta Program | Fundação Amazonas Sustentável (FAS) | Illegal logging, mining, infrastructure development, subsistence farming | Y | Y | Y | Y | N | |
| Amapa | Biofílica Investimentos Ambientais and Fundação Orsa, Amapa | Biofilica | Subsistence farming, illegal logging, infrastructure development | Y | Y | Y | Y | N | |
| Peru | Madre de Dios | Brazil Nut Concessions REDD+ Project | Bosques Amazonicos (BAM) | Cattle ranching and beef production, subsistence farming, mining, illegal logging | Y | Y | Y | Y | N |
| San Martin | Alto Mayo REDD+ Initiative | Conservation International | Commercial plantations (coffee), cattle ranching and beef production, subsistence farming | Y | N | N | N | N | |
| Cameroon | South and east region | Payment for Ecosystem Services (PES) project | Centre pour l'Environnement et le Développement (CED) | Subsistence farming, logging, extraction of non-timber forest products | Y | Y | Y | Y | Y |
| South west region | Mt. Cameroon REDD Project | GFA-Envest | Commercial plantations (oil palm, rubber and tea), subsistence farming, illegal logging | Y | Y | Y | Y | N | |
| Tanzania | Shinyanga | Community Based REDD Mechanisms for Sustainable Forest Management in Semi-Arid Areas | Tanzania Traditional Energy Development and Environmental Organization (TaTEDO ) | Subsistence farming, fuel wood and charcoal production, overgrazing | Y | Y | Y | Y | N |
| Morogoro | Making REDD work for Communities and Forest Conservation in Tanzania–Kilosa | Tanzania Forest Conservation Group (TFCG) | Subsistence farming, fuel wood and charcoal production, fire | Y | Y | Y | Y | N | |
| Lindi | Making REDD work for Communities and Forest Conservation in Tanzania–Lindi | Tanzania Forest Conservation Group (TFCG) | Subsistence farming, fuel wood and charcoal production, fire | Y | Y | Y | Y | N | |
| Unguja/Zanzibar | HIMA—Piloting REDD in Zanzibar through Community Forest Management | CARE International in Tanzania | Fuel wood and charcoal production, subsistence farming, infrastructure development | Y | Y | N | N | N | |
| Lindi | Mpingo Conservation Project | Mpingo Conservation and Development Initiative (MCDI) | Fire, subsistence farming, fuel wood and charcoal production | Y | Y | N | N | N | |
| Indonesia | Aceh | Reducing Carbon Emissions from Deforestation in the Ulu Masen Ecosystem | Government of Aceh (Task Force REDD Aceh) | Subsistence farming, logging | Y | Y | Y | Y | N |
| West Kalimantan | REDD Pilot Project Development, Community Carbon Pools | Fauna and Flora International Indonesia (FFI-Indonesia) | Commercial plantations (oil palm), subsistence farming, illegal logging, mining | Y | Y | Y | Y | Y | |
| Central Kalimantan | The Rimba Raya Biodiversity Reserve Project | Infinite Earth PT. Rimba Raya Conservation | Commercial plantations (oil palm), subsistence farming, illegal logging, peat fires | Y | N | N | N | N | |
| Central Kalimantan | Katingan Conservation Area: A Global Peatland Capstone Project | Starling Resources/PT. Rimba Makmur Utama (RMU) | Illegal logging, commercial plantations (oil palm and rubber) | Y | N | N | N | N | |
| East Kalimantan | Berau Forest Carbon Program | The Nature Conservancy (TNC) | Commercial plantations (oil palm), logging, subsistence farming, mining | Y | N | N | N | N | |
| Vietnam | Lam Dong | SNV Site, Cat Tien | The Netherlands Development Organization (SNV) | Subsistence farming, logging, infrastructure development | Y | Y | Y | Y | N |
aMitigation activities: 1 =reducing emissions from deforestation, 2 =reducing emissions from forest degradation, 3 =conservation of forest carbon stocks, 4 =sustainable management of forests, 5 = enhancement of forest carbon stocks.

Figure 1. Location of participating project sites.
Download figure:
Standard image High-resolution imageThe assessment was carried out from October 2011 to September 2012. The first step was to carry out an MRV questionnaire survey to assess the status and progress of MRV systems of the principal project developers. The survey was divided into three sections, namely: remote sensing and GIS; ground measurements; and reference level and monitoring plans. The survey was done by communicating directly with the key MRV expert in the respective project development organizations. Furthermore, a field-based survey was conducted at each project site that collected information on the overall condition of the project area, the drivers of deforestation and degradation, and the context of REDD+ at the project site. Subsequently, three regional workshops were carried out to discuss the operationalization of MRV at the project sites (a workshop was held in Dar es Salaam, Tanzania, for the Tanzania and Cameroon project developers; in Petropolis, Brazil, for the Brazil and Peru project developers; and in Jakarta, Indonesia, for the Indonesia and Vietnam project developers). About 20–25 people attended each workshop, including one to two participants from each project development organization, and also international MRV experts.
2.2. Methods
Three broad categories were developed to assess the capacity and readiness of the project developers. Each category was divided into three subcategories, and criteria were formulated to measure each after careful examination of the international standards of carbon certification (such as VCS and Plan Vivo), IPCC and UNFCCC guidelines, and other reference guides such as GOFC-GOLD REDD Sourcebook (GOFC-GOLD 2012).
- (1)Remote sensing and GIS capacity and readiness—this includes data coverage at the project sites and the capacity of the developer to produce derivatives from the raw image data. It is important because the spatial data infrastructure and availability of remote sensing data are fundamental to producing estimates of the baseline, and to developing meaningful monitoring plans for long-term performance assessment of REDD+ projects. This category was subdivided into three subcategories: data, tools and methods, and implementation capacity. Data criteria were availability of medium- and high-resolution datasets; access to other higher-end monitoring tools such as LiDAR, aerial, SAR and hyperspectral datasets; and availability of ancillary spatial data layers at different jurisdictional scales. Tools and methods criteria were availability of data processing software, and the algorithms used for image classification and change detection. Implementation capacity indicates the project developers' in-house expertise to analyse data.
- (2)Carbon pool inventorying capacity and readiness—this analyses developers' plans to measure various carbon pools with respect to IPCC tiers (IPCC 2006), and the availability of existing emission factor data at the project sites. The same three subcategories were used. Data criteria were the availability of allometric equations, carbon fraction coefficients and other emission factor datasets. Tools and methods criteria were the sampling scheme and the methods used for the measurement of various carbon pools with respect to IPCC's AFOLU (agriculture, forestry and other land use) guidelines. Implementation capacity was defined as the professional expertise available within the organization to carry out field inventorying.
- (3)Baseline, intervention and monitoring readiness—this category assesses developers' ability to understand the drivers of deforestation and incorporate them in baseline modelling, develop effective intervention plans, and develop monitoring strategies. The criteria were methods used for baseline modelling, understanding of the proximate and underlying drivers of deforestation, intervention plans, and long-term monitoring strategies to evaluate the success of REDD+ interventions.
Figure 2 summarizes the three main categories and their subdivisions.

Figure 2. Categories used to assess monitoring, reporting and verification readiness.
Download figure:
Standard image High-resolution imagePerformance indicators were assigned to each criterion, and an indicator value and score were given to each indicator. For example, the first criterion, availability of medium-resolution remote sensing data, was divided into four performance indicators. If 100% spatial data coverage was available for more than three points in time (which is important for reliable estimation of the deforestation rate and linear projection of the baseline), that indicator received the highest score, 3. A score of 2 was awarded for 100% data coverage in two to three time points, and 1 for those with one time point.
Similar guidelines were formulated for each indicator, and scores were assigned (see table 2). A total of 19 criteria with 76 performance indicators under nine subcategories were assessed. Each subcategory received a score of 0–3, for 9 possible points in each major category and 27 possible points overall. Capacity was assessed as very high for a score greater than 20, high for a score of 16–20, medium for 11–15, and low for 10 or less. This arbitrary scale was defined after analysing the relative distribution of scores and the performance of developer organizations with respect to individual criteria.
Table 2. Detailed breakdown of assessment categories, criteria and indicators.
| Category | Subcategory | Criterion | Performance indicator | Indicator value | Score |
|---|---|---|---|---|---|
| Remote sensing and GIS capacity and readiness | Data | Availability of medium-resolution remote sensing data with 100% spatial coverage of project site at a specific number of time points | >3 time points | Very high | 3 |
| 2–3 time points | High | 2 | |||
| 1 time point | Medium | 1 | |||
| 0 time points | Low | 0 | |||
| Availability of high-resolution remote sensing data (<10 m) in at least one time point with percentage cover | >50% | Very high | 3 | ||
| 20–50% | High | 2 | |||
| <20% | Medium | 1 | |||
| None | Low | 0 | |||
| Access to other higher-end monitoring tools such as LiDAR, aerial, hyperspectral and SAR | 3 or more tools | Very high | 3 | ||
| 2 tools | High | 2 | |||
| 1 tool | Medium | 1 | |||
| None | Low | 0 | |||
| Availability of GIS data at national, provincial and project scales | All 3 scales | Very high | 3 | ||
| 2 scales | High | 2 | |||
| 1 scale | Medium | 1 | |||
| None | Low | 0 | |||
| Tools and methods | Availability of remote sensing and GIS processing software (ERDAS, ENVI, ArcGIS, IDRISI and open source) | 3 or more programs | Very high | 3 | |
| 2 programs | High | 2 | |||
| 1 program | Medium | 1 | |||
| None | Low | 0 | |||
| Use of higher-end techniques for classification and change analysis | Multivariate iterative algorithms, decision tree and other higher-end techniques. | Very high | 3 | ||
| Supervised/unsupervised techniques and post-classification change detection | High | 2 | |||
| Visual | Medium | 1 | |||
| None/yet to start | Low | 0 | |||
| Implementation capacity | Internal capacity for remote sensing and GIS work | In-house expertise within the main project implementation office | Very high | 3 | |
| In-house expertise at headquarters with assistance from the field office | High | 2 | |||
| Partial outsourcing | Medium | 1 | |||
| Complete outsourcing | Low | 0 | |||
| Ground carbon pool inventorying capacity and readiness | Data | Availability of allometric equations | Site specific for most of the land cover types in the project area | Very high | 3 |
| Site specific for certain land cover types, global default equations for the rest | High | 2 | |||
| Only global default equations from literature | Medium | 1 | |||
| None | Low | 0 | |||
| Availability of carbon fraction coefficients | Site specific for most of the land cover types in the project area | Very high | 3 | ||
| Site specific for certain land cover types, global default equations for the rest | High | 2 | |||
| Only global default equations from literature | Medium | 1 | |||
| None | Low | 0 | |||
| Availability of other emission factor databases such as root–shoot ratio, biomass expansion factor and wood density | Site specific for most of the land cover types in the project area | Very high | 3 | ||
| Site specific for certain land cover types, global default values for the rest | High | 2 | |||
| Only global default values from literature | Medium | 1 | |||
| None | Low | 0 | |||
| Tools and methods | Monitoring of all five carbon pools (above-ground, below-ground, deadwood, litter and soil organic carbon) | All carbon pools | Very high | 3 | |
| At least 3 carbon pools | High | 2 | |||
| At least above-ground biomass | Medium | 1 | |||
| No plans/yet to start | Low | 0 | |||
| Sampling scheme and methods | Well defined with configurations of permanent and temporary sampling units | Very high | 3 | ||
| Well defined with only permanent sampling unit | High | 2 | |||
| Loosely defined temporary sampling unit | Medium | 1 | |||
| No sampling scheme/yet to start | Low | 0 | |||
| Implementation capacity | Internal capacity for field inventorying | In-house expertise within the main project implementation office | Very high | 3 | |
| In-house expertise at headquarters with assistance from the field office | High | 2 | |||
| Partial outsourcing | Medium | 1 | |||
| Complete outsourcing | Low | 0 | |||
| Baseline, intervention and monitoring readiness | Baseline modelling | Methods used for baseline estimate | GIS-based modelling with covariates of deforestation agents | Very high | 3 |
| Simple historic average and/or linear projection | High | 2 | |||
| Assumption based on expert knowledge | Medium | 1 | |||
| No specific plans/yet to start | Low | 0 | |||
| Deforestation drivers and intervention plans | Understanding of the proximate drivers of deforestation | Very high degree of understanding established over several years | Very high | 3 | |
| Good degree of understanding | High | 2 | |||
| Limited experience with the site | Medium | 1 | |||
| No experience with the site | Low | 0 | |||
| REDD+ intervention plans for proximate drivers | Well-defined one-to-one intervention plans | Very high | 3 | ||
| Reasonably defined intervention plans | High | 2 | |||
| Loosely defined intervention plans | Medium | 1 | |||
| No definite plans | Low | 0 | |||
| Understanding of the underlying drivers of deforestation | Very high degree of understanding established over several years | Very high | 3 | ||
| Good degree of understanding | High | 2 | |||
| Limited experience with the site | Medium | 1 | |||
| No experience with the site | Low | 0 | |||
| REDD+ intervention plans for underlying drivers | Well-defined one-to-one intervention plans | Very high | 3 | ||
| Reasonably defined intervention plans | High | 2 | |||
| Loosely defined intervention plans | Medium | 1 | |||
| No definite plans | Low | 0 | |||
| Monitoring plans | Long-term monitoring plans to evaluate the REDD+ interventions | Well-defined monitoring plans | Very high | 3 | |
| Reasonably defined monitoring plans | High | 2 | |||
| Loosely defined monitoring plans | Medium | 1 | |||
| No definite plans | Low | 0 | |||
Further analyses were carried out to check whether the slowness in readiness could be attributed to limitations in the personnel expertise and technical capacity available with the project developer organizations. Firstly, the scores of in-house capacity (a measure of expertise) for remote sensing and GIS work was compared with the scores of in-house capacity for the field inventorying (i.e., remote sensing and GIS in-house expertise versus carbon pool inventorying in-house expertise) across projects. Second comparison was carried out with the aggregated scores for remote sensing and GIS with respect to aggregated scores for baseline, intervention and monitoring. The former comparison intend for attributing expertise while the latter for technical capacity.
3. Results
3.1. Deforestation drivers and mitigation activities
Deforestation and degradation drivers at the REDD+ demonstration sites involved a complex interplay of commercial and subsistence activities (table 1). The primary threats in Brazil and Peru were commercial activities such as cattle ranching and beef production and mechanized illegal logging; in Tanzania and Cameroon, they were subsistence activities such as farming and charcoal production (which is partially commercial); and in Indonesia and Vietnam, they were a mix of commercial and subsistence activities such as oil palm plantations and subsistence farming. Reducing emission from deforestation was the primary mitigation activity planned by the project developers in all three regions. Forest degradation was reported as a major problem at sixteen project sites. Conservation of carbon stock and sustainable management of forests have been taken up by 14 project developers. Enhancement of carbon stock was not a major objective for most of the project developers, and only 3 out of 20 were engaged in this activity.
3.2. Remote sensing and GIS capacity and readiness
Eleven of 20 project developers (55%) showed high or very high remote sensing and GIS capacity and readiness (figure 3(a)), seven (35%) were ranked medium, and two (10%) were ranked low. Most project developers were equipped with medium-resolution satellite data, primarily Landsat series data available free of cost. The other major sensors included SPOT series, IRS-LISS series, and CBERS. About half of the developers had high-resolution (>10 m) satellite data, in most cases with spatial coverage of more than 50% of the study area. Eleven used at least one type of higher-end remote sensing technology (such as LiDAR, aerial photos and SAR). SAR data were primarily PALSAR, which were freely available. All these organizations have many years of experience at their respective sites, and therefore the availability of ancillary GIS layers at the project, provincial and national scales was not a problem.

Figure 3. The MRV capacity and readiness of project developers at a sample of REDD+ projects in Brazil, Peru, Cameroon, Tanzania, Indonesia and Vietnam. (a) Remote sensing and GIS; (b) ground carbon pool inventorying; (c) baseline, intervention and monitoring; and (d) overall MRV readiness. The total number of projects in the sample is 20, and the values in the diagram represent number of project developers with percentage in parentheses.
Download figure:
Standard image High-resolution imageFive organizations were well equipped with processing software. Nine had some limitations with respect to commercial software, but relied on open-source software such as R and QGIS for spatial analysis. Fourteen organizations used decision tree or multivariate iterative algorithms for image classification and change analysis. Eleven organizations showed very good in-house expertise with the main project implementation office, five partially outsourced their work, and the rest carried out the work at headquarters with inputs from the regional project office.
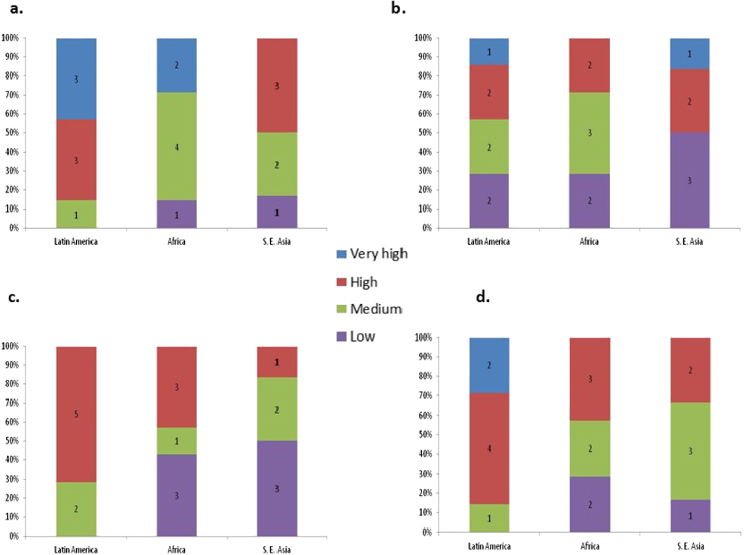
Remote sensing and GIS capacity and readiness varied by region (figure 4(a)). Six out of seven projects in Brazil and Peru showed high or very high capacity and readiness, and one was in the medium category. The projects in Tanzania and Cameroon showed more variability: two of seven (29%) were rated very high, and the remaining five (71%) were rated medium to low. None of the projects in Indonesia and Vietnam showed very high capacity and readiness in this category; three were rated high, two medium, and one low. With respect to high-resolution satellite data and other higher-end monitoring tools such as LiDAR, aerial photos and SAR, all three regions experienced limitations; these limitations were severe in Tanzania and Cameroon. African project capacity was further weakened by insufficient expertise and lack of software and processing infrastructure. In contrast, Indonesia experienced rapid progress in the acquisition of LiDAR in recent years together with improvement in data processing algorithms and facilities.
Figure 4. Region-wise capacity and readiness of project developers at a sample of REDD+ projects in Brazil, Peru, Cameroon, Tanzania, Indonesia and Vietnam. (a) Remote sensing and GIS; (b) ground carbon pool inventorying; (c) baseline, intervention and monitoring; and (d) overall MRV readiness. (The values within the column represent number of projects.)
Download figure:
Standard image High-resolution image
3.3. Carbon pools inventorying capacity and readiness
Eight (40%) project developers showed high or very high capacity and readiness, while seven (35%) showed low (figure 3(b)) in this area. Eleven of the sites had site-specific allometric equations, while only five had specific carbon fraction coefficients. The rest of the sites followed global default values available from the IPCC's AFOLU guidelines. The other emission factor databases such as wood density, biomass expansion factor and root–shoot ratio were also limitedly available for most of the sites. Only two project developers had plans for monitoring all five carbon pools; eight focused on three carbon pools; five measured only above-ground biomass, and the rest had not started carbon pool measurements. The AFOLU recommendation to use a mix of permanent and temporary sampling units for monitoring additionality was not followed by any project developers. Eleven focused only on permanent sampling units, while six had a vague sampling plan that was just enough to develop a rough estimate of biomass. However, in terms of in-house expertise, 90% of the project developers showed high or very high capacity to take up the inventorying program with the main project implementation office.
Region-wise, three projects in Indonesia and Vietnam showed high or very high capacity and readiness, and the remaining three showed low capacity (figure 4(b)). The projects in Brazil and Peru were more or less evenly distributed among classification categories, while the projects in Tanzania and Cameroon were predominantly in the medium category. Distribution of allometric equations was similar in all regions: at least 50% of the project areas had site-specific allometric equations. However, the availability of other emission factor coefficients such as carbon fraction and wood density was higher in Latin America, followed by Southeast Asia and Africa. The number of carbon pools monitored by Tanzania project developers was higher than in the other two regions. This is probably due to the fact that many project sites are less carbon rich, as they are located in dry forest areas, and thus more pools must be counted to make the project economically viable. Projects in Indonesia for which the assessment is already in the advanced stages included soil organic carbon, since peat land carbon is a major contributor to the total carbon dynamics of the area. In contrast, project developers in Brazil and Peru mostly focused on above-ground biomass alone, as this itself contributes a large share of the carbon pool and can generate adequate credits.
3.4. Baseline, intervention and monitoring readiness
None of the projects showed very high readiness for baseline modelling, intervention plans and monitoring. Nine projects (45%) showed high, five (25%) medium, and six (30%) low readiness (figure 3(c)). Seven project developers used historical averages and linear projection to develop baseline estimates, while six used GIS-based modelling incorporating deforestation agents. One relied on expert knowledge for estimating a baseline.
All project developers had very good understanding of the proximate drivers of deforestation at the site, since they had worked in the same area for multiple years. However, their intervention strategies varied. Only three organizations had a well-defined strategy to slow and halt deforestation agents. About half of the organizations defined their strategy reasonably well, while two organizations defined their strategy loosely, and five did not have specific strategies or activities at the time of the survey. Project developers seemed to have a reasonable understanding of underlying drivers of deforestation, but they expressed limitations in their ability to address these drivers, since many originate outside the project boundary. In such cases, project developers outlined their plans to work with local or regional government bodies to develop intervention plans.
With respect to monitoring, only 20% of the project developers had reasonable monitoring plans, while the rest had loosely defined monitoring plans or no plan at all. This was probably due to the fact that the projects are still in the planning or verification stage and are not yet at the stage of establishing a fully functioning MRV system.
Although no project in any region was classified as having very high readiness, the projects in Brazil and Peru tended to have better in this category than the other four countries (figure 4(c)). The lowest readiness was observed among Southeast Asian projects, while most African projects ranked either high or low with a negligible percentage in the medium category. A higher-end future deforestation modelling capacity (five out of seven) was clearly visible among Latin American projects for developing baseline modelling; whereas the modelling capacity was largely limited in the other regions (none in Africa, and one out of six in Southeast Asia). Progress with intervention plans was greater in Brazil and Peru, followed by Tanzania and Cameroon and then Indonesia and Vietnam. This implies that Africa project developers have good understanding of the ground conditions and can make well-defined intervention plans although they have limited technical capacity. With respect to monitoring plans, projects in Brazil and Peru did not show a clear difference although these countries were in the forefront for many of the other activities.
3.5. Overall MRV capacity and readiness
In an aggregation of the three main categories, only two projects (10%) had very high capacity and readiness (figure 3(d)). Nine (45%) had high, six (30%) medium, and three (15%) low capacity. Considered by region, six out of seven Latin American projects showed high or very high capacity; no project in Africa or Southeast Asia had very high capacity (figure 4(d)). Two out of seven African projects had low capacity; three out of six Southeast Asian projects had medium capacity. In general, the projects in Brazil and Peru showed the highest capacity and readiness. Those in Cameroon, Tanzania, Indonesia, and Vietnam showed capacity that is on average lower than the two Latin American countries.
The comparative analysis of in-house capacities for remote sensing, GIS and field inventorying, and technical capacities for baseline, intervention and monitoring across projects indicate that expertise and technical limitations were not the primary reasons for the slow progress towards readiness. In-house capacities to carry out both remote sensing and GIS works, and carbon pools inventorying ranked high or very high in 14 of the 20 projects (70%) (table 3). Four projects (20%) (two each in Africa and Southeast Asia) had very high field inventorying expertise but partially outsourced their remote sensing and GIS work. One project had high remote sensing and GIS capacity but low carbon pool inventorying capacity, and one was ranked medium for both categories. With respect to technical capacities for baseline, intervention and monitoring readiness, five projects showed very high remote sensing and GIS capacity while none showed very high baseline, intervention and monitoring readiness, suggesting that slow progress in the latter category was not solely due to limitations in the former category (table 4).
Table 3. Comparison of in-house project personnel expertise to carry out remote sensing, GIS and carbon pool inventorying works at a sample of REDD+ projects in Brazil, Peru, Cameroon, Tanzania, Indonesia and Vietnam. The upper left columns indicate high degree of expertise (70%) within the organizations.
| Carbon pool inventorying in-house expertise | ||||||
|---|---|---|---|---|---|---|
| Very high | High | Medium | Low | Sum | ||
| Remote sensing and GIS in-house expertise | Very high | 6 | 5 | 0 | 0 | 11 |
| High | 2 | 1 | 0 | 1 | 4 | |
| Medium | 4 | 0 | 1 | 0 | 5 | |
| Low | 0 | 0 | 0 | 0 | 0 | |
| Sum | 12 | 6 | 1 | 1 | 20 | |
Table 4. Comparison of remote sensing and GIS capacity with baseline, intervention and monitoring readiness at a sample of REDD+ projects in Brazil, Peru, Cameroon, Tanzania, Indonesia and Vietnam.
| Baseline, intervention and monitoring readiness | ||||||
|---|---|---|---|---|---|---|
| Very high | High | Medium | Low | Sum | ||
| Remote sensing and GIS capacity | Very high | 0 | 4 | 1 | 0 | 5 |
| High | 0 | 2 | 3 | 1 | 6 | |
| Medium | 0 | 2 | 2 | 3 | 7 | |
| Low | 0 | 0 | 0 | 2 | 2 | |
| Sum | 0 | 8 | 6 | 6 | 20 | |
4. Discussion and recommendations
Performance indicators need to be identified at each phase of REDD+ implementation to measure its success (Wertz-Kanounnikoff and McNeill 2012). The present study, which addresses the accounting framework of REDD+ projects in the readiness phase, developed 19 performance criteria and 76 indicators to measure MRV capacity and readiness. The study found that many projects are still working towards various categories of MRV capacity and need additional momentum to move forward to the next phases. The critical issues in the accounting framework could be sorted into the following categories.
Data availability and methodological guidelines—the REDD+ projects are located in the tropical belt where a number of prevalent atmospheric and ground conditions such as cloud cover, haze and uneven topography often disrupts a satellite sensor's capacity to image good quality ground data (Joseph et al 2013). The access to time series remote sensing data was serious problem in most of the projects in our study. This data limitation problem have been reported widely; including the world's first verified REDD project, Noel Kempff Mercado Climate Action Project in Bolivia, where lack of time series data at the right scale was a major constraint in generating the accurate and precise estimates of deforestation and spatial modelling of baseline (Brown 2005). Although operational monitoring of deforestation is reasonably possible with the coarse resolution remote sensing data as evident from INPE's PRODES program (INPE 2011), establishing such a scheme using medium-resolution data still underway. Recent initiatives such as mapping of annual deforestation rate using Landsat data in the Congo basin (Potapov et al 2012) and Sumatra Island (Margono et al 2012) are notable in this context. More importantly, such system should make use of the pixel-based time series data compositing to remove the noises from cloud, haze and other atmospheric impurities. This involves the implementation of number of higher-end computation algorithms; for example: LEDAPS (Landsat Ecosystem Disturbance Adaptive Processing System) for atmospheric correction (Masek et al 2006), Fmask (Function of mask) for cloud and cloud shadow masking (Zhu and Woodcock 2012), and change break detection using BFAST (breaks for additive seasonal and trend) (Verbesselt et al 2010a, 2010b). The spatial infrastructure and technical expertise are critical components in the implementation of such algorithms (Joseph et al 2013).
Similarly ambiguity exists in methodological guidelines on how to set reference emission level in REDD+ projects (Angelsen and Verchot 2009, Dutschke 2013). The common and easiest method is simple linear regression based on historical deforestation rate. Verified Carbon Standard also recommend the use logistical regression to overcome the problems of linear regression (Shoch et al 2011). Other than these two, complex GIS-based predictive land cover models are also suggested for estimating the REL. Cortez et al (2010) proposed a double set of RELs at the project level; an absolute REL and a proportional REL to the respective reference region; both could be independently validated. This is important for upscaling the REL to the subnational and national scales through a nested approach (Pedroni et al 2009), ensuring no displacement in the emission, and also to avoid the potential double counting issues. The overall challenge is to make sure that the sum of all projects and subnational emission reductions does not exceed the total claimed at national scale (Dutschke 2013).
Monitoring cost and choices—the earlier studies that focused at the national scale observed critical gaps forest monitoring capacities (Romijn et al 2012), largely attributed to the lack of technical capacity and expertise. The results of this study, which was focused at the project rather than national scale, indicate that technical and expertise limitations are not the sole reasons for the slow progress towards readiness. Of the 20 projects, 18 had high or very high in-house expertise for carbon pool inventorying, but only 15 reached these levels for remote sensing and GIS (table 3). The difference is interesting, although not large, because at the country scale these values are commonly reversed (Herold 2009, Romijn et al 2012). This implies that projects are better at producing local measurements of carbon stocks but rely more on external technological expertise for remote sensing and GIS.
A national nesting protocol may be needed to address the monitoring choices (Cortez et al 2010). Monitoring choices should be decided based on a cost-benefit analysis which is dependent on the size of the project and the emission reductions and removals expected. Böttcher et al (2009) compile the monitoring cost of different techniques which ranges from $0.5 to $550 km−2 depending on the required precision of carbon stock and area change detection. The cost of medium-resolution satellite data ranges from $0.001 to $0.5 km−2 (except for Landsat and CBERS) while high-resolution data are in the range of $2–30 km−2 (GOFC-GOLD 2012). Böttcher et al (2009) also argue that single country or project solutions will face relatively higher monitoring costs and recommend an international cooperation to overcome initialization costs and unequal access to monitoring technologies. Hardcastle and Baird (2008) studied the monitoring cost in 25 tropical countries and recommended the establishment of shared regional capacity, as most non-data costs are largely independent of the geographical extent of the monitored area. Other advantages of such shared system would include standardization of methodologies for carbon accounting and reporting, facilitating a regional rather than national integration with carbon markets, and perhaps reducing transaction costs (Hardcastle and Baird 2008).
International policy dialogues—perhaps the single most prominent factor determining the progress of the projects is the pace of the international REDD+ negotiation progressing at the UNFCCC. Although REDD+ started with ambitious plans and a fast pace in 2007, the momentum has slowed noticeably after the Copenhagen Summit. The economic downturn in 2008 led many countries to withdraw from their original ambitious funding plans (Angelsen and McNeill 2012). The announcement of a Green Climate Fund in Durban stimulated enthusiasm, but the time frame put forth for operationalizing market mechanisms (by 2020) was not promising. This created a vacuum and an unclear path of development in the forest carbon market. The projected growth of the forest carbon market has shown a considerable decrease in the last three years (Peters-Stanley and Hamilton 2012). In addition, market fluctuations and the price collapse of clean development mechanism (CDM) credits—another UNFCCC initiative for emission reduction—made investors doubtful about the voluntary carbon market. Perhaps, these uncertainties together with the deficiency in the human and technical expertise might have resulted a general slowness in the prospects of MRV development in the REDD+ projects. Although this was the case in private and multilateral funding, bilateral investment has increased in recent years, especially from the development assistance fund (Wertz-Kanounnikoff and McNeill 2012, Streck 2012).
Recommendations
Further research and investment are needed to enable REDD+ to move forward to the operational ('results-based action') phase. Although the sample is too small to allow definitive conclusions, some tentative recommendations can be made.
- Improve remote sensing data access. Landsat series data are the primary source of information for the project developers. However, the availability of time series data was a limitation for many of the project sites (especially African sites). This limitation is more severe for high-resolution satellite data and other high-end monitoring tools like LiDAR and aerial photos. Possible ways to address this would be the establishment of an Earth Observation Data Directory for REDD+ projects by international donors, and other key stakeholder organizations.
- Develop emission factor data. Although allometric equations are well developed in the Amazon, there is little understanding of the carbon content of living biomass in these areas. Data on wood density, the biomass expansion factor and the root–shoot ratio were also limited at the Amazon project sites. Indonesia is a unique case in which peatland carbon plays an important role in the total carbon dynamics (Hergoualc'h and Verchot 2011). Data deficiency, unless addressed with a substantial investment, will make it difficult for Indonesia to progress to the operational phase of REDD+ (Verchot et al 2012). This data deficiency problem is particularly severe in the initial stages of REDD+ implementation. Once allometric equations are developed for each bioclimatic region and have precise biomass values for each stratum, this problem would be less important for future REDD+ projects.
- Account all relevant carbon pools. The dry forest project sites in Tanzania are less carbon rich compared to tropical wet forest sites and need to combine all significant carbon pools to make the project attractive for investors. Methodologically, projects focusing on avoided deforestation might not attract large investment because rates of deforestation is low in these landscapes. In such situations, mitigation activity focused reducing emissions and increasing removals might be more suitable (Skutsch et al 2009, Skutsch and Ba 2010). The forest enhancement activities could also generate additional job opportunities and income for local communities and ensure more active participation in the participatory MRV process. It is also important to combine bilateral, multilateral and other international funds in addition to the carbon market to make projects economically viable.
- Advance method development. Although degradation was reported as an issue at 16 of the sites, its monitoring received less attention, largely attributed to methodological and technical limitations. The spatial and temporal scale of various data products and their integration was another challenging task in larger projects.
- Collaborate to build capacity. The software and data processing capacity of project developers varies considerably. The level of technical expertise is a source of concern in many projects. Capacity development through collaboration should be encouraged within regions and complemented by south–south cooperation technical exchange. Also, it is important to organize more capacity building training for development of expertise in data processing.
- Coordinate efforts to slow, halt and reverse deforestation at the jurisdictional scale. Focusing on REDD+ crediting within project boundaries alone may shift deforestation activities to neighbouring areas outside the project, making net change negligible. Project developers said some of the underlying drivers originate from outside their project boundaries and are therefore under the purview of local, provincial or national governments. Therefore, the next step in the investment process should focus on nesting REDD+ projects and other efforts to slow and halt deforestation within broader efforts to stop deforestation and degradation at higher jurisdictional scales.
- Ensure continued funding. Many project developers expressed concern about continued availability of funding after the present project period. Assured project funding, or the establishment of a fund to support the efforts of REDD+ projects might be necessary.
5. Conclusion
This study found that capacity and readiness tended to be highest in the projects in Brazil and Peru and somewhat lower in Cameroon, Tanzania, Indonesia and Vietnam. Capacity and readiness also varied with respect to different MRV categories. Remote sensing and GIS capacity was highest in Brazilian and Peruvian projects. With respect to carbon pool inventorying, the projects in Brazil and Peru focused mostly on above-ground biomass; Tanzania combined as many carbon pools as possible; and Indonesia focused primarily on above-ground, below-ground and peat carbon. On baseline modelling, intervention and monitoring, none of the projects showed very high capacity. Although the overall MRV capacity and readiness of half the projects is high, there are capacity deficiencies in other projects. This could be attributed not only to technical and expertise limitations but also to the general slowness of REDD+ progress in international negotiations and the unclear path of development of the forest carbon market. Substantial investment is required to make REDD+ operational at the project scale, and more challenges are likely for monitoring, reporting and verification at larger scales including jurisdictional counting.
Acknowledgments
This study is part of a larger initiative, the Global Comparative Study on REDD+, undertaken by the Center for International Forestry Research with funding support from NORAD (Grant Agreement no. QZA-10/0468) and AusAID (Grant Agreement no. 46167). The authors would like to thank the national coordinators of this study, Abdon Awono, Amy Duchelle, Daju Pradnja Resosudarmo, Demetrius Kweka, and Thu Ba Huynh, and other field researchers who helped with the survey and fieldwork. The study also drew on insights developed during three regional workshops, and the contribution of each participant is duly acknowledged. The authors also wish to thank Manuel Estrada, who played an indispensable role in organizing the workshops. Comments by two anonymous reviewers and the editorial board member have substantially enhanced the quality of the paper.