

Abstract
Current methods for assessing soil organic carbon (SOC) stocks are generally not well suited for understanding variations in SOC stocks in landscapes. This is due to the tedious and time-consuming nature of the sampling methods most commonly used to collect bulk density cores, which limits repeatability across large areas, particularly where information is needed on the spatial dynamics of SOC stocks at scales relevant to management and for spatially explicit targeting of climate change mitigation options. In the current study, approaches were explored for (i) field-based estimates of SOC stocks and (ii) mapping of SOC stocks at moderate to high resolution on the basis of data from four widely contrasting ecosystems in East Africa. Estimated SOC stocks for 0–30 cm depth varied both within and between sites, with site averages ranging from 2 to 8 kg m−2. The differences in SOC stocks were determined in part by rainfall, but more importantly by sand content. Results also indicate that managing soil erosion is a key strategy for reducing SOC loss and hence in mitigation of climate change in these landscapes. Further, maps were developed on the basis of satellite image reflectance data with multiple R-squared values of 0.65 for the independent validation data set, showing variations in SOC stocks across these landscapes. These maps allow for spatially explicit targeting of potential climate change mitigation efforts through soil carbon sequestration, which is one option for climate change mitigation and adaptation. Further, the maps can be used to monitor the impacts of such mitigation efforts over time.
Export citation and abstract BibTeX RIS

Content from this work may be used under the terms of the Creative Commons Attribution-NonCommercial-ShareAlike 3.0 licence. Any further distribution of this work must maintain attribution to the author(s) and the title of the work, journal citation and DOI.
1. Introduction
Soil organic carbon (SOC) is an important indicator of soil and land health as it integrates several inherent soil properties and responds strongly to aboveground landscape dynamics, including land-use change and land degradation processes. Due to its contribution to agricultural and land productivity, the maintenance or addition of SOC is critically important both in potential climate change mitigation and in adaptation strategies. Soil is also potentially a major carbon (C) sink due to its C storage potential, which is generally greater than that of vegetation (Post and Kwon 2000), and a relatively stable pool of various organic and inorganic C fractions (Trumbore 1997, Ingram and Fernandes 2001). Potential effects of climate change on agricultural productivity, coupled with recent expansions of agricultural areas in response to population growth and increasing demand for food, has led to increased interest in soil carbon sequestration (Vågen et al 2005) and global estimates of SOC stocks (Jobbágy and Jackson 2000, Lal 2004, Houghton 2007, Berthrong et al 2009, The World Bank 2012). The Kyoto Protocol also acknowledges the need to consider agricultural soils when assessing GHG emissions (sources and sinks). In response, the IPCC developed methodological tools for assessing the effects of land-use change on soil organic carbon stocks, at the country or regional level and for varying land-use categories (IPCC 2006). These coarse estimates are often calculated using generic values for SOC (on a mass per area basis) by ecosystem type (Amundson 2001).
However, landscapes are often heterogeneous and complex, with complexity generally becoming higher with increasing fragmentation (Porensky 2011). The areas included in this study represent smallholder farming and pastoralist systems in East Africa, which are highly fragmented encompassing diverse topography, multiple land cover typologies, as well as varied land-use histories. Therefore, to develop methodologies applicable for these landscapes, a more detailed understanding of this landscape complexity, including changes in SOC and soil health, is necessary. This calls for new approaches and models for a more detailed understanding of the heterogeneity of SOC storage and dynamics in landscapes (Cécillon and Brun 2010, Smith et al 2012), including more rigorous models for better assessing SOC variation and scale-dependencies both within and between land uses (i.e. local scale) and climatic zones (i.e. regional to global scales). Current models and estimates (Eswaran et al 1993, West and Post 2002, Batjes 2004), while potentially helpful in estimating coarse-scale SOC sequestration potential, are not able to predict the possible fate of carbon due to land-use change at scales relevant to management and hence generally have limited utility in assessing the impacts of changes in agricultural management such as the introduction of conservation agriculture where recommendations for management and monitoring of results need to be done at the farm (local) scale. These new approaches need to overcome current limitations of small sample sizes, inconsistent or uncertain field sampling methods for quantification of SOC stocks, which generally do not allow for meta-analysis across studies, and costly analytical methods such as dry combustion for measuring SOC in the laboratory.
Bulk density is a common measurement in soil science used for converting carbon concentrations (mass of carbon/ mass of soil) to an areal basis (mass of carbon/area) using weight/volume estimates. Yet, bulk density measurements, especially of subsoil, are cited as being labor intensive and tedious (Benites et al 2007), and often uncertain (Lee et al 2009), particularly in eroded soils. Traditional bulk density measurements (for example, using the clod method or undisturbed cores) are not easily replicated in the field, which makes it practically impossible to obtain the sample size required for landscape-scale carbon assessments. In addition, these traditional measurements are not able to assess variation in soil mass over time, especially in soils with shrink-swell properties or in soil that has undergone tillage, compaction or erosion (Gifford and Roderick 2003). Several alternative methods have been proposed including the fixed depth approach (Lee et al 2009), equivalent soil mass (Ellert and Bettany 1995, Ellert et al 2001, 2002, Lee et al 2009, Wuest 2009) and the coordinate system method (Gifford and Roderick 2003, McBratney and Minasny 2010). Yet, these approaches have yet to be evaluated beyond the soil profile (e.g. at landscape scale). To avoid taking bulk density measurements in the field, researchers have also developed pedotransfer functions using soil attributes to estimate bulk density (Manrique et al 1991, Bernoux et al 1998, Tomasella and Hodnett 1998, Heuscher et al 2005, Benites et al 2007, Tranter et al 2007).
One of the primary objectives of the current study was to explore an alternative approach to bulk density based on the use of cumulative soil mass for field-based estimates of SOC stocks in landscapes. The cumulative mass methodology integrates soil mass at a given depth using a constant sampling volume, which is simpler to sample in the field and more robust statistically to calculate soil mass per volume. This approach is simple and allows for direct calculations of SOC stocks, without the use of bulk density. The results presented here were based on data from 640 soil profiles in four 100 km2 sites (figure 1) within three countries, which were sampled using a stratified hierarchical random sampling design. The approach presented also allows for assessments of changes in soil mass with depth due to for example compaction and erosion, in addition to being useful for estimating soil carbon stocks across landscapes, between varying land uses and soil types, and over time. The study employed recent advances in infrared (IR) spectroscopy of soil (Terhoeven-Urselmans et al 2010) and the use of ensemble prediction methods (Opitz 1999).
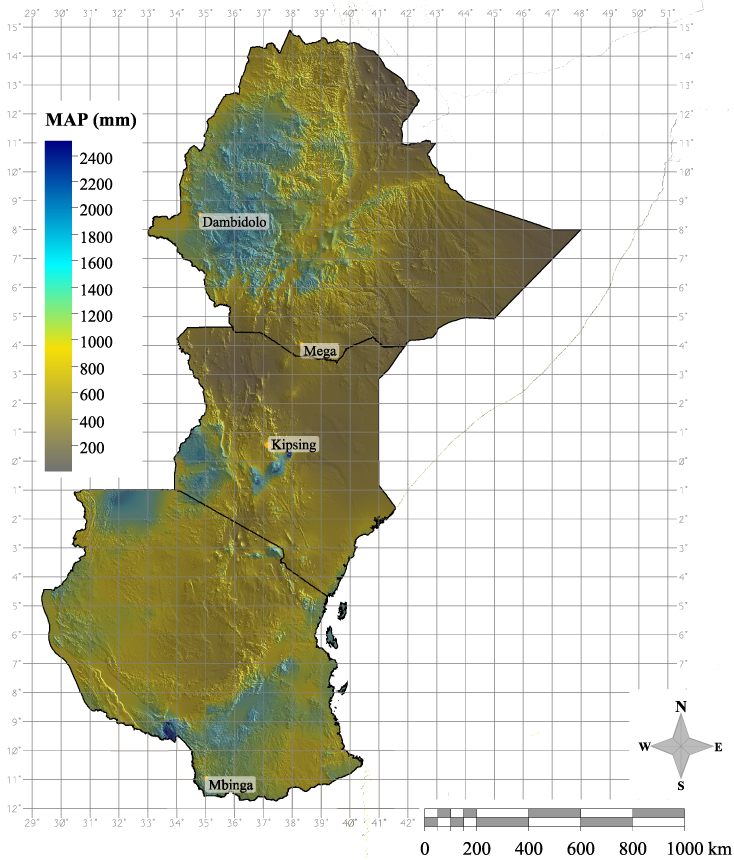
Figure 1. Map showing location of sites for which SOC stock maps were generated. Topographic shading was based on Shuttle Radar Topography Mission (SRTM), while the precipitation map was derived from WorldClim data (Hijmans et al 2005).
Download figure:
Standard imageAnother primary objective of the current study was to assess various approaches for moderate to high resolution mapping of SOC stocks in order to target specific areas where climate change mitigation strategies for increased soil C sequestration should be concentrated, as one climate change and mitigation option. Recent advances in the mapping of SOC in Kenyan rangelands (Vågen et al 2012) show that these approaches have significant potential for high resolution mapping of SOC concentrations. In the current study we explore these approaches further, but for predicting SOC stocks, using freely available satellite imagery and data from areas with a wide range of climate conditions and soils.
2. Materials and methods
2.1. Study area
Data from a total of four sites, each covering an area of 100 km2 (10 × 10 km) from three east African countries were included in the current study (figure 1). Dambidolo (35.0° East; 8.6° North) and Mbinga (35.2° East; 11.1° South) represented higher rainfall agricultural areas with a mean annual precipitation (MAP) (Hijmans et al 2005) of about 1300 mm, while Kipsing (37.1° East; 0.5° North) and Mega (38.3° East; 4.2° North) represented pastoral rangeland landscapes with drier climates (600–850 MAP). All sites were located in highland areas, with altitudes ranging from 1000 to 1500 m above mean sea level. These sites were selected to test the methods presented in the current study as they represent rangeland and smallholder agricultural systems with contrasting environments, climates and different soil types.
2.2. Field sampling
The field methods used in the current study are referred to collectively as the Land Degradation Surveillance Framework (LDSF) (Vågen et al 2012), which is a standardized set of procedures for the establishment of land health baselines and for monitoring of change. The aboveground components of the framework are based on the FAO Land Cover Classification System (LCCS) (Di Gregorio and Jansen 1998).
In short, within each 10 × 10 km site, 16 cluster centroids were stratified into 2.5 × 2.5 km tiles and their locations within the tiles were randomized, but buffered to avoid overlapping with neighboring tiles. Around each cluster centroid 10 sampling plots, each a 1000 m2 circle, were randomly located to fall within a circular area of 1 km2 using a 564 m radius from the cluster center-point. Each plot consisted of four 100 m2 subplots.
At the plot level, basic site characteristics were recorded, including name, ID, georeferencing (coordinates) of the center-point, altitude, date and a photograph was taken for later reference. The data collected included information on slope and landform, vegetation cover types and strata, land use, land ownership and primary current use. Other information collected included presence/absence of soil and water conservation structures, and descriptions if present. At the subplot level, signs of visible erosion were recorded, including erosion types and rock/stone/gravel cover on the soil surface was scored. High erosion prevalence was determined if three of the four subplots had observations of visible erosion. Woody- and herbaceous cover ratings were made using a Braun-Blanquet (Braun-Blanquet 1928) vegetation rating scale from 0 (bare) to 5 (>65% cover). Woody plants (shrubs (1.5–3 m height) and trees (>3 m height)) were counted, and distance-based measurements were made using the T-square method (Krebs 1989) to determine vegetation distribution.
Soil samples were collected at each subplot, then composited into one top- and one subsoil sample for each plot. Standard top- and subsoil samples were collected at 0–20 cm and 20–50 cm depth increments, respectively. In the absence of depth restrictions, 160 topsoil and 160 subsoil samples were hence collected from each site. Any auger depth restrictions were noted (in cm) if present during soil sampling.
2.2.1. Soil cumulative mass sampling.
In addition to the standard soil samples mentioned above, augering was done to 100 cm depth at the center-point of each sampling plot at increments of 0–20, 20–50, 50–80 and 80–100 cm, to estimate the mass of soil to a given depth and volume. A soil auger with a diameter of 7.6 cm, clearly marked at 10 cm increments was used, and the auger hole was back-filled with sand to assess the accuracy of the sampling volume (data not presented here). All of the soil from each auger hole and depth increment was collected and brought to the laboratory. A cumulative soil mass sampling plate was used to collect any soil that fell out of the auger during sample collection. In the laboratory the soil was air-dried and weighed. A subsample was then oven-dried, and gravimetric water content was calculated to establish the oven-dried weight of the total sample.
2.3. Soil analytical procedures
The soils sampled were analyzed at the World Agroforestry Centre's Spectral Diagnostics Laboratory in Nairobi, Kenya using dry combustion for SOC measurements on 10% of the samples and mid-infrared (MIR) scanning on all samples collected (Vågen et al 2010). Infrared spectroscopy (IR) is an established technology for rapid, non-destructive characterization of the composition of materials based on the interaction of electromagnetic energy with matter (Ben-Dor and Banin 1995, Shepherd and Walsh 2002, Viscarra Rossel et al 2006, Vågen et al 2006, Brown 2007). The MIR analysis was done according to methods and procedures described in Terhoeven-Urselmans et al (2010). Particle size analysis was done using a Horiba Model LA 950A2 particle size analyzer, which can analyze particles in the size range 0.04–3000 μm. Samples used in this study were subjected to dispersion with Calgon for 4 min before particle size analysis.
2.4. Modeling framework
All analysis and modeling was conducted in R-statistics version 2.15.1 (R Development Core Team 2011).
Models for estimating the stocks of SOC to 30 cm were developed by first calculating the mass of soil carbon (mSOC) at each depth increment in the soil profile and taking the cumulative sum by depth as follows;
The mSOC estimates were scaled to represent a standard area of 1 m2, and the change in the resulting SOC stock (kg m−2) with depth was estimated by using a linear mixed effects model from the 'nlme' package in R (Bates and Pinheiro 1998, Pinheiro and Bates 2000) with three nested levels of grouping;
where the intercept is represented by β0, the depth slope by β1, and b1, bij and bijk are the random effects at site (i), cluster within site (j) and plot within cluster within site (k) random effects, while denotes the within group errors. The above model was used to predict SOC stocks to 30 cm (SOC30) for each soil profile (n = 640).
Finally, an ensemble modeling approach using the 'randomForest' library in R (Breiman 2001) was used to predict SOC30 as a function of Landsat ETM+ reflectance for each sampling plot. A random forest model represents a form of bagging (Breiman 1996), where large sets of de-correlated trees are built and the resulting predictions are averaged (Prasad et al 2006). An 'out-of-bag' test sample is held out and used to estimate model error and for the calculation of variable importance. The resulting model was applied to a set of Landsat imagery from the GLS 2005 archive for the generation of maps of predicted SOC30. A data set consisting of 67% of the plots in the data set was used to develop the prediction model, while the remaining 33% was used for validation.
3. Results and discussion
We estimate SOC stocks to 30 cm, as this is the most relevant depth affected by land management practices, particularly in agricultural systems. As shown in figure 2 (top panel), we can reasonably assume a linear relationship between cumulative SOC stock (kg m−2) and soil depth (multiple r2 = 0.94) for each profile (section 3), and we therefore applied this model to predict SOC30. The model may be used for estimating SOC stocks to other depths within these profiles as well. Predicted soil carbon stocks to 30 cm are summarized for each site in the lower panel in figure 2. The estimated SOC30 stocks are lowest in Kipsing, which also has a lower within site variance than the other sites (lower panel, figure 2).
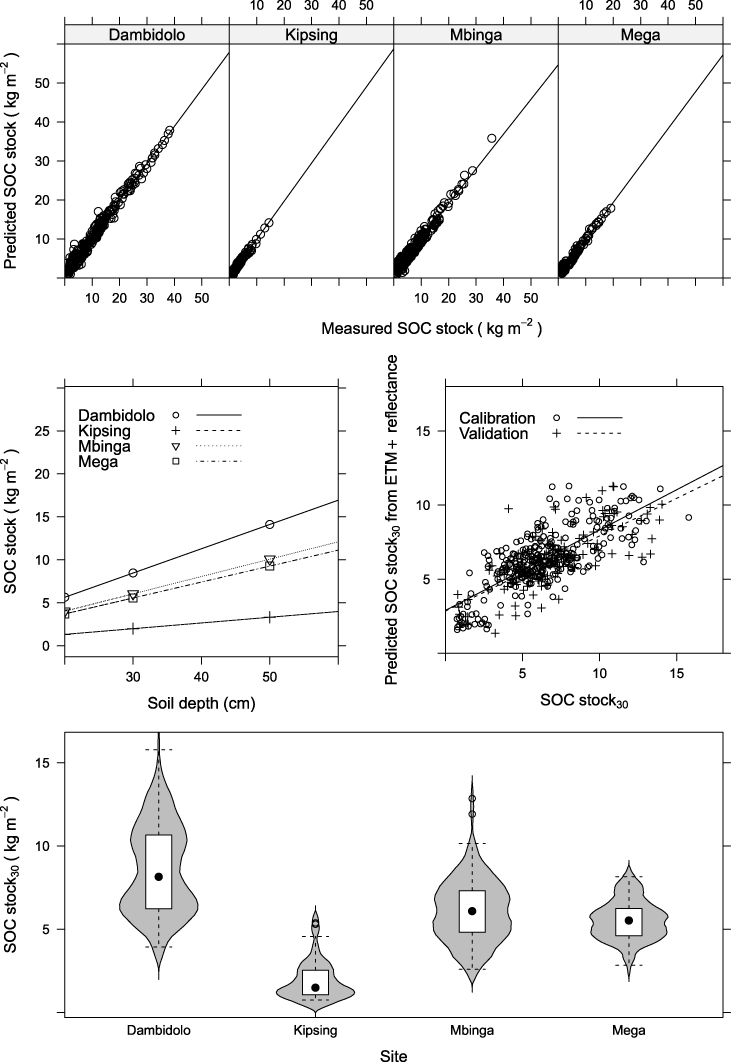
Figure 2. Summary of modeling results for calculation of SOC stocks. The top panel shows measured versus predicted SOC stocks using the LMM model in section 3, middle-left panel shows the average increase in SOC stocks by depth for each site, middle right panel shows predicted versus measured SOC stocks to 30 cm based on Landsat ETM+ reflectance. The lower panel shows a violin and boxplot of SOC stocks to 30 cm for each site.
Download figure:
Standard imageIn the middle-left panel of figure 2 we extracted the coefficients for the site-level random effects from the model in section 3 to predict SOC stocks cumulatively with depth. The plot shows average increases in SOC stocks by depth for each site, illustrating the widely contrasting SOC dynamics between these sites. The dry savanna Kipsing site has low SOC stocks overall, and the stocks increase moderately with depth, most likely due to the high prevalence of erosion (∼100%), which has removed most of the topsoil, as discussed later. In the more humid Dambidolo site, there is a stronger increase in SOC stocks with depth and higher stocks overall, while Mega and Mbinga show similar dynamics with depth, despite widely different climates. These estimates provide insights into variations in SOC storage potential between sites. On average, the estimates presented fall within the ranges reported by earlier studies for different ecosystems. For example, Post et al (1982) reported stocks of 5.4 kg m−2 in tropical woodland and savanna systems, and 9.9 kg m−2 in dry tropical forest.
3.1. Soil organic carbon dynamics
Differences in rainfall between sites explain about 20% of the variation in SOC30 stocks, therefore there must be other factors that strongly determine SOC stocks in these areas. A closer examination of the texture of the soils included in the study shows that average sand content is higher in Mbinga (21%) than in Mega (14%), and highest in Kipsing with about 47%. The interaction between sand content and rainfall explains 47% of the variations in SOC30 stocks between sites. This is most likely part of the explanation for the similar SOC30 stocks on average observed in Mega and Mbinga (figure 2), despite the much higher rainfall in Mbinga. One implication of this is that SOC stocks are strongly determined by inherent soil properties such as soil texture, which are not influenced much by management. Similar relationships between sand content, MAP and soil carbon were reported by Jobbágy and Jackson (2000), which are due to the much lower protection of SOC against microbial degradation in sandy soils than in soils that are clay rich.
The data used in this study had a wide range of land cover types, ranging from open grasslands, bushlands and woodlands to croplands and forest, although forested ecosystems have a small sample size in this data set. The only site with some forest was Mbinga, where estimated SOC30 in forested areas was 7 kg m−2 on average. Croplands were found mainly in the humid Dambidolo and Mbinga sites, and estimated SOC stocks varied strongly within these areas. The cultivated areas also had highly variable histories of conversion from native vegetation to cultivation. In Dambidolo, for example, most of the currently cultivated areas were converted from grasslands in the last 25 yr. In the drier ecosystems, grasslands had the highest estimated SOC30, while shrublands and woodlands had lowest SOC30 stocks overall (figure 3).
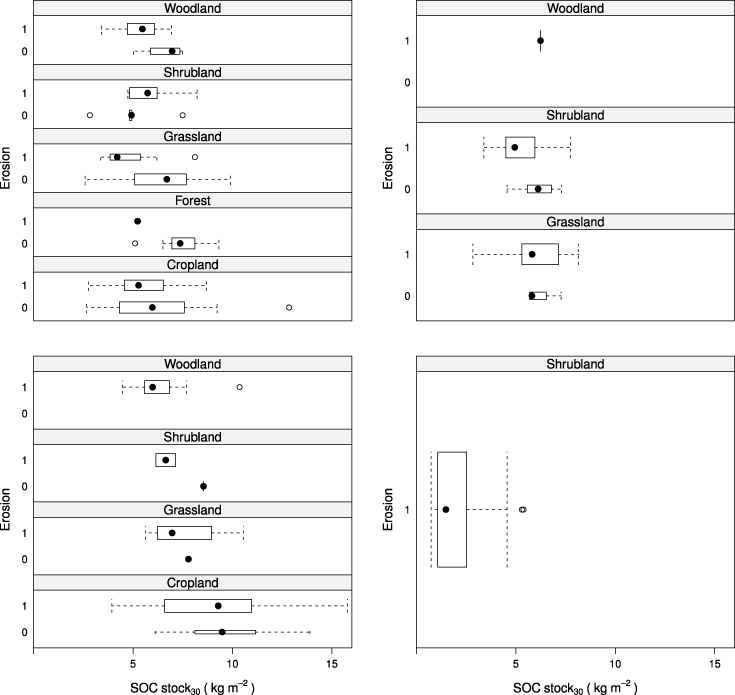
Figure 3. Estimated SOC30 stocks by land cover types for the four sites included in the study. The left side of the graph shows humid sites (top-left is Mbinga, bottom-left is Dambidolo), while the right shows dryland sites (top-right is Mega and bottom-right is Kipsing).
Download figure:
Standard imageWhile the effects of agricultural management practices on SOC stocks have been widely studied, the effects of soil erosion on SOC storage within land management practices are generally not well understood (Ogle et al 2005). The findings of the current study show that soil erosion affects SOC stocks strongly in all sites and across different land cover types. Hence, land management practices that lead to the control and reduction of soil erosion will be important mitigation strategies in these landscapes. Model estimates suggest that SOC stocks are lower by 0.9 kg m−2 (p < 0.01) on average in eroded versus non-eroded areas. This effect is stronger in woodland and grassland systems in Mbinga, where SOC30 stocks are lower by between 2 and 3 kg m−2 in eroded areas (summarized in figure 3).
In the drier ecosystems, the majority of the shrublands and woodlands had a high prevalence of soil erosion, possibly due to overgrazing leading to low herbaceous cover in these sites. Also, semi-arid ecosystems generally have aggressive rainfall events that can be highly erosive. The results suggest that the impact of grazing was high in both Mega and Kipsing. Impact scores were high for grazing in more than 90% of the plots surveyed in these sites. Although preliminary, these findings suggest that maintaining woody cover in these systems is not enough to reduce soil erosion and effective climate change mitigation strategies hence need to focus on the maintenance of a continuous herbaceous cover in order to reduce soil erosion and increase the potential for carbon storage in these ecosystems.
3.2. Mapping SOC stocks for assessing mitigation potential
Soil organic carbon stocks to 30 cm were predicted using Landsat ETM+ ground calibrated reflectance (middle-right panel in figure 2), with results indicating that the random forest models used have a reasonable level of prediction performance, with a multiple R-squared of 0.67 and 0.65 for calibration and validation data sets, respectively. These models are expected to become more robust in future assessments as a wider range of sites are included, including humid tropical forests.
The maps generated from these models at 30 m resolution (figure 4), clearly show the between-site differences in SOC30 stocks and also the high level of variability within each individual site (figure 4). These maps provide estimates of SOC stocks that are spatially resolved enough for assessing the complexity of SOC storage in these landscapes and for the identification of hotspots where management interventions may be targeted. When combined with assessments of the spatial distribution of erosion prevalence, spatially explicit recommendations can be made about areas where mitigation potential is high. Further efforts to develop the models used for generating the maps presented here are focusing on including sites also from the humid tropics, as well as near-real time predictions of SOC stocks for monitoring purposes.

Figure 4. Maps of predicted SOC stocks to 30 cm based on Landsat ETM+ reflectance for (a) = Dambidolo, (b) = Mbinga, (c) = Kipsing and (d) = Mega. Black dots are sampling plots.
Download figure:
Standard image4. Conclusions
We have demonstrated the use of cumulative soil mass for estimating SOC stocks across landscapes, as part of systematic land and soil health surveys. The method applied is simple and allows for repeatable and robust measurements of soil carbon stocks in different soil types and under different land cover and land-use systems. Further, we have shown the potential for mapping of SOC stocks to 30 cm using Landsat ETM+ reflectance across four study sites in East Africa that cover a wide range in climate and soil conditions.
The results of the study show that climate alone describes only part of the variations in SOC stocks between sites and that inherent soil properties such as sand content are often more important than climate effects alone in determining SOC dynamics. The developed maps are at a spatial resolution that allows for the assessment of SOC dynamics across complex landscapes, and for spatially explicit decisions to be made about important areas for mitigation activities. In the particular sites included in this study, soil erosion is a major factor leading to losses in SOC stocks, often overriding the effects of land cover or land use. Hence, the management of soil erosion has major potential as a mitigation strategy. In the dryland sites, managing woody cover is not enough to reduce erosion prevalence and hence stabilize or increase SOC, or reduce its loss, and mitigation strategies also need to focus on improving the condition of the herbaceous cover. This calls for the implementation of improved grazing and better livestock management in these ecosystems.
Acknowledgments
This study was conducted with partial funding from Wajibu MS and the Bill and Melinda Gates Foundation (BMGF).